This year at DASH, we announced new products and features that enable your teams to get complete visibility into their AI ecosystem, utilize LLM for efficient troubleshooting, take full control of petabytes of observability data, optimize cloud costs, and more. With Datadog's new AI integrations, you can easily monitor every layer of your AI stack. And Bits AI, our new DevOps copilot, helps speed up the detection and resolution of issues across your environment. We introduced new products that help you secure your cloud infrastructure, find vulnerabilities in your application code, and conduct historical security investigations. We also expanded our developer-focused features by adding static code analysis and end-to-end mobile monitoring. In this post, we recap these new offerings—as well as all the other key announcements from DASH 2023—and help you get started using them to gain deeper visibility into your environment.
LLM-powered observability and your AI ecosystem
Integration roundup: Monitoring your AI stack
As AI development accelerates across industries, Datadog is at the forefront of helping you gain visibility into every layer of your AI-optimized tech stack, from infrastructure and data storage to models and service chains. Integrating machine-learning models into your applications and workflows often means leveraging a number of specialized technologies, including vector databases like Pinecone and Weaviate, development platforms like Vertex AI and SageMaker, and discrete GPUs from providers like CoreWeave. With our 12 new AI integrations—including our NVIDIA DCGM Exporter integration—you can access out-of-the-box dashboards with visualizations and metrics tailored to each component of your stack, enabling you to ensure that your models effectively scale according to your business needs. Read our blog post to learn more.

LLM Observability
The introduction of pre-trained large language models (LLMs) such as GPT and BERT has revolutionized the usage of generative AI technology. While implementation of LLM-powered applications has become easier, it is difficult to gain visibility into the underlying LLMs as application developers and machine learning engineers have limited control of or insight into how these pretrained models operate. This may lead to model underperformance or even inaccuracies such as model hallucinations that create business and reputational risks. Datadog LLM Observability enables users to observe prompts and responses in order to track model performance, identify opportunities for improvement, and optimize the end-user experience. LLM Observability provides an always-on solution that continuously monitors your LLMs to identify problematic clusters, model drift, and specific prompt and response characteristics that impact model performance. To easily monitor your LLMs in production, you can request access to LLM Observability in Preview.
Bits AI: Datadog's generative AI interface
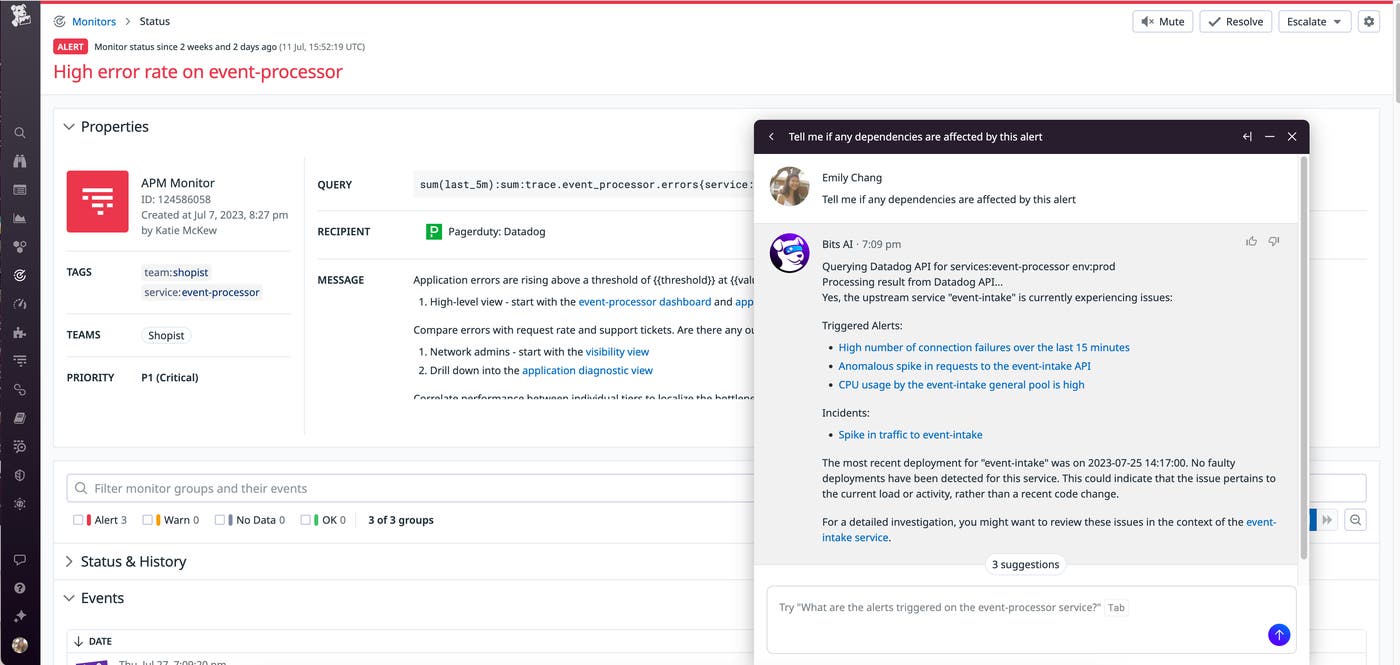
Bits AI is your new DevOps copilot, helping you investigate and respond to incidents more efficiently across the Datadog web app, mobile app, and Slack. You can converse with Bits AI in natural language to query data from Datadog products like APM, Log Management, Cloud Cost Management, Real User Monitoring, and more, and surface key insights like faulty deployments, log and trace anomalies from Watchdog, and Security Signals—all in one place. In addition to helping you investigate issues, Bits AI can also help you streamline incident management by paging on-call responders, summarizing the incident timeline to get your teams up to speed, and drafting a postmortem. With the power of generative AI, Datadog can help identify and suggest fixes for code-level issues, generate synthetic tests to proactively improve your user experience, and find and trigger workflows to automatically remediate critical issues. Bits AI is available in Preview. To sign up, fill out this form. To learn more about Bits AI, check out our blog post.
Log Management
Flex Logs
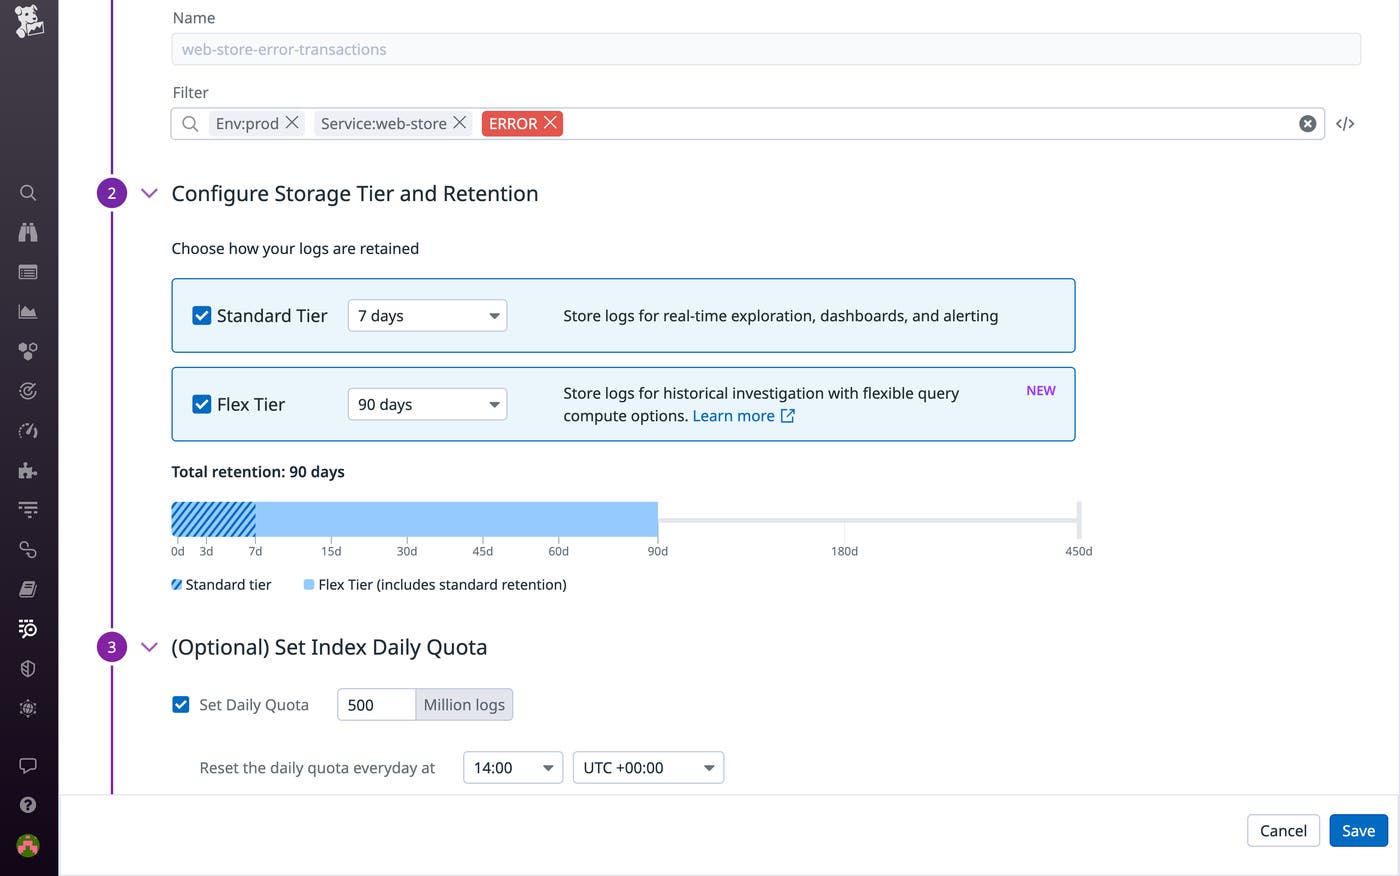
The volume of logs that organizations collect from all over their systems is growing exponentially. As a result, logs have become increasingly difficult to manage. Organizations must reconcile conflicting needs for long-term retention, rapid access, and cost-effective storage. In response to these challenges, we're pleased to introduce Flex Logs. Building on the flexibility offered by Logging Without Limits™, which decouples log ingest from storage—enabling Datadog customers to enrich, parse, and archive 100% of their logs while storing only what they choose to—Flex Logs decouples the costs of log storage from the costs of querying. It provides both short- and long-term log retention for a nominal monthly fee without sacrificing visibility, eliminating the need for self-maintained databases and enabling seamless correlation between all of your logs, metrics, and traces. With Flex Logs, Datadog provides a solution to all of your logging use cases within one platform. Flex Logs is in Limited Availability. Datadog Log Management users can sign up with this form to get started or learn more in our dedicated blog post.
15-min unsampled Live Search for Log Management
With thousands of logs generated every minute from your infrastructure, applications, services, and devices, retaining this copious amount of data for active search and analysis can be cost-prohibitive. Stream-based monitoring solutions are gaining popularity because they can support real-time troubleshooting and eliminate the need to store data that only needs to be leveraged transiently.
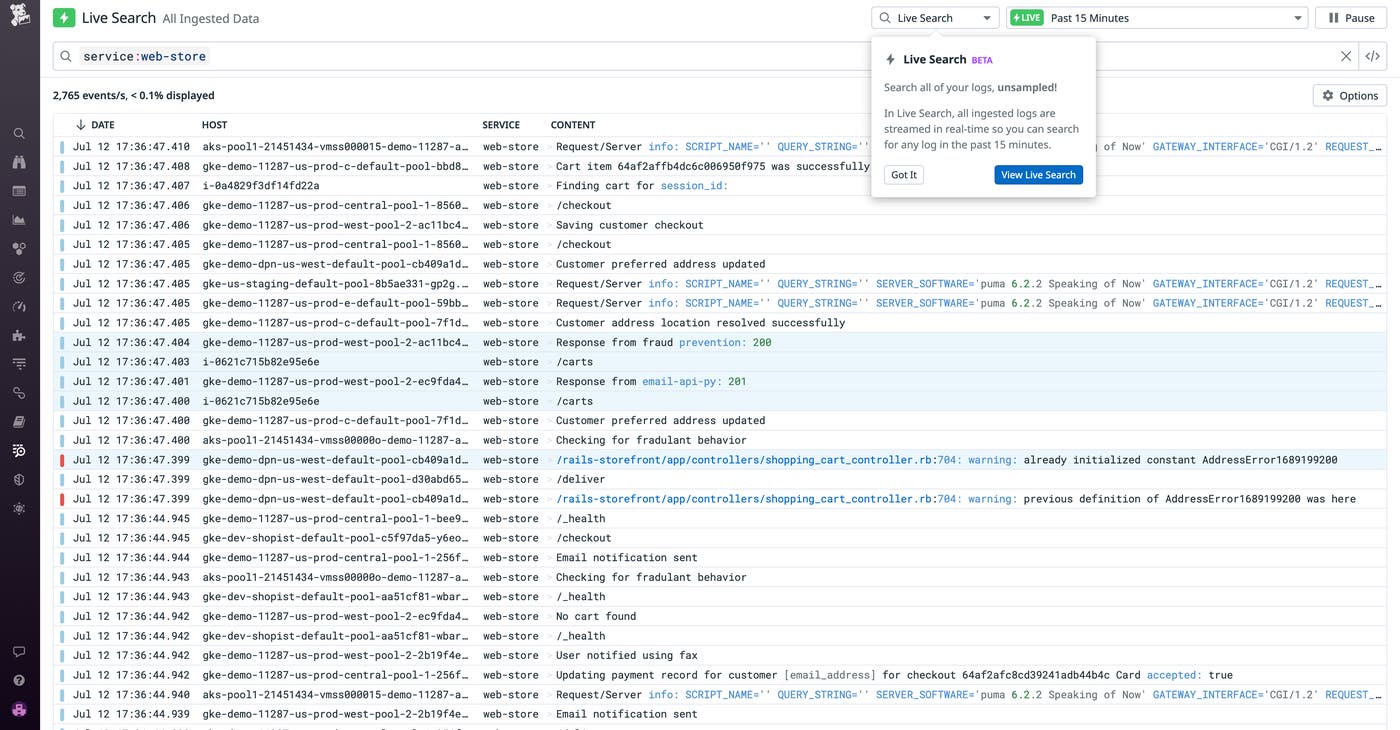
To support your troubleshooting efforts, we offer a new stream-based feature, Live Search for Datadog Log Management, now available in Preview. Live Search for Log Management supports real-time troubleshooting investigations by providing search and analysis capabilities across all ingested logs for the past 15 minutes, completely unsampled. Live Search gives you full visibility into all of your logs post-processing—regardless of how you've configured your indexes, quotas, or exclusion filters. Live Search also conveniently correlates with APM Live Search, so you can view, search, and analyze all logs within the last 15 minutes that are associated with a specific trace. Live Search for Datadog Log Management is designed to handle data at petabyte scale, and enables you to view and query all ingested logs without any pressure to retain them. Learn more about Live Search for Log Management and request access to the Preview from our dedicated blog post.
Add context to your logs at query time with Reference Tables
Logs are an invaluable resource for investigating application errors, security incidents, and performance issues, but they often lack contextual data that is critical for helping teams understand how to best tackle a problem and prioritize issues. For example, logs may include customer IDs but not other relevant data like customer names, generated revenue, sales region, or support tier.
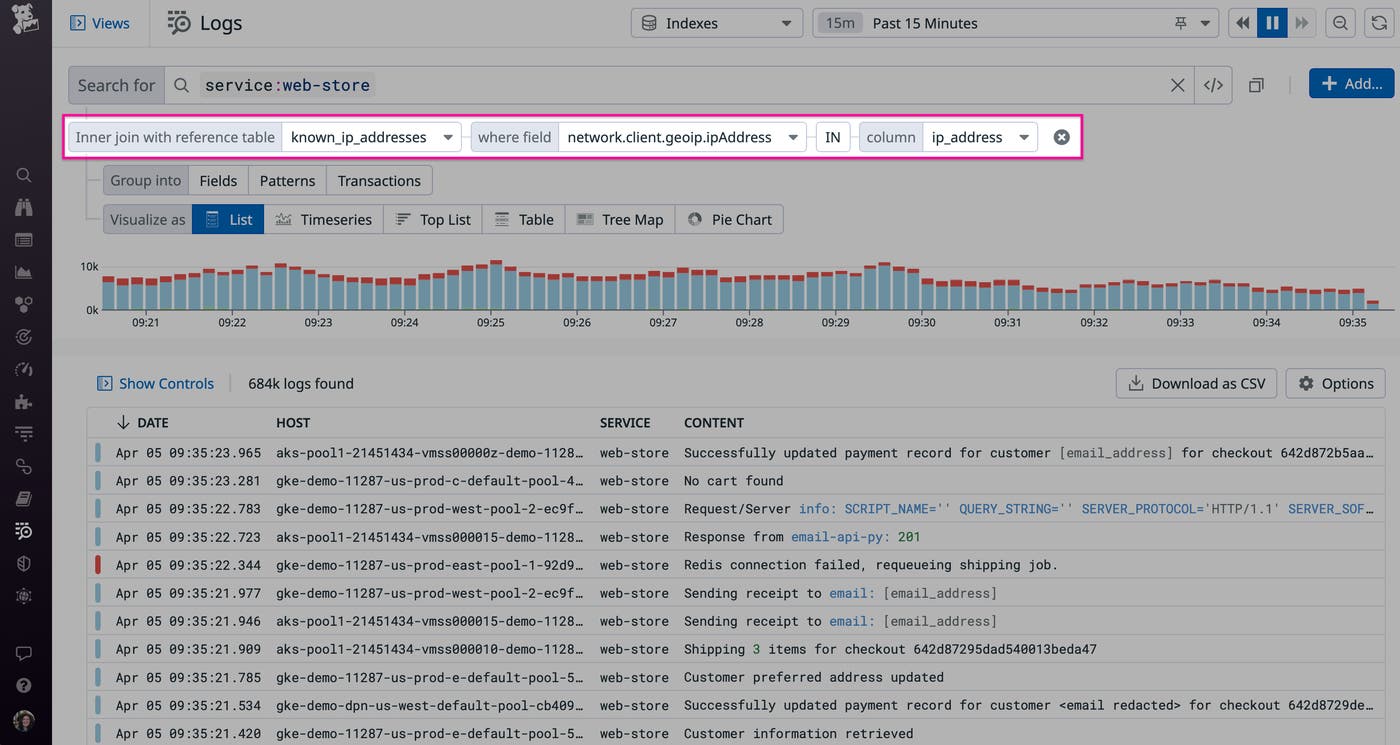
Datadog's Reference Tables solves this problem by enabling you to enrich your logs with your own data. You can use Reference Tables to add business-critical customer information to your logs at query-time, for example, so you can search for and prioritize issues that affect a particular segment of customers. During security incidents, Reference Tables that contain details like threat IP addresses can help you pinpoint the source of malicious activity. Reference Tables are also deeply integrated with the Log Explorer, so you can use them to filter your logs at query time and ensure that you have the up-to-date context you need for audits, investigations, and more.
Reference Tables and the ability to enrich and filter logs at query time are now available. Check out our dedicated blog post for more information.
APM and service governance
Set up APM in minutes with Single-Step Instrumentation
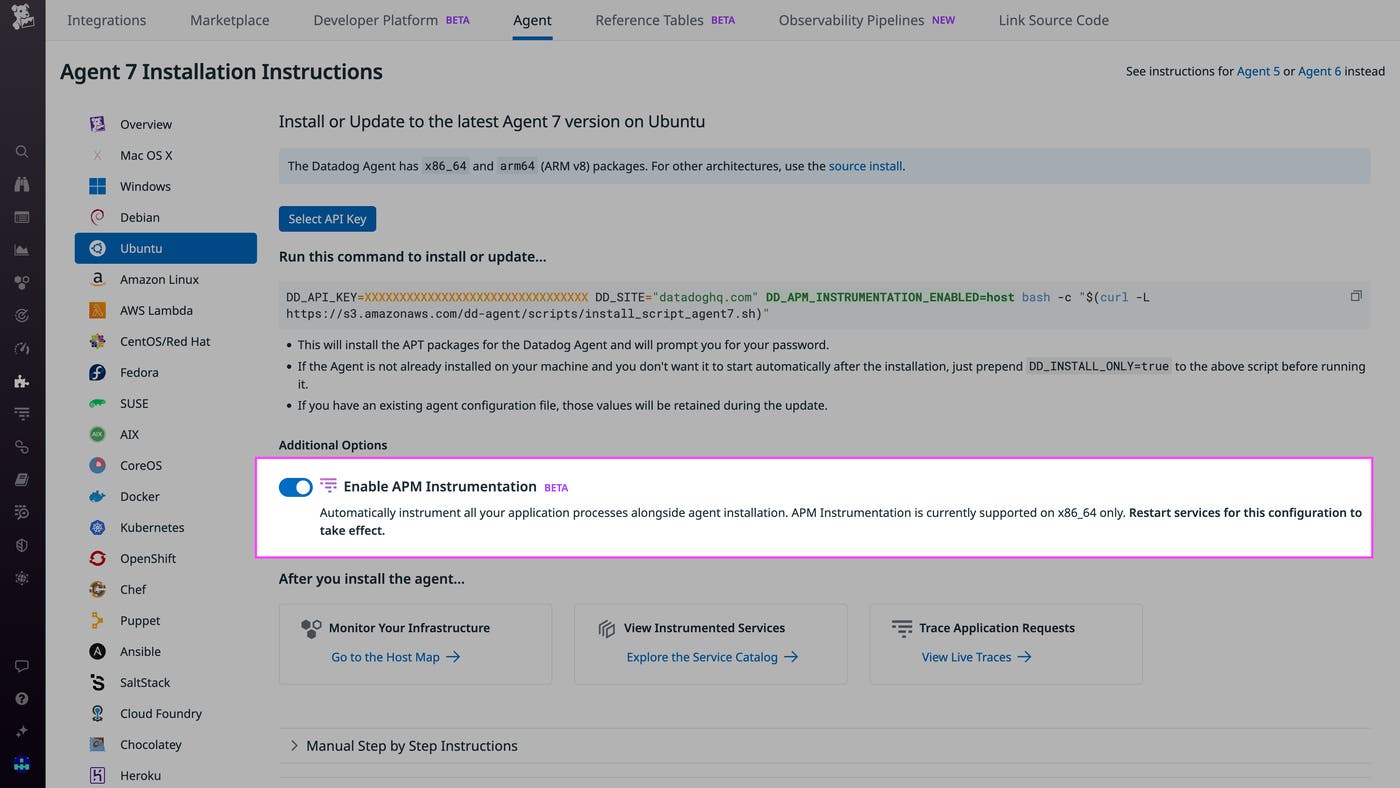
Datadog’s market-leading APM solution provides users deep, service-level insight with telemetry in context and AI assistance, so they can observe, troubleshoot, and improve their cloud-scale applications. However, large organizations can struggle to efficiently set up APM via the instrumentation of code owned by disparate infrastructure and application teams. To help customers roll out distributed tracing more quickly and easily across their entire organization, Datadog APM now offers Single-Step Instrumentation. This means that a single engineer can instrument all services in minutes at the same time they install the Datadog Agent, which automatically adds the relevant client library to the application’s code. In addition to Single-Step Instrumentation, we have built support for remote instrumentation and configuration into the Datadog app, as well as auto-instrumentation for Go. To try out any of these new features, fill out the Preview access request form.
Understand the business impact of backend errors with Trace Queries
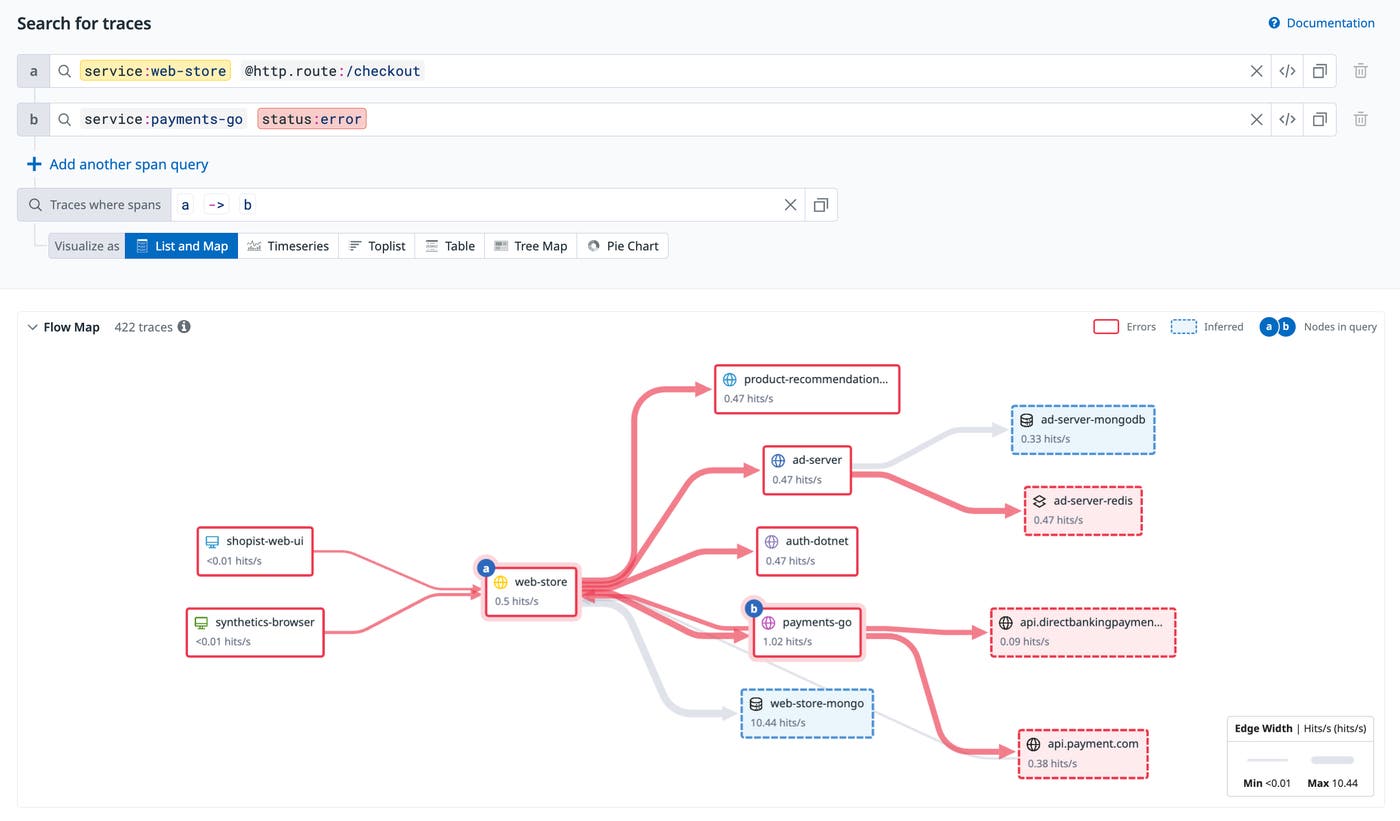
Datadog APM and Distributed Tracing help pinpoint the source of errors and latency anywhere in a request path—from the underlying infrastructure to a slow network and inefficient code. However, it can be grueling to conduct root-cause investigations with APM data and understand the business impact of issues when needed information is dispersed across different parts of a request. Trace Queries allows users to query multiple services, endpoints, and other attributes at once using boolean and other operators. This way, they can isolate a specific dependency to confidently find the source of an issue stemming from a downstream service, and quickly understand the impact on upstream services, endpoints, pages, and end users, which makes prioritization easier. Trace Queries is in Preview. Learn more in out documentation and request access via this form.
Reproduce exceptions with production variable snapshots in APM
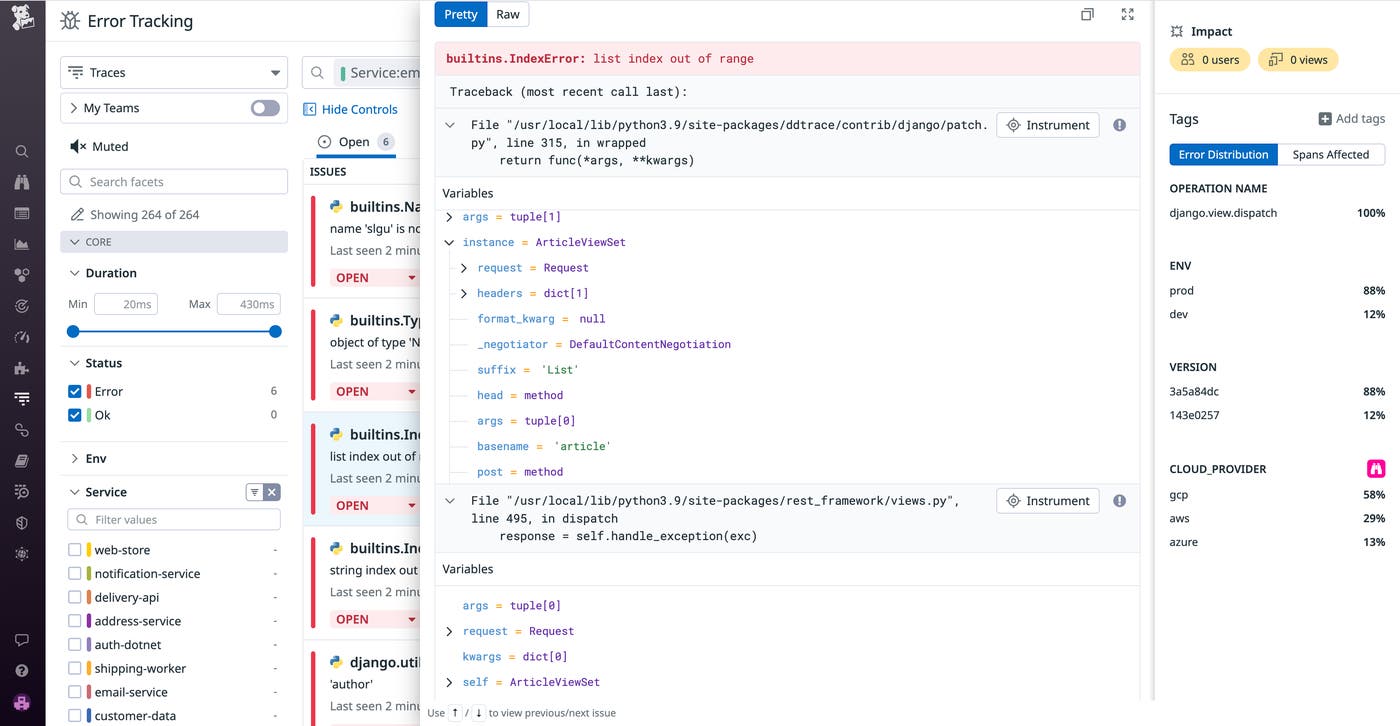
Debugging errors in production environments can be a complex and lengthy process that often disrupts your development cycle. Without access to the inputs and associated states that caused the errors, reproducing them becomes difficult. To help you remediate bugs and discover their root causes faster, Datadog now automatically captures variable snapshots in your APM error traces. Production variable data enables you to quickly reproduce exceptions that have surfaced in your traces and Error Tracking Issues with real production state and inputs. Variable values are collected and annotate each frame in the exception stack trace. Get started debugging errors and reproducing exceptions with Python variable data today by requesting access to our Preview.
Service Scorecards
The Service Catalog provides a centralized resource for your organization's knowledge of your services. Now, it also includes Service Scorecards, which help you identify and remediate observability gaps in your services. Service Scorecards highlight opportunities for teams to address shortcomings that could limit the visibility of their services—such as services that are missing SLOs or on-call schedules. They also make it easy to spot services that don't adhere to observability best practices, for example by not correlating APM data with logs. Stakeholders across the organization can see each service's score in three key categories—Ownership and Documentation, Production Readiness, and Observability Best Practices—and across custom scorecards that evaluate services based on rules you define. See our blog post and documentation for more information about Service Scorecards, which are now available.
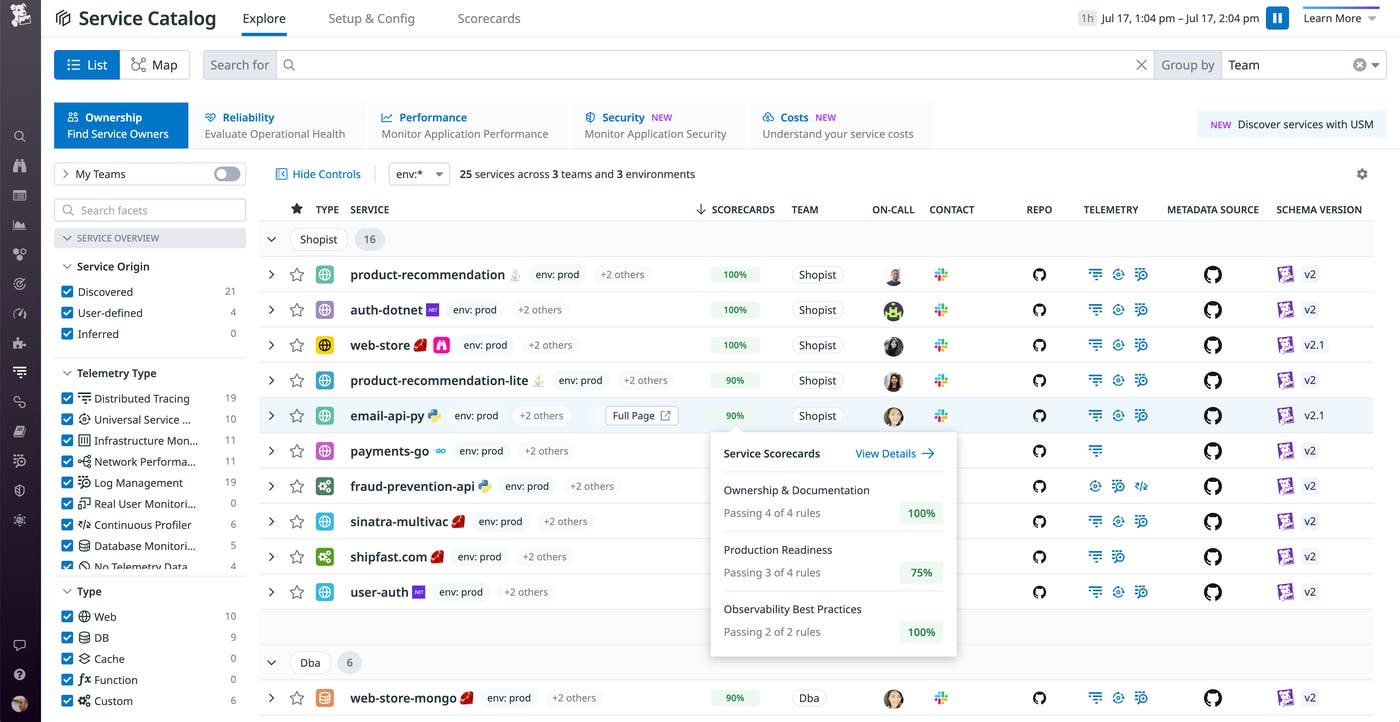
Enhanced visibility into service-to-service connections and inferred services
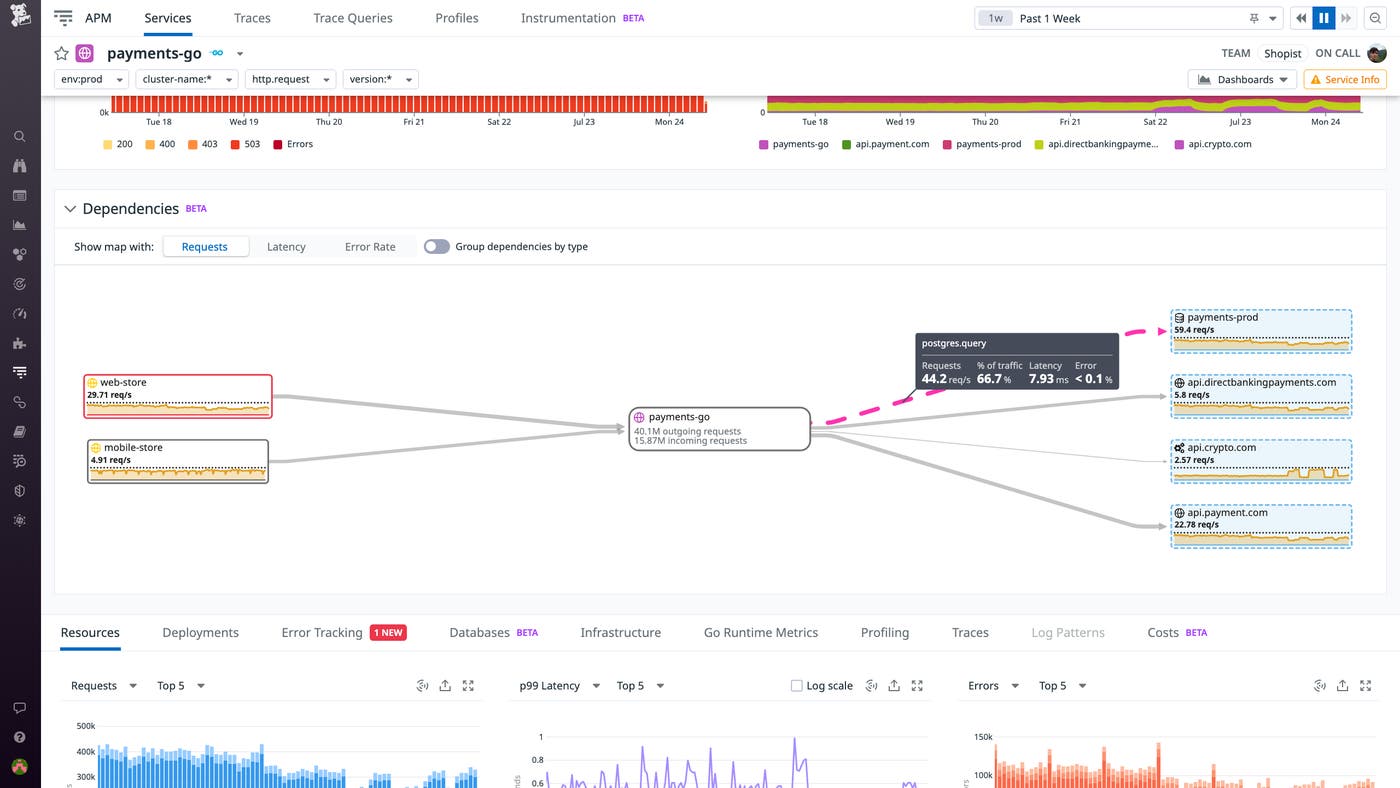
The health and performance of any service is inextricably linked to that of its dependencies. We're pleased to announce that Datadog APM now offers enhanced visibility into your interconnected services, both through the Service Map and through individual Service Pages. Service Pages now map each service's dependencies and provide full, unsampled statistics on service-to-service communication. That means you can now use APM to directly measure the request counts, latency, and error rates between any two services or between a service and its external dependencies, enabling you to quickly identify slow or failing connections.
Datadog now also automatically identifies non-directly instrumented dependencies such as external APIs and cloud providers based on span tags on your instrumented services. These inferred services are indicated by dotted node borders and highlighted in blue. You can inspect edge trace metrics by selecting an inferred service from either the Service Map or a Service Page. Enhanced dependency analysis on Service Pages and inferred services are both available in Preview. Datadog APM users can sign up here. To learn more about inferred services, check out our documentation.
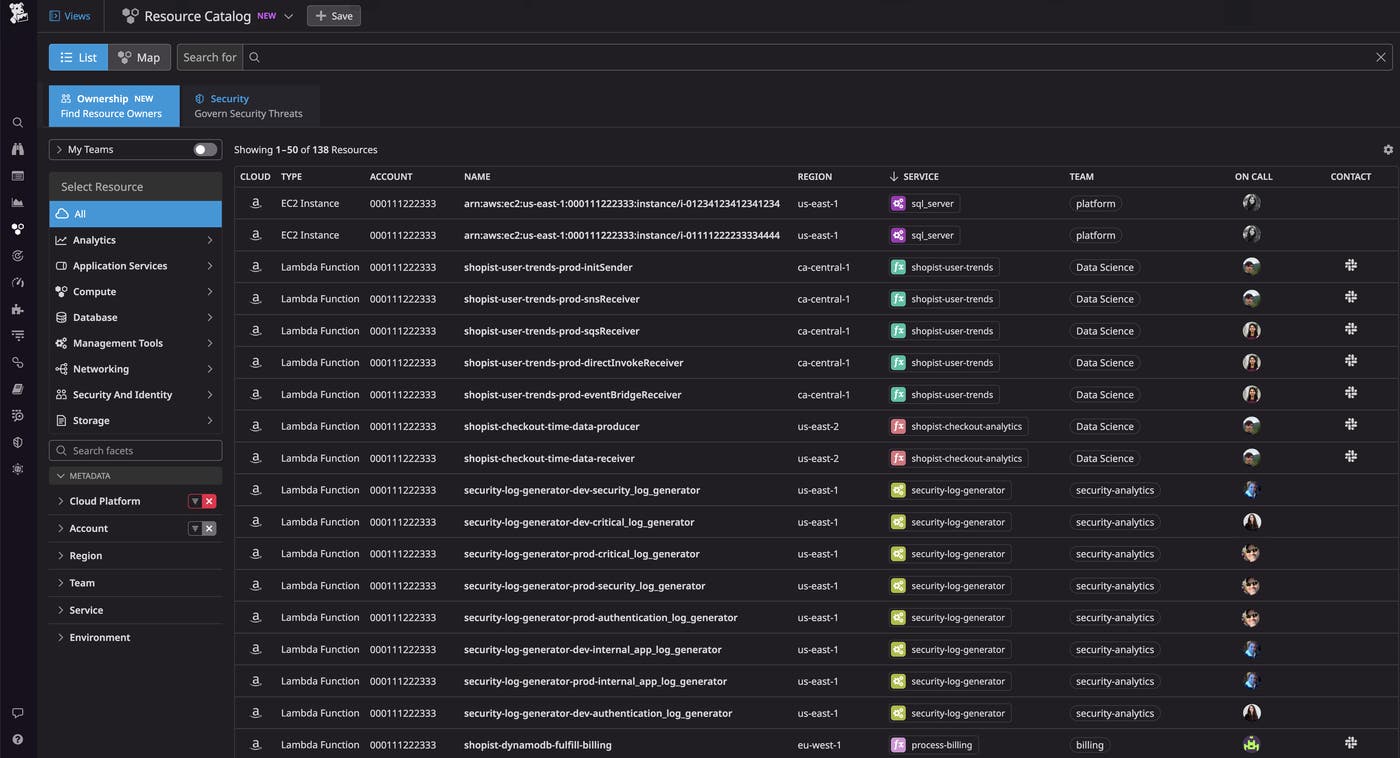
Resource Catalog Ownership tab
As your cloud environment grows in complexity, it can be difficult to understand which teams own specific resources and which services are running on them. Incident responders and security engineers often need to collaborate across teams to identify and troubleshoot upstream and downstream resources, but they may not know who to work with. And FinOps teams need to attribute the cost of resources to the teams that own them. The Resource Catalog now includes an Ownership tab that shows you which team owns a resource—including their contact information and on-call schedule—and what services that resource supports. By referencing this new tab, you can easily determine which resources are involved in an incident and quickly contact the relevant teams to resolve the issue, helping you minimize your MTTR. The Resource Catalog Ownership tab is currently in Preview; to request access, fill out this form.
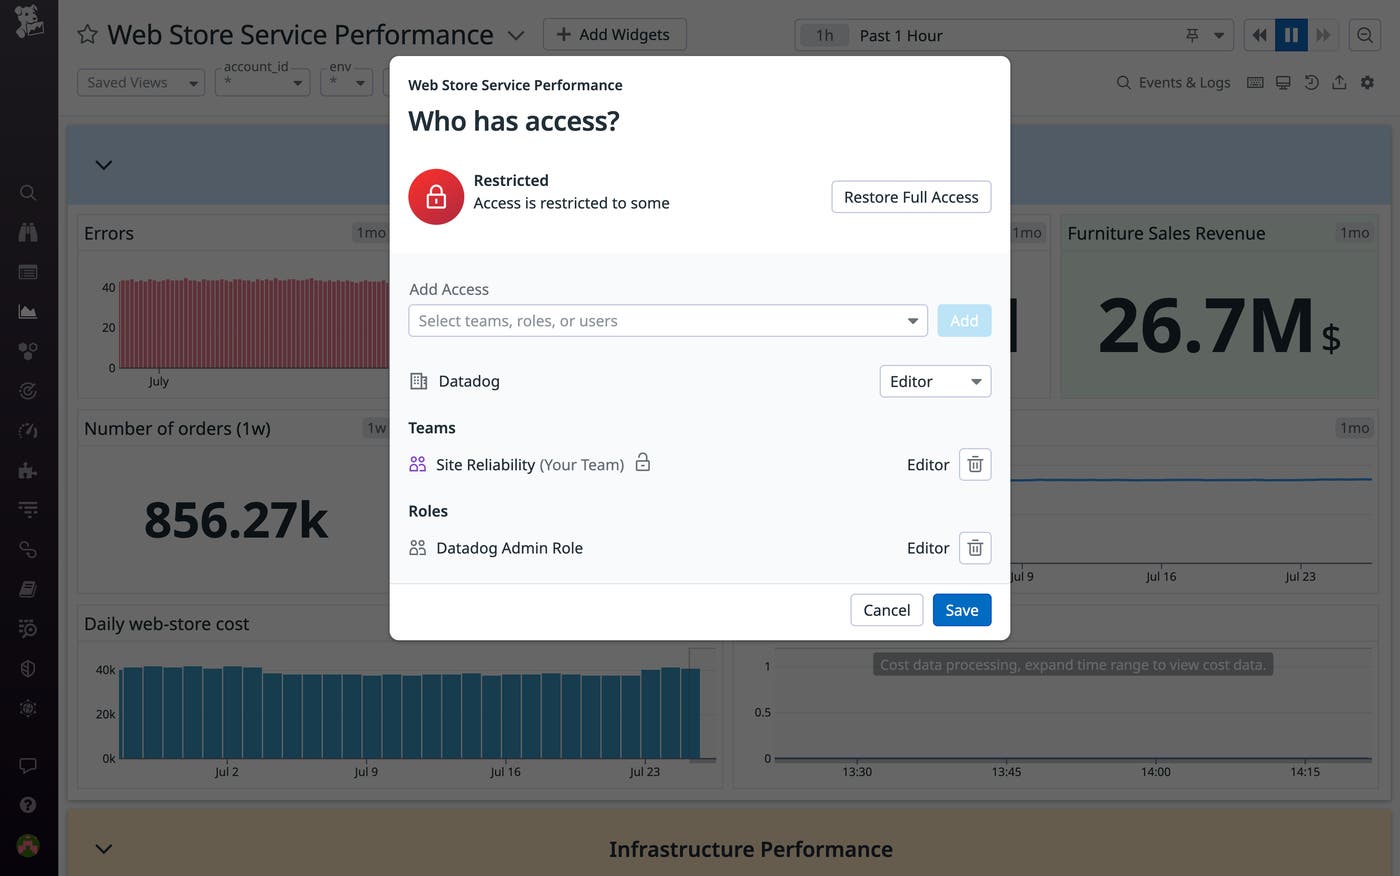
Define teams using identity providers data and control their access to individual resources within Datadog
Earlier this year, we introduced Datadog Teams, which enables streamlined collaboration and precisely tailored visibility throughout your organization by enabling you to designate team-specific assets and views. We're pleased to announce a three-part enhancement to Teams that can help organizations accelerate onboarding and strengthen their governance posture. First, by enabling you to define teams using data from Identity Providers, Teams now facilitates stronger authentication and inheritance of detailed profiles and contextual data.
Team memberships can be sourced from Azure AD or Okta SAML assertion files, either instead of or in combination with existing API-driven workflows and manual configuration. Second, our enhanced Attribute-Driven Access Control enables you to delegate team-based access to individual resources within Datadog. For example, you can assign edit permissions for any dashboard based on team membership. Finally, our enhanced Team Page makes it easier to grasp the membership and key resources of each team at a glance, enhancing visibility and transparency throughout your organization and enabling new hires to quickly get up to speed. These new capabilities are currently available in Preview—you can fill out this form to request access. To learn more about Datadog Teams, see our blog post or check out our documentation.
Ambassador program
Datadog is thrilled to announce the Datadog Ambassadors program, an initiative that aims to recognize and highlight individuals around the world who have significantly contributed to the Datadog community. Datadog Ambassadors are exceptional professionals who have shared their deep technical insights and creative solutions through blog posts, custom integrations, open-source software, and more. Selected based on their personal contributions and achievements, prospective Ambassadors can be nominated by Datadog employees or, eventually, by current Ambassadors. The annual membership comes with rich benefits, such as a trip to DASH, unique merchandise, and complimentary Datadog Certification exams. Datadog is excited to work with our inaugural group of eight Ambassadors as we continue to build a helpful and welcoming professional community focused on sharing knowledge.
To learn more about our first eight Datadog Ambassadors and the Datadog Ambassador program in general, you can read our blog post on this topic.

End-to-end security for all
Protect against IAM-based attacks with Datadog CIEM
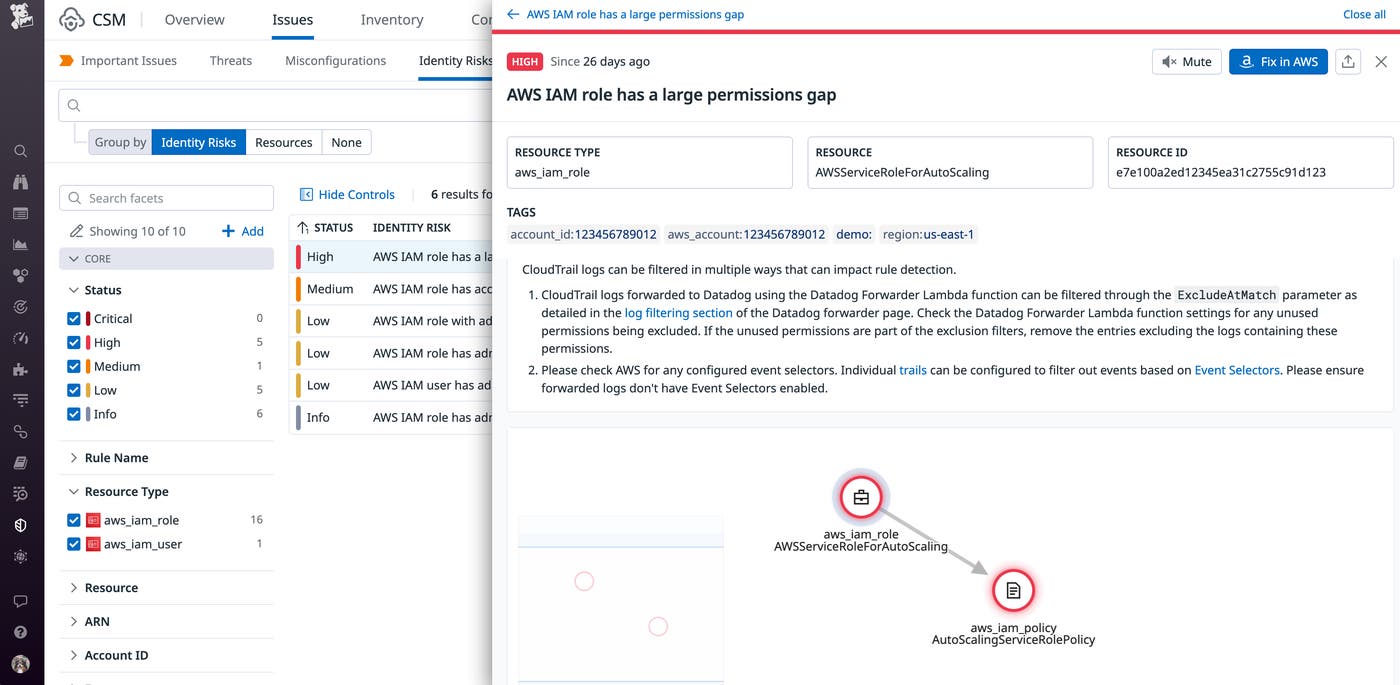
Identity and access management (IAM) is a crucial part of securing rapidly growing cloud environments. However, when teams provision resources, identities, and workloads quickly, it can be difficult to keep track of numerous direct and indirect permissions. That's why it's critical to keep your IAM configurations up to date to safeguard against any IAM-based attacks.
Datadog Cloud Infrastructure Entitlement Management (CIEM) enables you to continuously discover and address identity risks—such as permission gaps and administrative privileges—and reduce their blast radius before a threat actor can exploit them. You can address one identity risk at a time by grouping all resources—roles, policies, and groups—that carry that risk. Or, you can methodically review your resources and all of their associated identity risks. And to help you remediate any issues, Datadog CIEM also provides the necessary context for investigations and enables you to pivot directly to your AWS console to update your IAM configurations. Check out our blog to learn more.
Mitigate vulnerabilities with Datadog Infrastructure Vulnerability Management
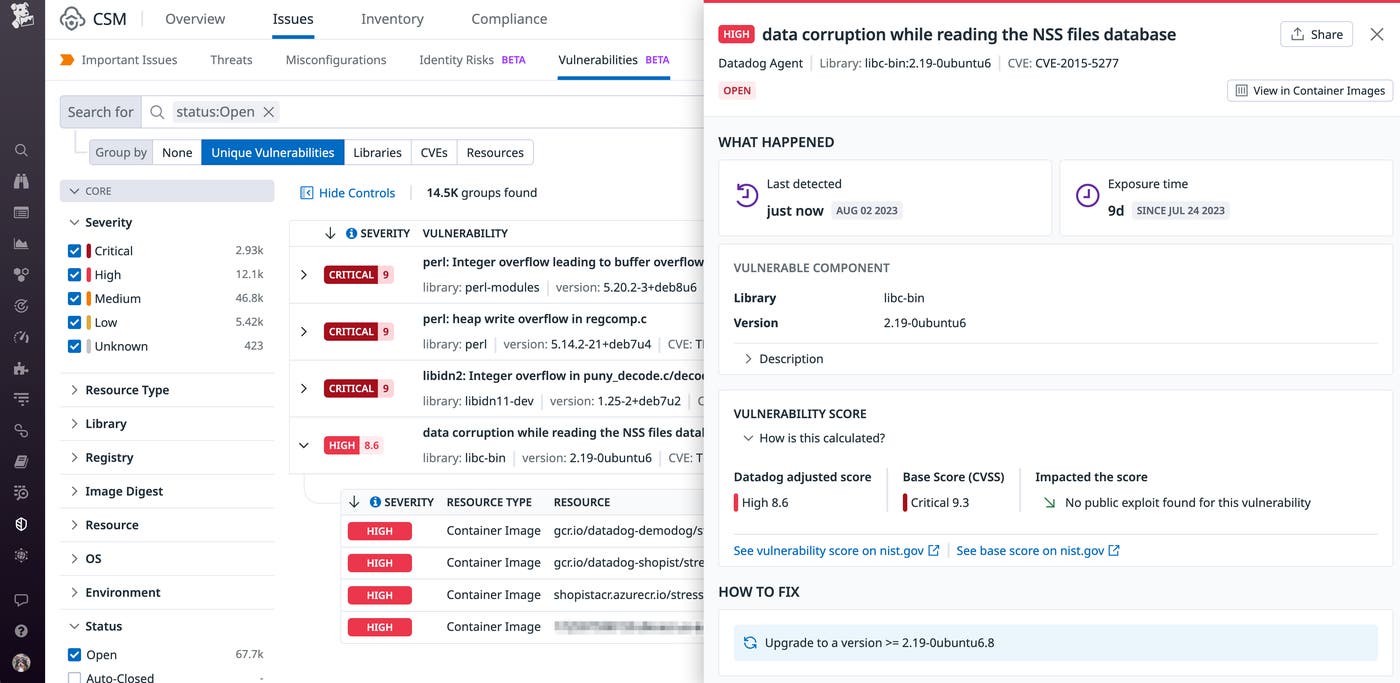
The cloud infrastructure that supports applications can comprise hundreds of thousands of hosts, containers, and serverless functions that change constantly. With this type of scale and complexity, it's often difficult to track critical vulnerabilities and gain a complete picture of which resources are vulnerable to specific threats. Datadog Infrastructure Vulnerability Management solves this problem by automatically identifying vulnerabilities in container images and hosts and offering context-rich insights into which ones need to be resolved first. With our security-focused insights, you can prioritize the most serious issues before they threaten your infrastructure. Check out our blog for more details.
Datadog Code Security
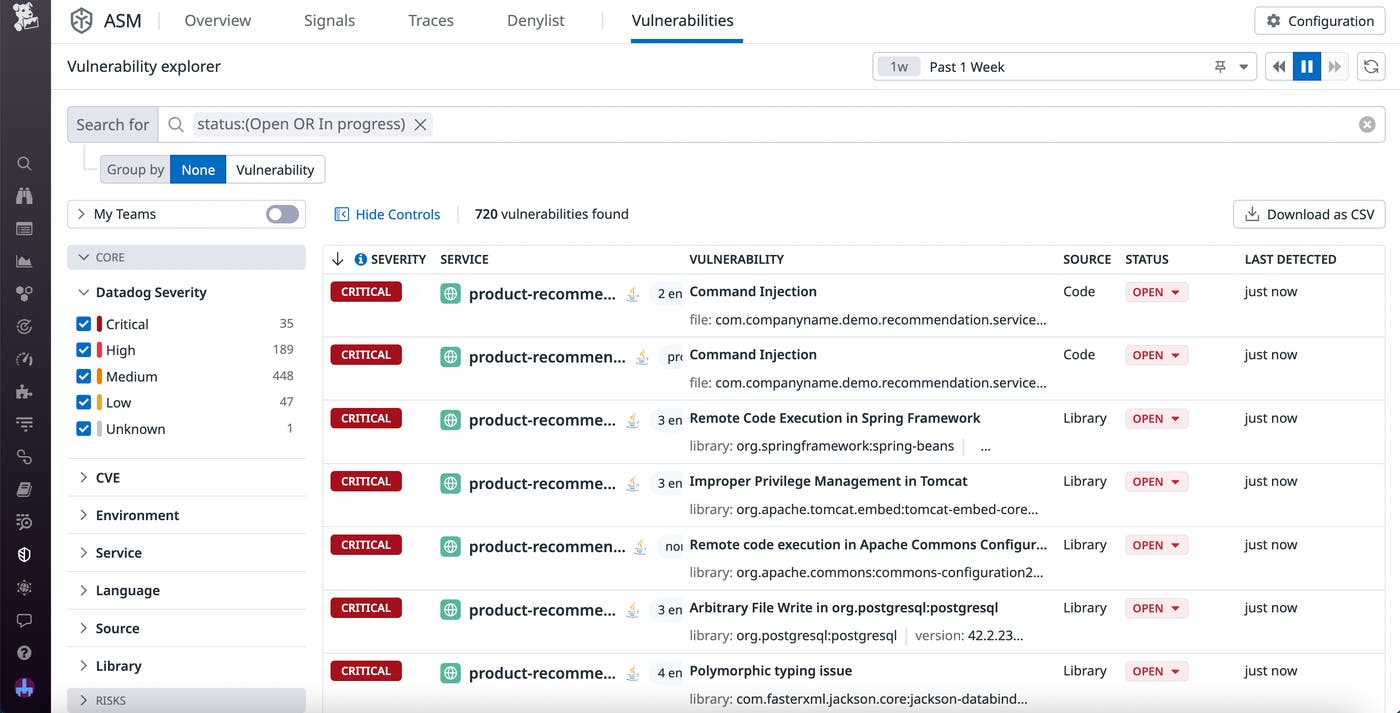
As the velocity of deliveries and deployments increases, it becomes more and more difficult to ensure that all the vulnerabilities in your code are caught by the time it reaches production. While there are many application security testing tools designed to help you catch these issues, they are often inaccurate, prone to false positives, and slow to run, making them impractical for monitoring fast-paced systems. Datadog Code Security detects vulnerabilities in your application code in real time, continuously monitoring your active code from within as it executes. With the Vulnerability Explorer page, you can easily view a list of the vulnerabilities that pose the greatest threat to your system, alongside meaningful risk scores and impacted services. And to help you quickly remediate issues, you can even view file names, line numbers, and snippets for the source code where the vulnerabilities were found. Check out our blog post to learn more.
Application Security Management - API Security
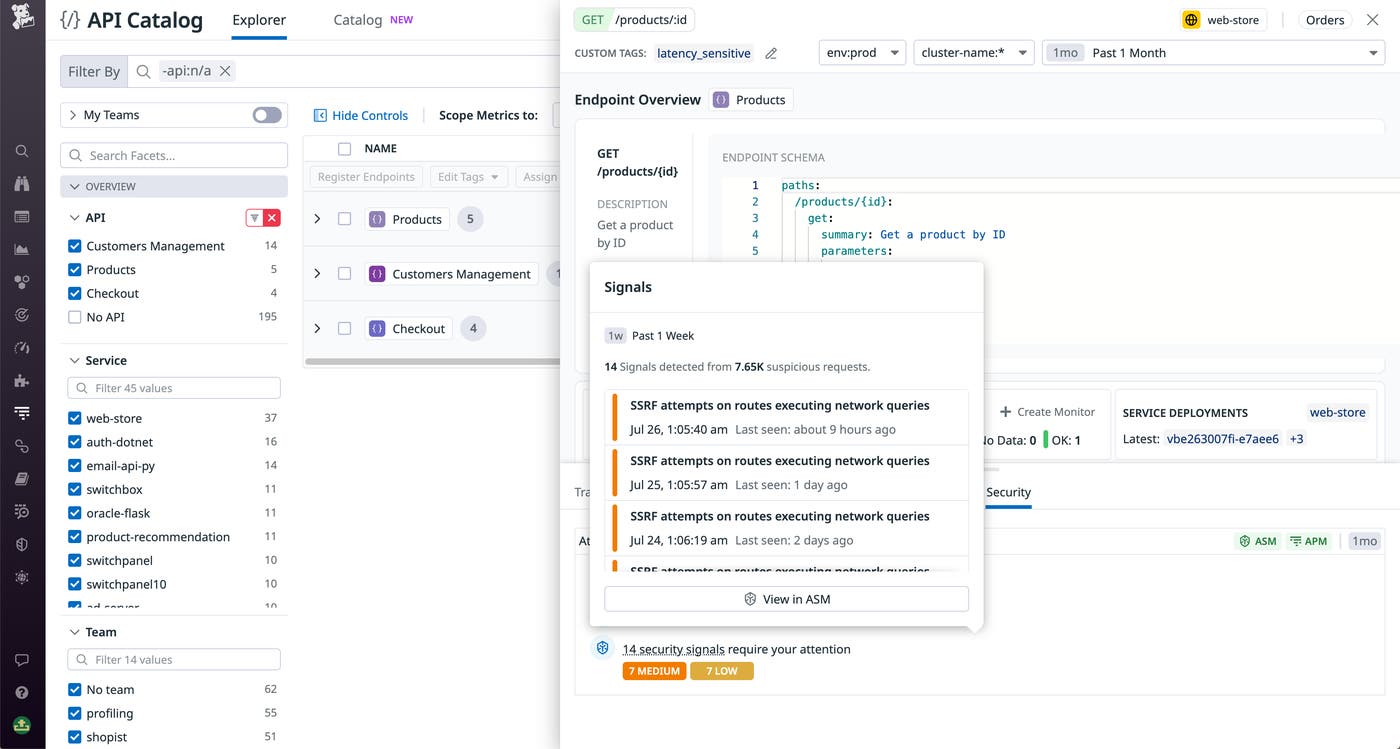
API-specific attack vectors are commonplace these days in large-scale, high-impact security breaches. Securing your APIs can't be done well with web application firewalls (WAFs) alone—you need tooling that understands your apps' authentication layers and business logic. Datadog Application Security Management (ASM) now extends its Threat Management and Protection capabilities to provide deep visibility into threats targeting your APIs. You can now use the API Catalog to pivot directly from viewing an API's health and performance metrics to ASM, where you can see attacks targeting your APIs. This includes attack attempts, which show the attacker's IP and authentication information, as well as request headers, which show details about how the attack was formed. By using ASM and API Management together, you can maintain a comprehensive view of your APIs' attack surface and respond quickly to mitigate threats. This feature is now available in Preview—sign up via this form. For more information about the API Catalog, see our documentation.
Historical security investigations with Cloud SIEM Investigator
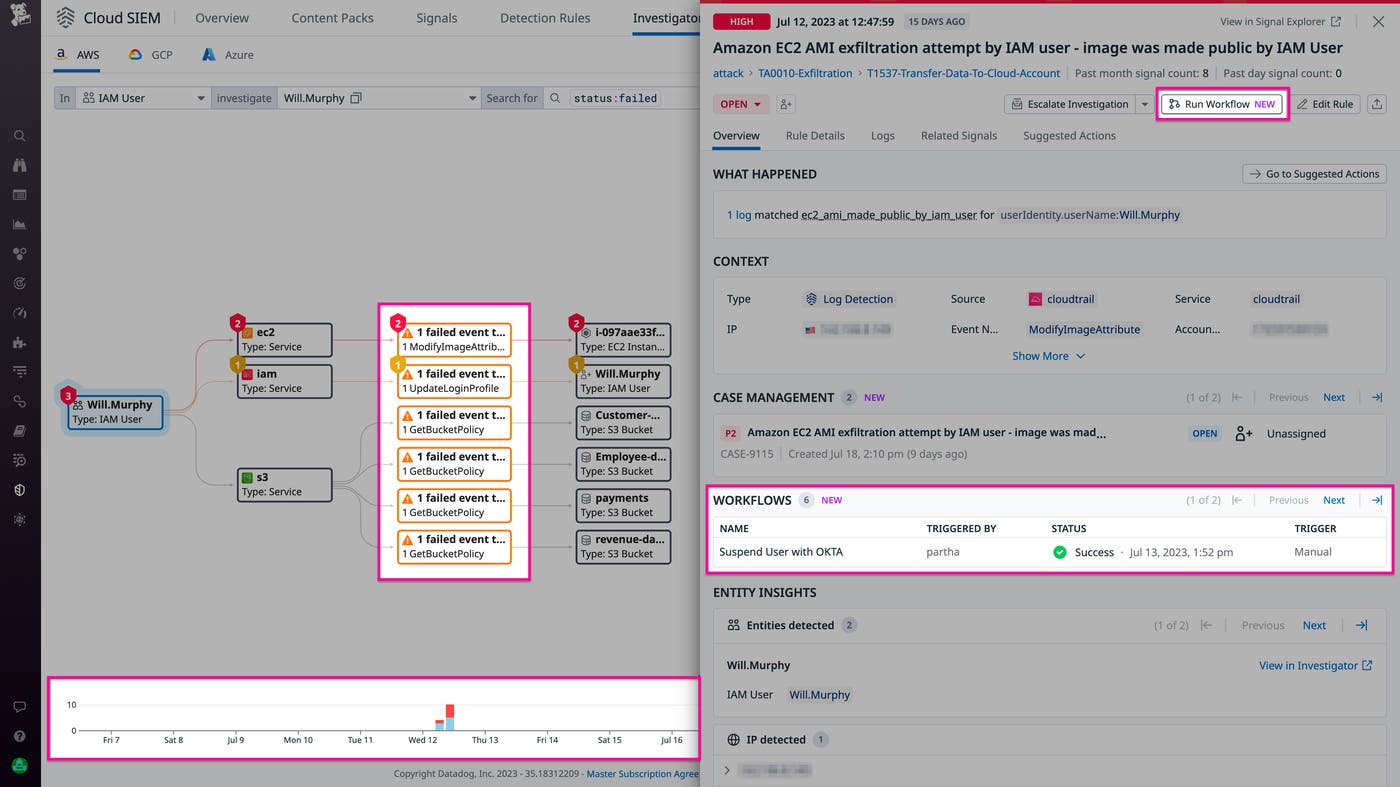
Security breaches often go undetected for months—typically long after log retention has expired—leaving investigators unable to answer critical questions about the scope and impact of the attack. Cloud SIEM Investigator lets you conduct historical security investigations that draw on a deep history of logs so that you can see how a security breach happened, even if it began long ago. By visualizing a complete history of the attack, you can identify malicious actors and their tactics. To quickly contain an active attack and mitigate ongoing risks, you can use Workflow Automation to trigger runbooks or remediation steps. Read our blog post to learn more about conducting historical security investigations with Cloud SIEM Investigator.
Investigate important security issues with CSM Security Inbox
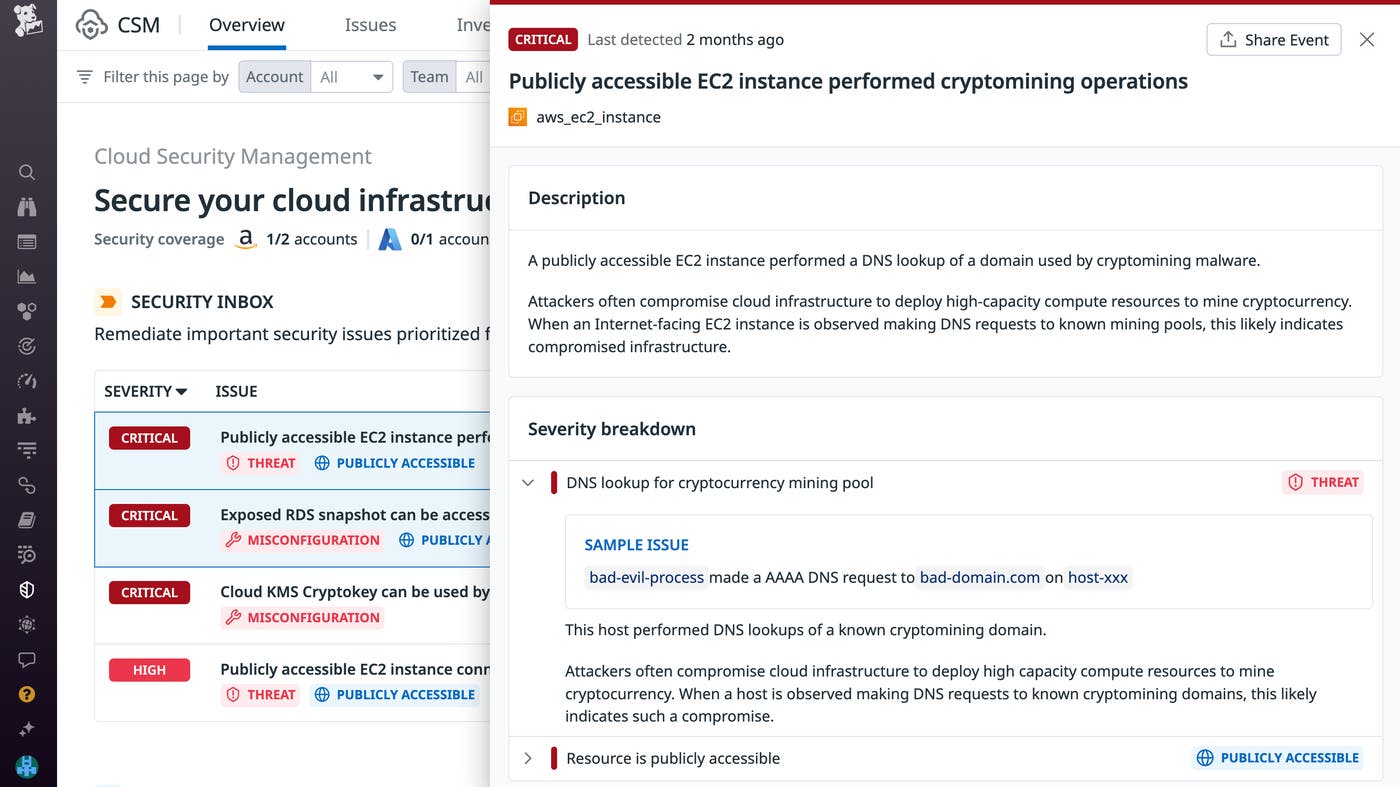
Security Inbox for Cloud Security Management (CSM) is a new capability that correlates and prioritizes your security issues into a single, actionable list. This helps you quickly respond to issues such as misconfigurations, identity risks, and runtime threats that require immediate attention. Security Inbox automatically groups risk factors—such as public accessibility, attached privileged roles, and critical vulnerabilities—into central root issues for you to address. By inspecting an issue, you can review the origin of different risk factors, explore various remediation actions, and gather more context on impacted resources.
To learn more about Security Inbox, check out our documentation.
Shift-left and developer experience
CI/CD
Enforce code quality and security standards with Quality Gates
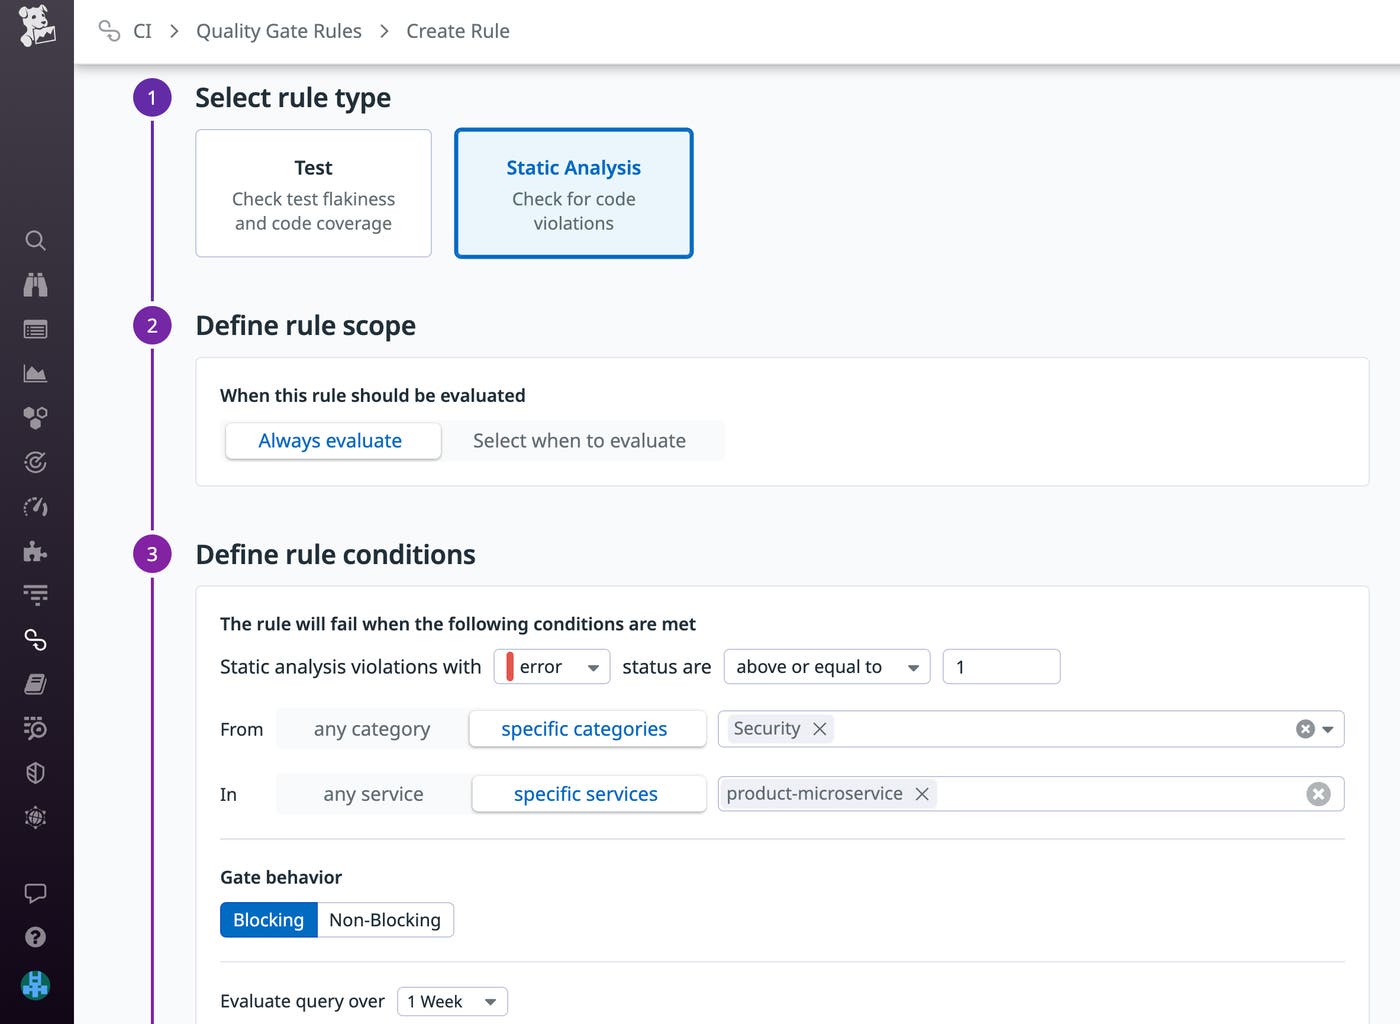
Datadog Quality Gates enables you to define flexible rules to ensure that deployments meet your organization's standards for code quality, performance, and security. You can configure out-of-the-box rules to block commits that introduce new flaky tests or contain Static Analysis violations. Quality Gates gives you the flexibility to decide which repositories and branches a rule should be evaluated for. It also enables you to strictly block deployments that contain critical errors, while creating non-blocking rules for code style violations and other noncompliances. For example, the rule shown below blocks any commit across your CI pipelines and workflows that introduces a security vulnerability to a specified service.
Quality Gates is now available in Preview. You can request access via this form and learn more by reading our blog post.
Static Analysis for Python
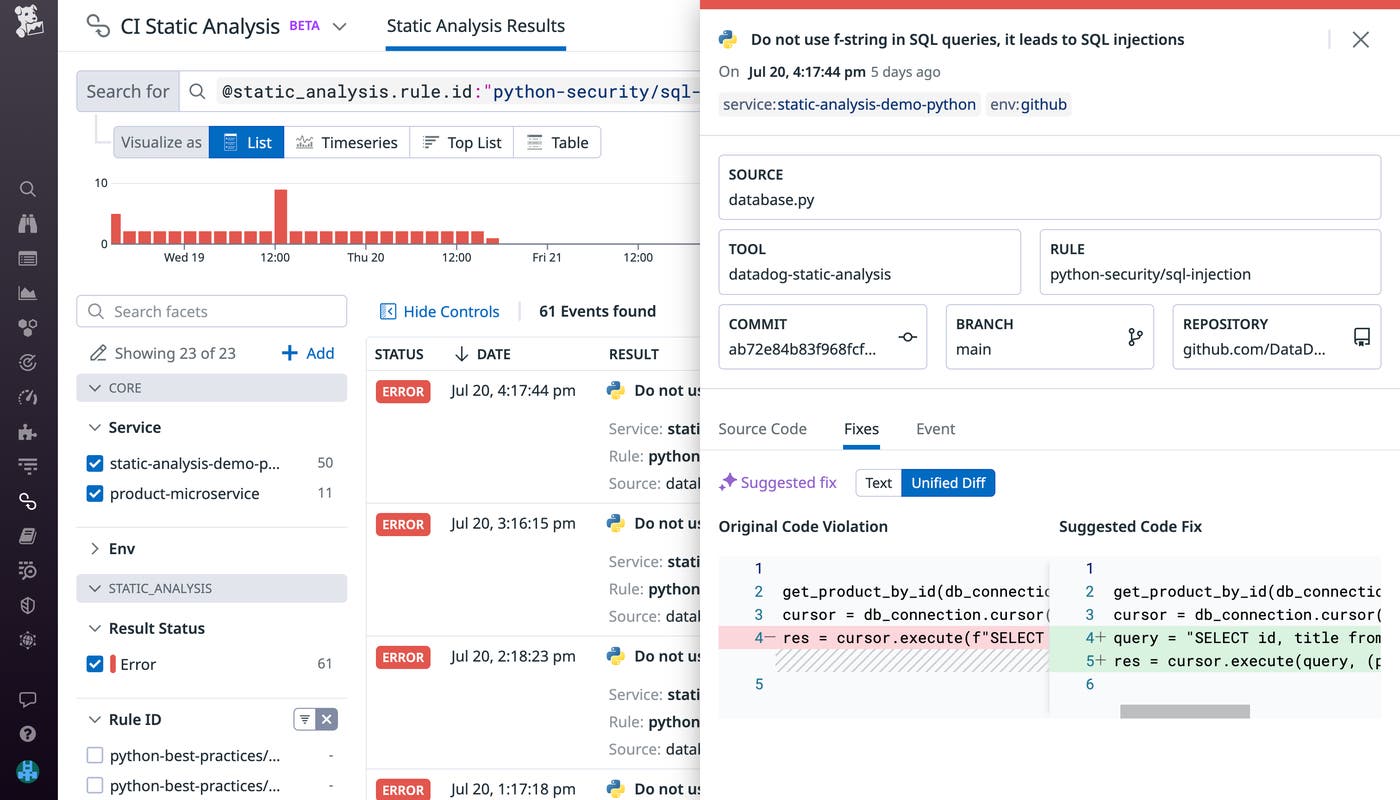
Datadog Static Analysis analyzes code prior to runtime to detect violations of best practices earlier in the software development lifecycle. This ensures that as your organization grows, new additions to your code base will stay compliant with existing quality standards. Static Analysis provides more than 80 out-of-the-box rules that enable you to detect issues that can break your code at runtime (e.g., an invalid number of parameters), violations of best practices (e.g., too many nested blocks), and security vulnerabilities (e.g., code that can lead to SQL injections, as shown below). To help you quickly resolve a violation, Datadog can automatically suggest a fix based on your code templates. If a template isn't available, you can also apply an AI-generated fix (shown below) to quickly improve your code.
Static Analysis for Python is now available in Preview. You can learn more in our documentation or request access by contacting our support team.
Digital experience monitoring
Mobile Session Replay
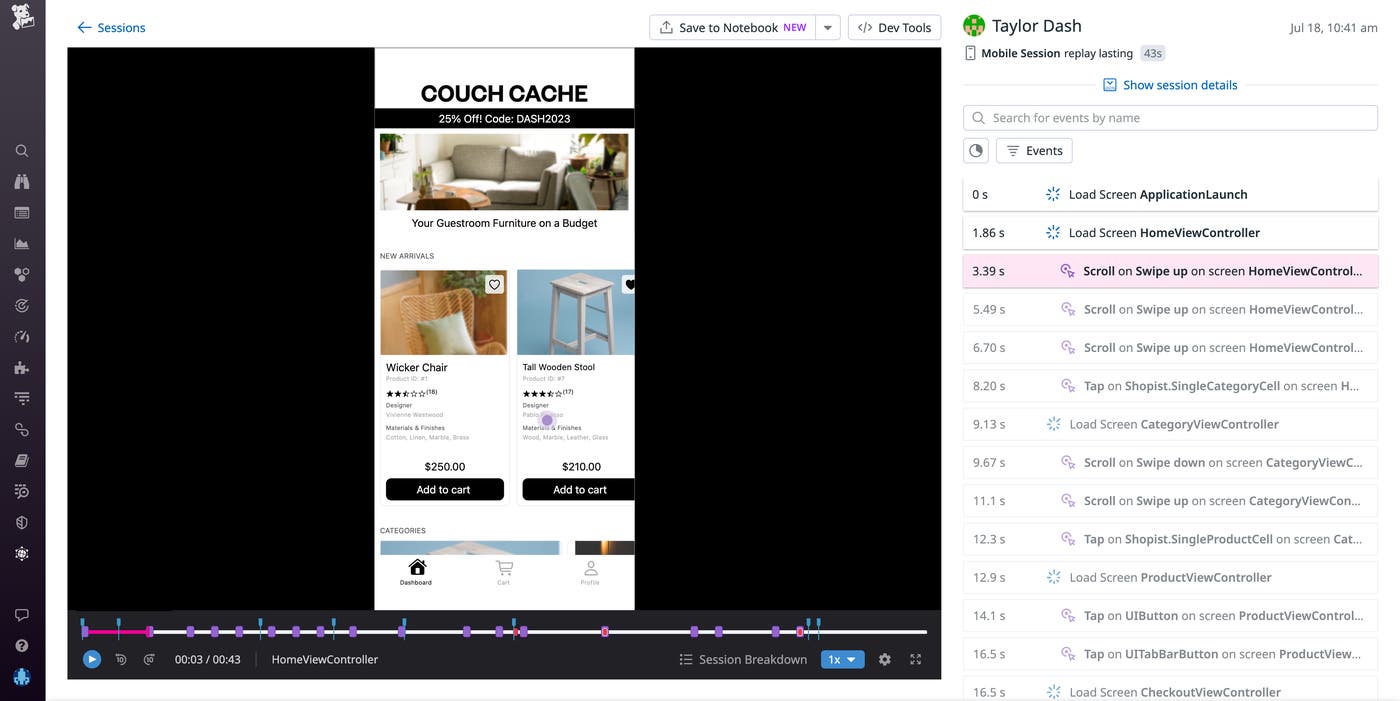
Engineers, designers, and product managers face specific challenges from the mobile community, such as expectations of fast load times, continuous availability, and a frictionless in-app experience across a wide range of devices. That's why we're proud to announce that Datadog's Mobile Session Replay is now available. Mobile Session Replay provides a visual reproduction of real user journeys through your application on a mobile device, enabling developers to recreate bugs and understand, from the user's point of view, where things went wrong. This recreation pairs existing troubleshooting data with a visual aid without slowing down your application, enabling you to get a clear and accurate picture of your end user's experience while ensuring that your application is performant. Mobile Session Replay can also help mobile teams understand how users interact with their features, thus improving developers' ability to create apps that serve customer needs and stand out in the crowded marketplace. Learn more in our full blog post.
Mobile App Testing
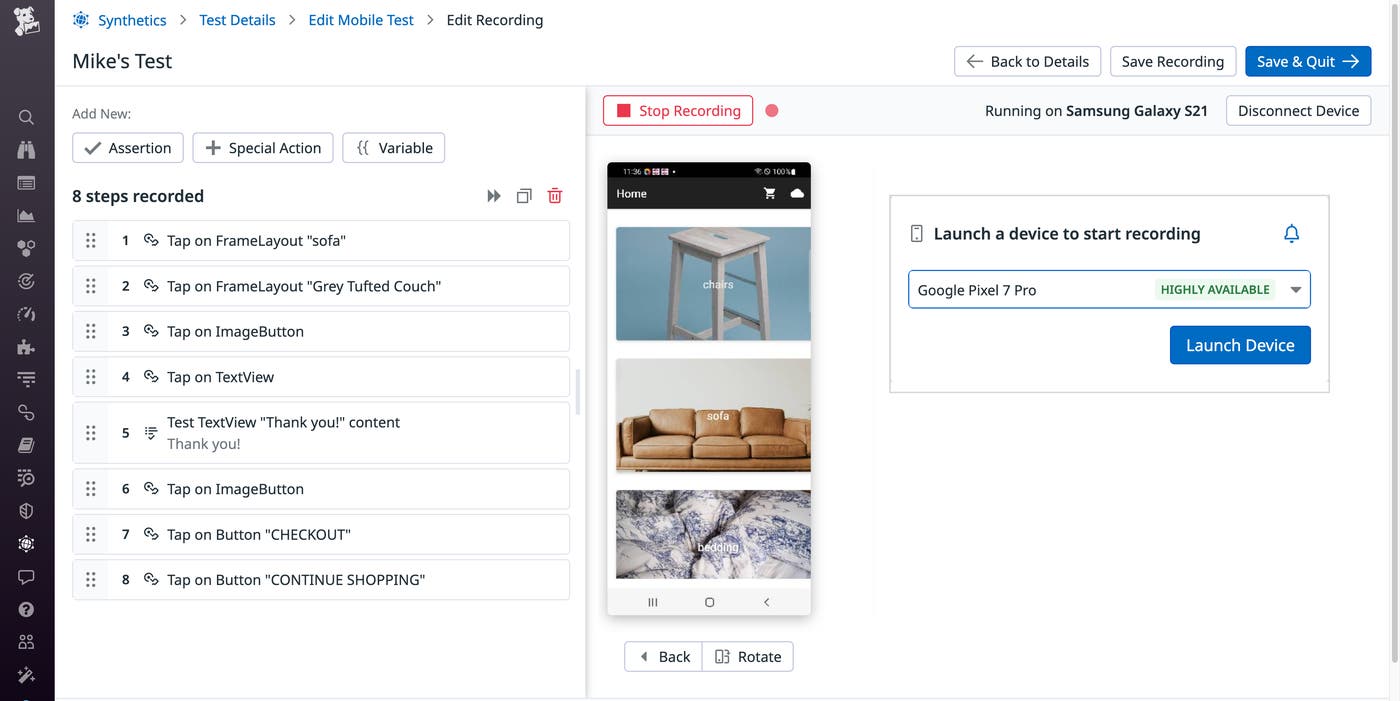
Effective mobile application testing requires teams to create tests that cover a range of different device types, operating system versions, and user interactions—including swipes, gestures, touches, and more—while also maintaining the infrastructure and device fleets necessary to run these tests. Datadog Mobile Application Testing delivers fast, no-code, and reliable mobile app testing on real devices in the cloud that lets any member of your team—whether they're technical or non-technical—create and maintain automated tests that seamlessly integrate into your CI/CD pipelines, so you can ship mobile apps with confidence and increase your release velocity.
With Datadog Mobile Application Testing, you can create and run end-to-end tests for your applications on both iOS and Android without writing code, by simply clicking and navigating through the most important flows in your app, just like your users do. Datadog runs these tests on real phones and tablets (as opposed to emulators) to provide a realistic, step-by-step representation of key application workflows, screenshots of each step, and detailed pass/fail results, so that your team can quickly visualize what went wrong and fix it. Additionally, these tests automatically adapt to minor changes in your app, simplifying the task of test maintenance as your app evolves. Learn more in our full blog post.
Understand and optimize your cloud resources and costs
Cloud Cost Recommendations
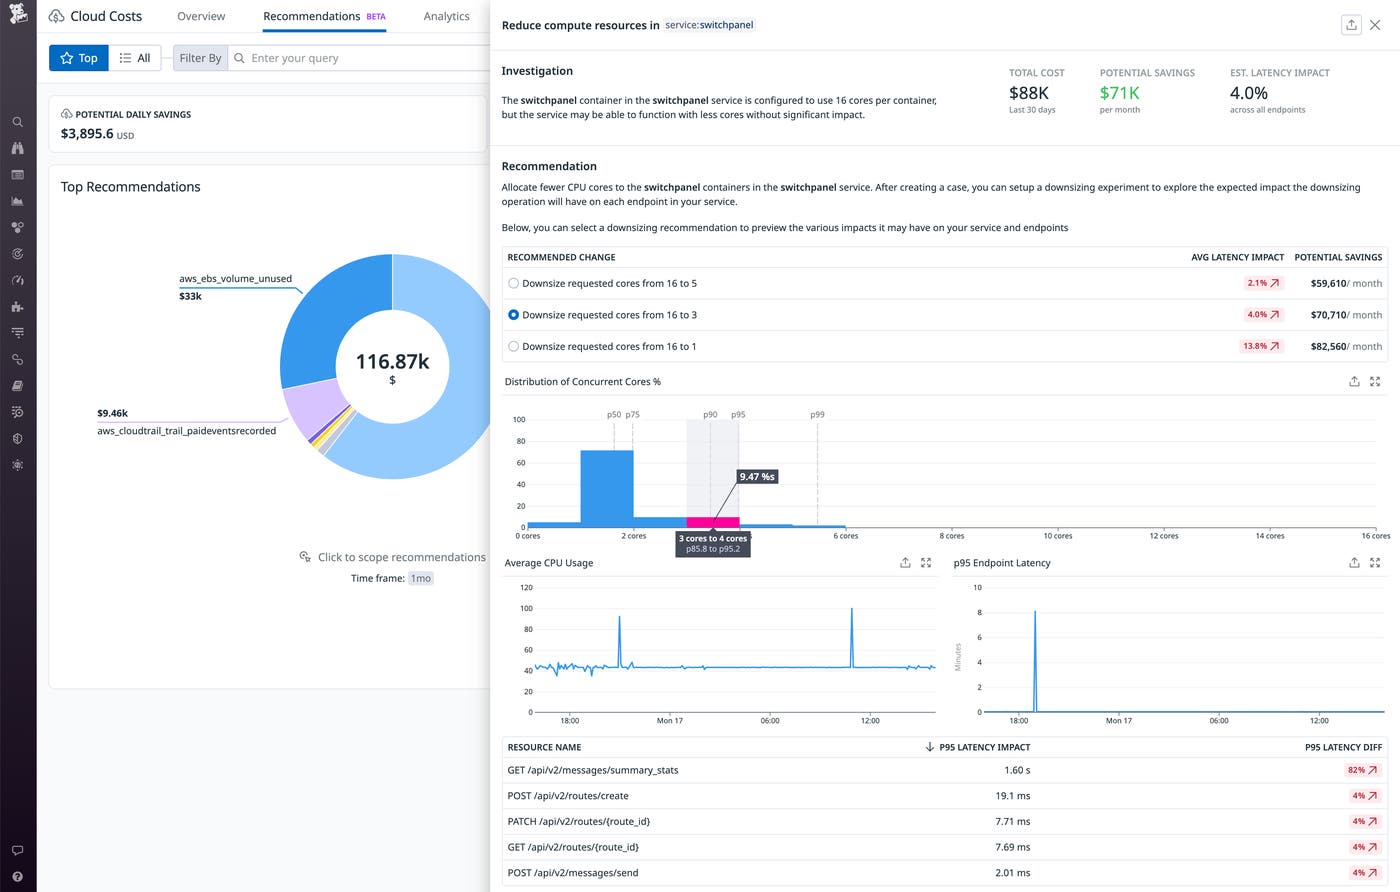
It's essential to keep your cloud costs in check, but it can be difficult to identify where you can safely optimize to avoid unnecessary costs and still provide the best user experience. We're thrilled to introduce Cloud Cost Recommendations, which remove the guesswork from cost optimization. Datadog analyzes your observability data to discover savings opportunities, such as containers that you can safely downsize to save money on compute resources. If you've enabled Continuous Profiler, you'll see how implementing downsizing recommendations will impact the latency on your services' endpoints. You'll also get recommendations on unused cloud resources that can be safely deleted—and you can even leverage Workflow Automation to continually and automatically delete unused resources. Cloud Cost Recommendations are available in Preview. For more information and to request access, go here.
Kubernetes Resource Utilization
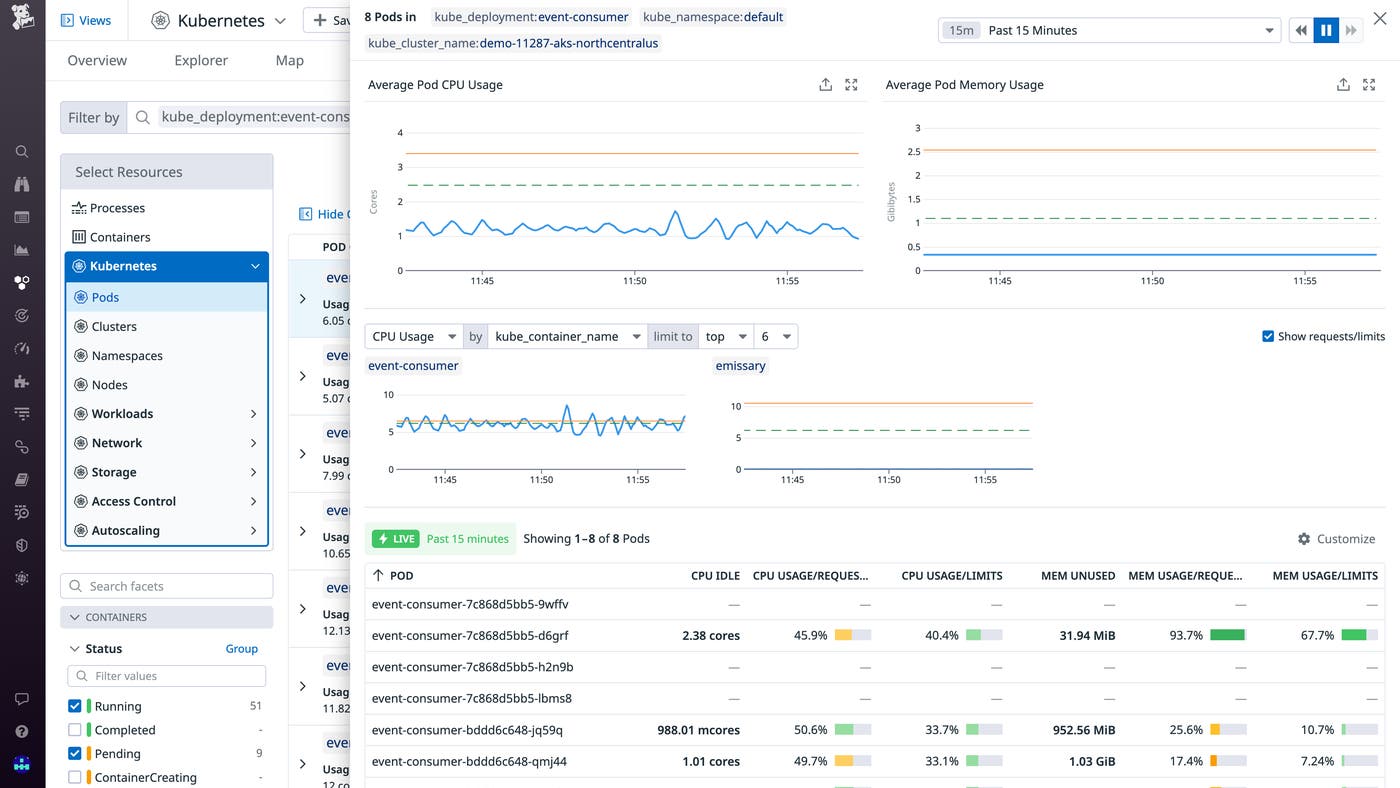
Cloud architects, application developers, and platform engineers increasingly need to ensure that they are using container infrastructure assets efficiently. The first step toward implementing smarter capacity allotment and planning is having real-time and historical insights into the resource usage of your Kubernetes objects. Datadog's new Kubernetes Resource Utilization view visualizes CPU and memory allocation and utilization across your clusters, pods, and containers so that you can easily identify workloads that are not using resources efficiently or that are poorly provisioned and adjust accordingly. By visualizing the performance of your containerized services alongside their resource utilization in a single pane of glass, you can better understand the actual footprint of your applications. This allows you to better configure your deployments with the right balance of cost, performance, and reliability. Kubernetes Resource Utilization is available now. For more information, please refer to the documentation.
Visualize container metrics from OpenTelemetry Collector
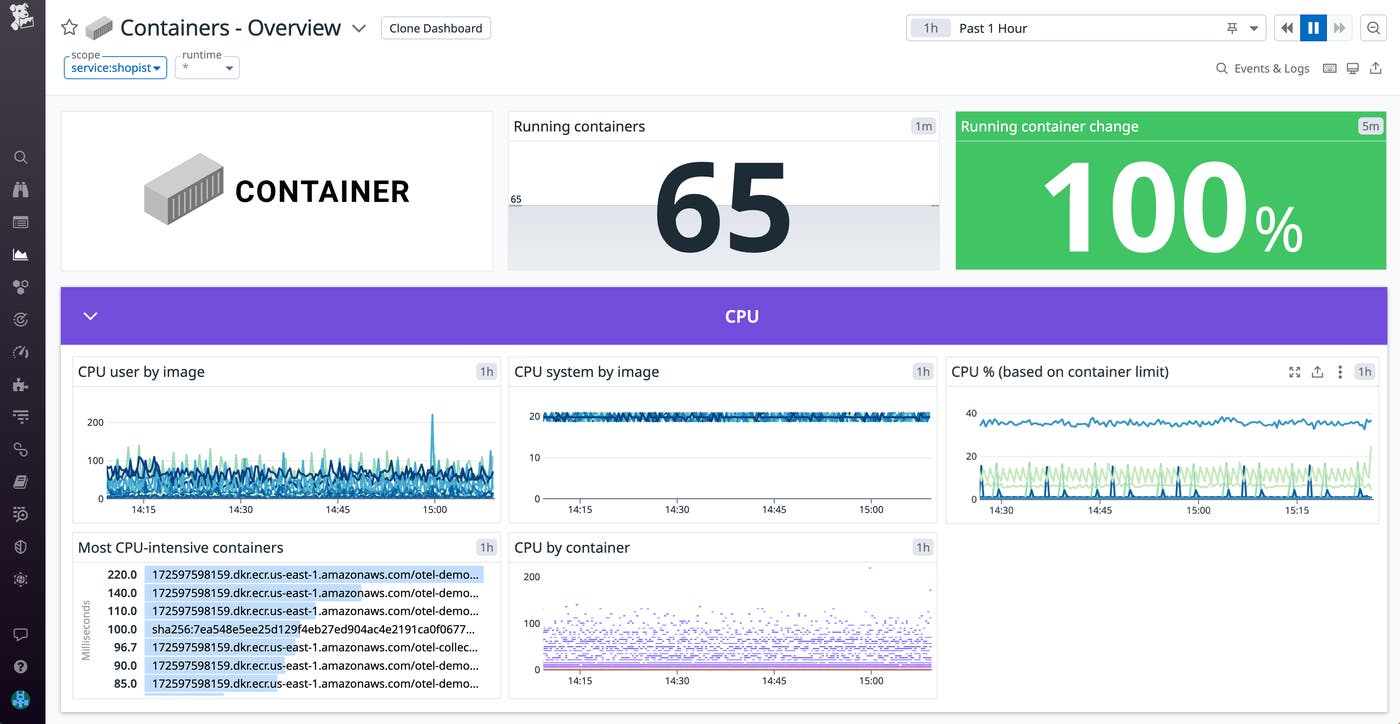
Datadog's Container Overview Dashboard provides key insights into the health of containerized environments. Now, it also provides out-of-the-box visibility into containers running OTel-instrumented applications. Customers that are collecting metrics using the OTel Collector and Datadog Exporter can use this dashboard to keep tabs on CPU, network, memory, and IO metrics from their containerized environment. Once you configure the OTel Collector, Datadog will automatically convert (or map) metrics and metadata from the OTLP data model to compatible telemetry schema. This enables you to use tags, such as container ID, service, and environment, to filter metrics when troubleshooting issues. For example, you can use the service tag to determine if a particular service has any CPU-intensive containers that are nearing their configured CPU limits, which can lead to throttling and performance degradation. If your environment relies on both the Datadog Agent and the OTel Collector, you can use the dashboard to monitor containers from both sources within a unified view.
We've been working closely with the open source community to introduce this feature along with enhanced support for OTel throughout the Datadog platform. Check out our documentation to begin visualizing telemetry from your OTel-instrumented applications.
Cloud Service Insights for CDNs
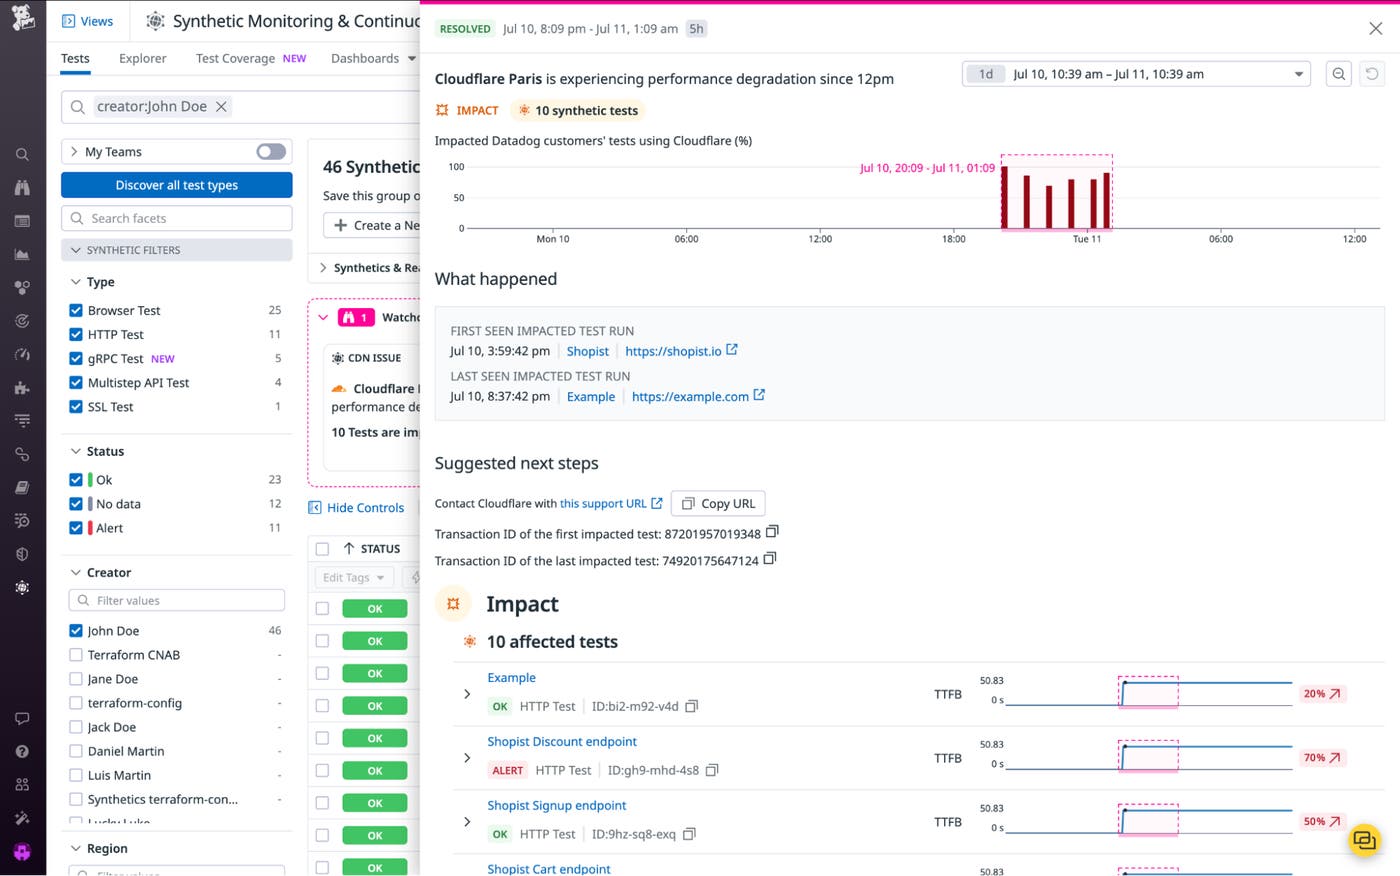
Modern applications rely on a variety of external and third-party dependencies and services. Having the ability to pinpoint whether application problems that affect your users are occurring in your own services or are due to issues with those dependencies is key for efficient troubleshooting. With Cloud Services Insights for CDNs, Datadog Synthetic Monitoring can now automatically detect and notify you of problems with the CDNs you rely on to deliver content. It will also summarize which of your Synthetic tests are likely affected by this issue so you can quickly see the scope of the impact. This makes it easy to quickly identify whether, for example, the root cause of increased latency for users in a specific region lies with an external service. Gaining this type of visibility into your cloud service dependencies enables you to confidently escalate issues with your providers and eliminate unnecessary troubleshooting cycles. Cloud Services Insights is currently available to all US1 customers of Synthetic Monitoring and will soon be generally available. To get started with Synthetic Monitoring, see our documentation.
Serverless
Serverless Monitoring for AWS Step Functions
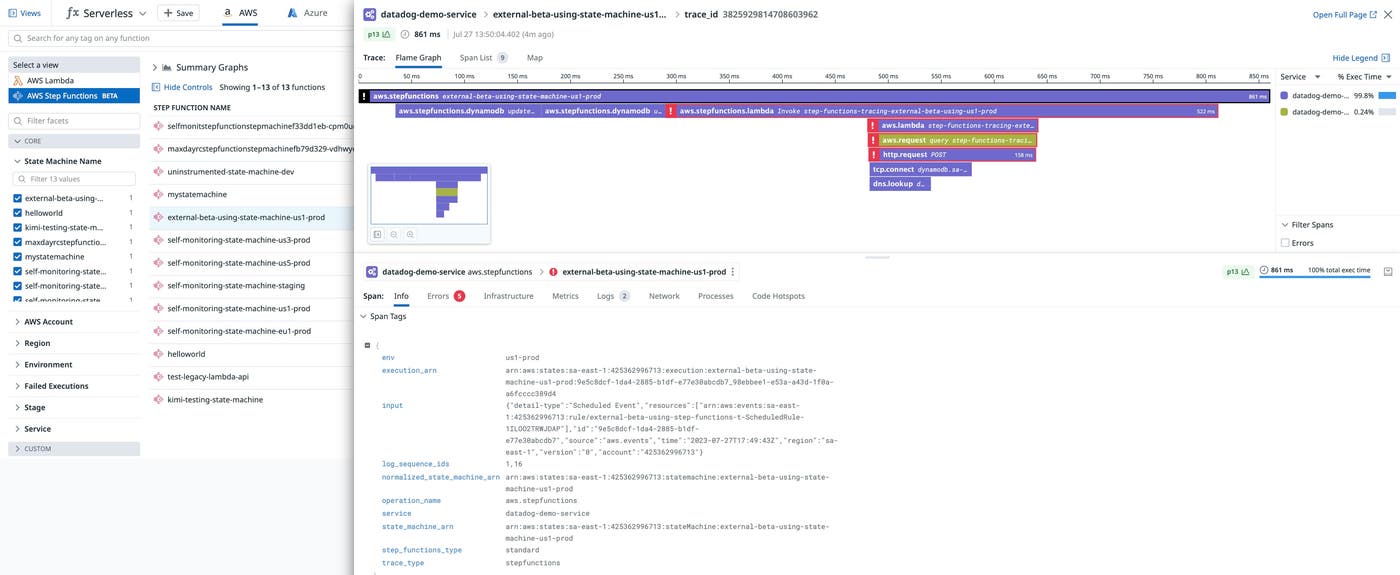
AWS Step Functions is a service that enables developers to create automated, multi-step workflows. With AWS Step Functions, you can build complex workflows that orchestrate Lambda function executions into larger serverless applications. Datadog already enables you to monitor your Step Functions' metrics and get deep visibility into their associated Lambda functions with the existing integration. And now, we've released native support for Step Functions monitoring. You can view metrics, logs, and traces in the Serverless view to understand the performance of state machine functions as they execute across your workflows. Traces can help you ensure that your Step Functions workflows remain performant by enabling you to quickly spot Lambda cold starts, long-running steps, and execution errors that need troubleshooting. Check out our blog to learn more.
Azure serverless monitoring
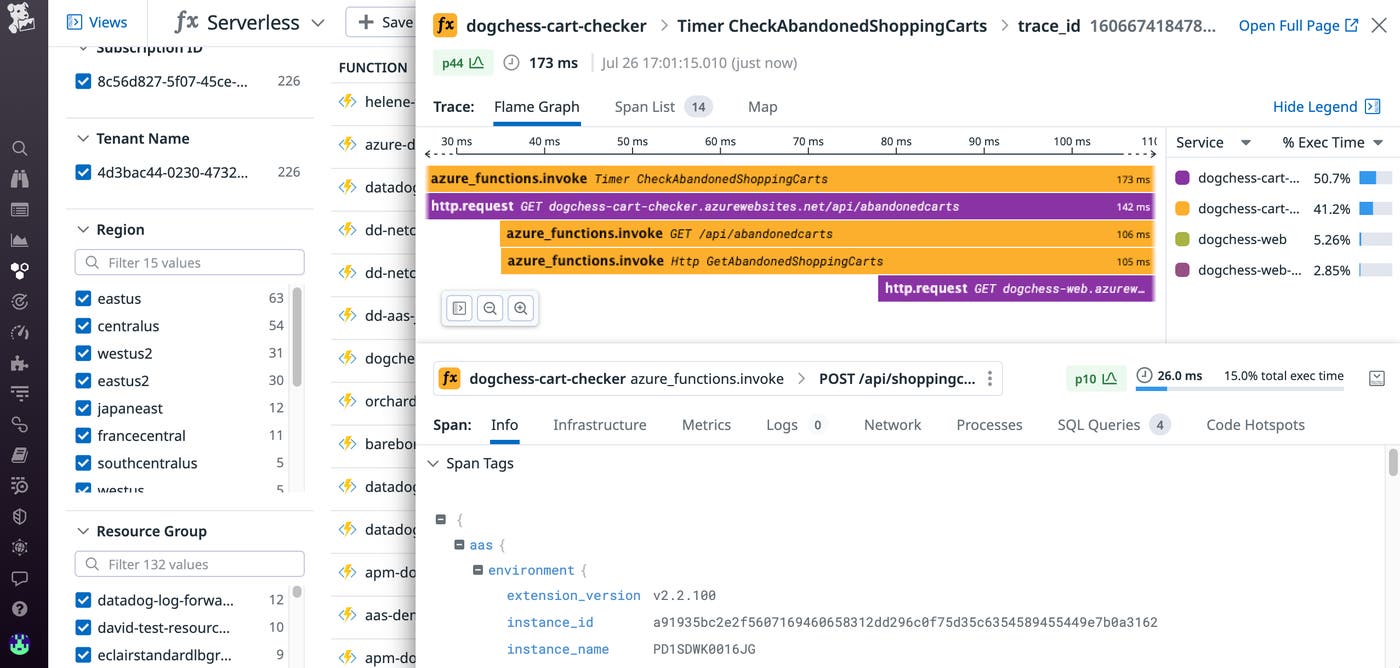
Datadog now provides deep visibility into Azure Container Apps, a fully managed serverless platform for deploying containerized applications. We also now enable you to monitor Azure Functions running on a Consumption plan, Microsoft's fully serverless hosting option. This means that you can use our Serverless view to gain visibility into your dynamic workloads and quickly spot cold starts, bottlenecks, and other performance problems.
Support for Azure Container Apps is now generally available. To start collecting and visualizing traces, custom metrics, and logs directly from your Azure Container Apps, see our documentation. Support for tracing Consumption plan—hosted Azure Functions is now in Preview; to request access, fill out this form.
Google Cloud serverless monitoring
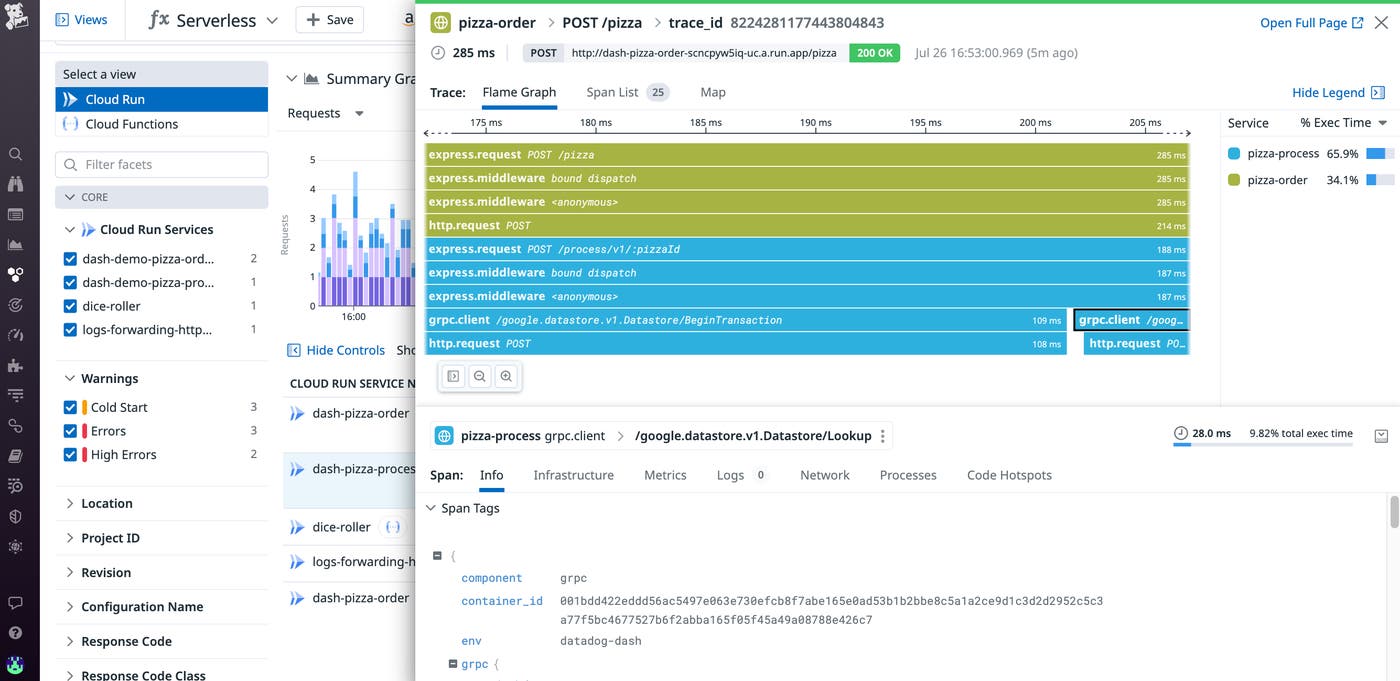
Google Cloud Functions is a serverless compute solution that enables you to run single, event-driven functions that handle specific tasks such as payment processing and user authentication. Google Cloud Run is another popular service that offers a fully managed platform for deploying fully containerized applications in serverless environments. If your business-critical applications run on these services, getting deep visibility into their health and performance is necessary for the success of your organization. We are pleased to announce that the Datadog now collects traces, custom metrics, and logs directly from your Cloud Run services, and enables you to get unified insights into this telemetry in the Serverless view. To learn more, check out our documentation.
The Serverless view now also includes support for visualizing end-to-end traces from Cloud Functions in Preview. This means that in addition to the Cloud Functions metrics and logs you may already be monitoring, you can view function executions as they propagate across your infrastructure, so you can quickly spot and remediate cold starts, execution errors, and other performance issues. To sign up for the Preview, fill out this form.
Network monitoring
Jumpstart network investigations with an updated story-centric UX for Cloud Network Monitoring (CNM)
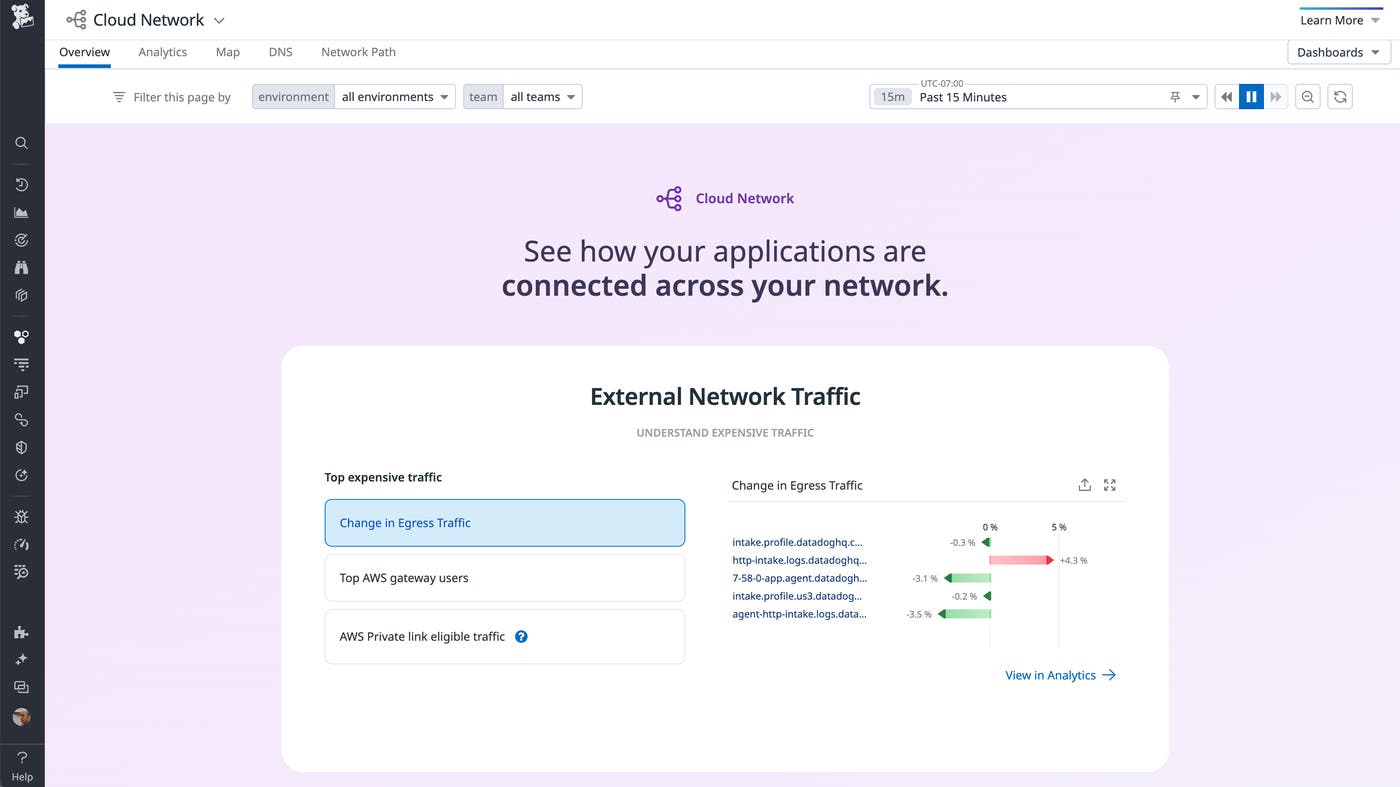
When an organization scales, its network inevitably begins to generate massive amounts of traffic from its expanding array of hosts, VPCs, containers, regions, and zones. This volume of data can be very difficult to monitor, especially for anyone new to networking observability who may be unsure about where to begin an investigation in the event a networking issue occurs.
To overcome this challenge and help developers jumpstart network investigations with ease, we have released a story-centric UX for the CNM Overview page. This new UX automatically surfaces key network data and organizes it into distinct sections to assist you in specific problem-solving use cases, such as identifying top traffic costs or understanding service dependencies.
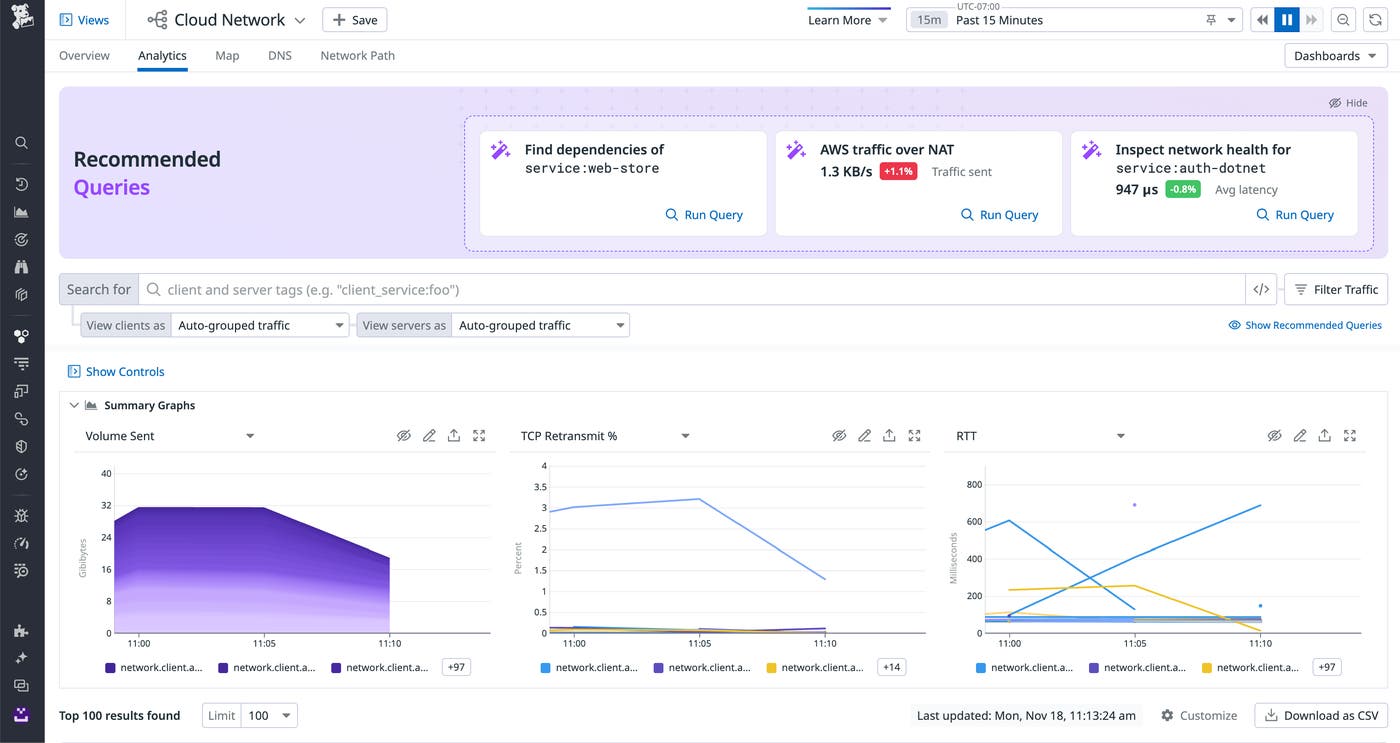
We have also updated the UX of the CNM Analytics and DNS pages to include recommended queries. These queries help guide investigations by quickly surfacing critical information about your network, such as the volume of DNS timeouts and TCP retransmits occurring within it. To learn more about how our updated UX helps network investigations, check out our blog.
NetFlow Monitoring
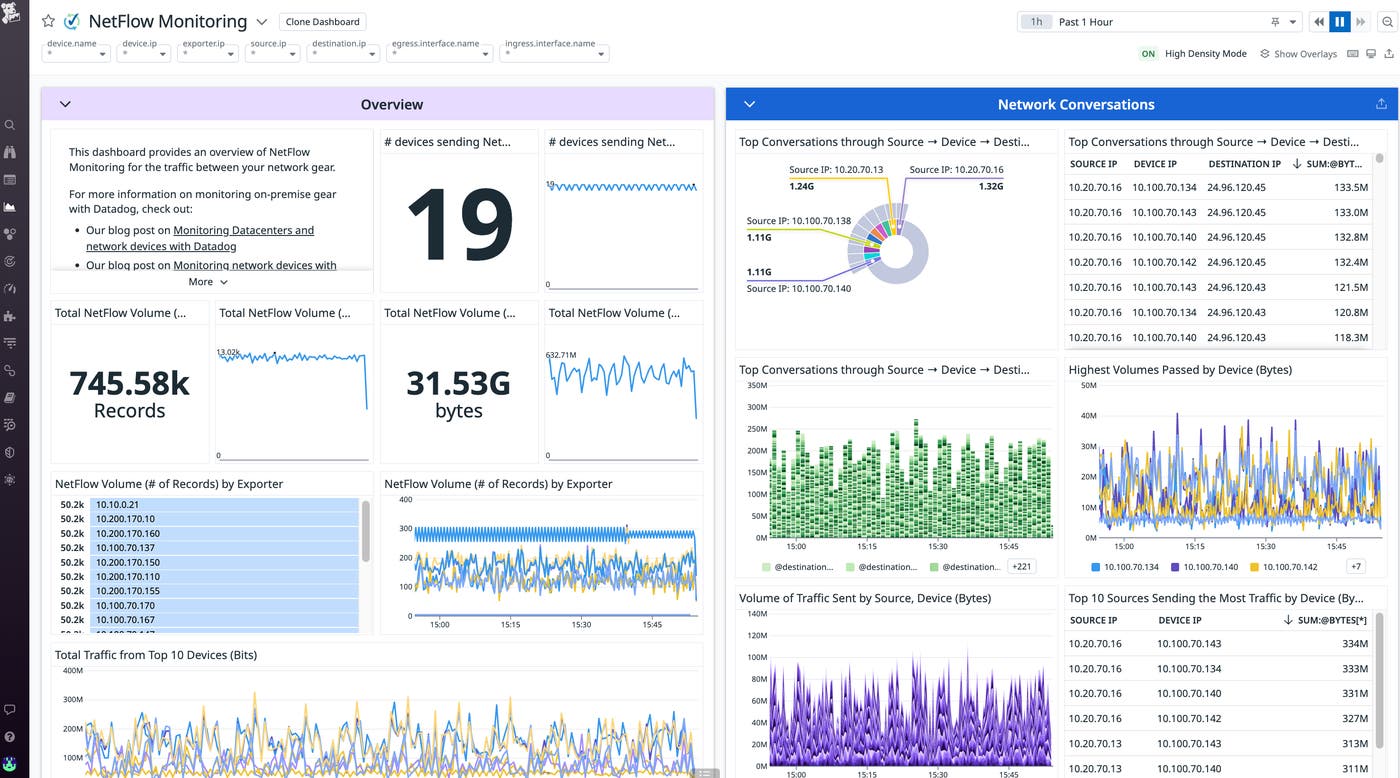
Network administrators rely on NetFlow data to understand how traffic flows across their network devices. With NetFlow Monitoring, you can now identify the top contributors to your network traffic (i.e., top talkers and top listeners) to understand which services are using the available bandwidth and causing network slowdowns. Our out-of-the-box dashboard visualizes your devices' NetFlow data—and other NetFlow variants such as IPFIX, sFlow, and JFlow—so that you can investigate traffic flows alongside SNMP metrics, Traps, and Syslogs all on a single, unified platform. NetFlow Monitoring is now generally available and simple to enable with the Datadog Agent. For more details, check out our blog and see our documentation.
Network Topology Map for port-to-port device connectivity
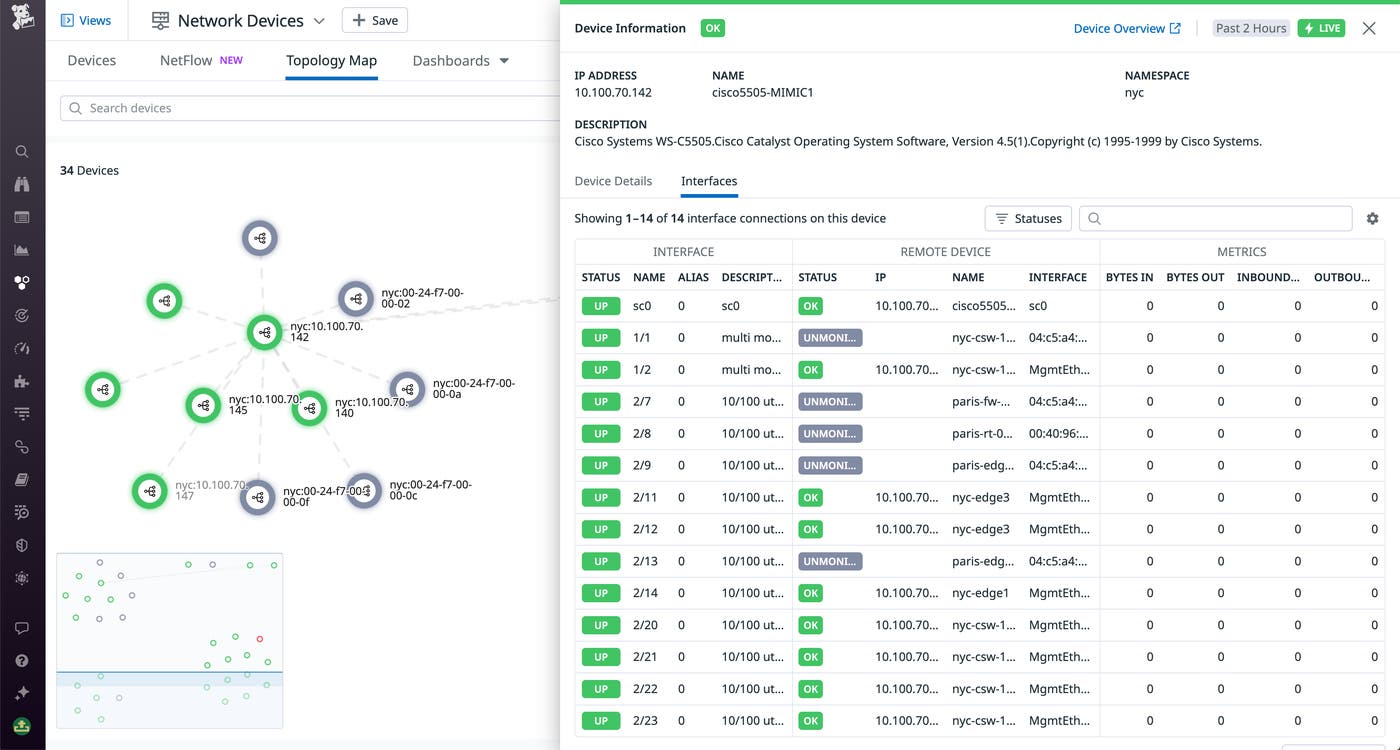
When a network engineer is alerted of high latency, it is often difficult to find the best starting point for troubleshooting. With potentially thousands of devices comprising a modern enterprise network, engineers must understand their complex interconnections in order to trace the sources and consequences of poor network performance. Datadog Network Device Monitoring (NDM) now offers a Network Topology Map that provides a detailed bird's-eye view of your network devices and their relationships.
Rather than stepping across each device one-by-one or relying on institutional knowledge to understand the network environment, you can use the map to inspect any device, view all of its interface connections, and quickly spot which of its dependencies are experiencing errors. Click on any device to open its side panel, where you can view key performance metrics, details about all the interfaces the device is connected to, and more. It is easy to pivot from there to the main NDM page for further context about the device, or to NetFlow Monitoring for more information about the device's network traffic. The NDM Network Topology Map is now available. For more information about Datadog Network Device Monitoring, see our documentation.
Database monitoring
Database Monitoring Oracle Support
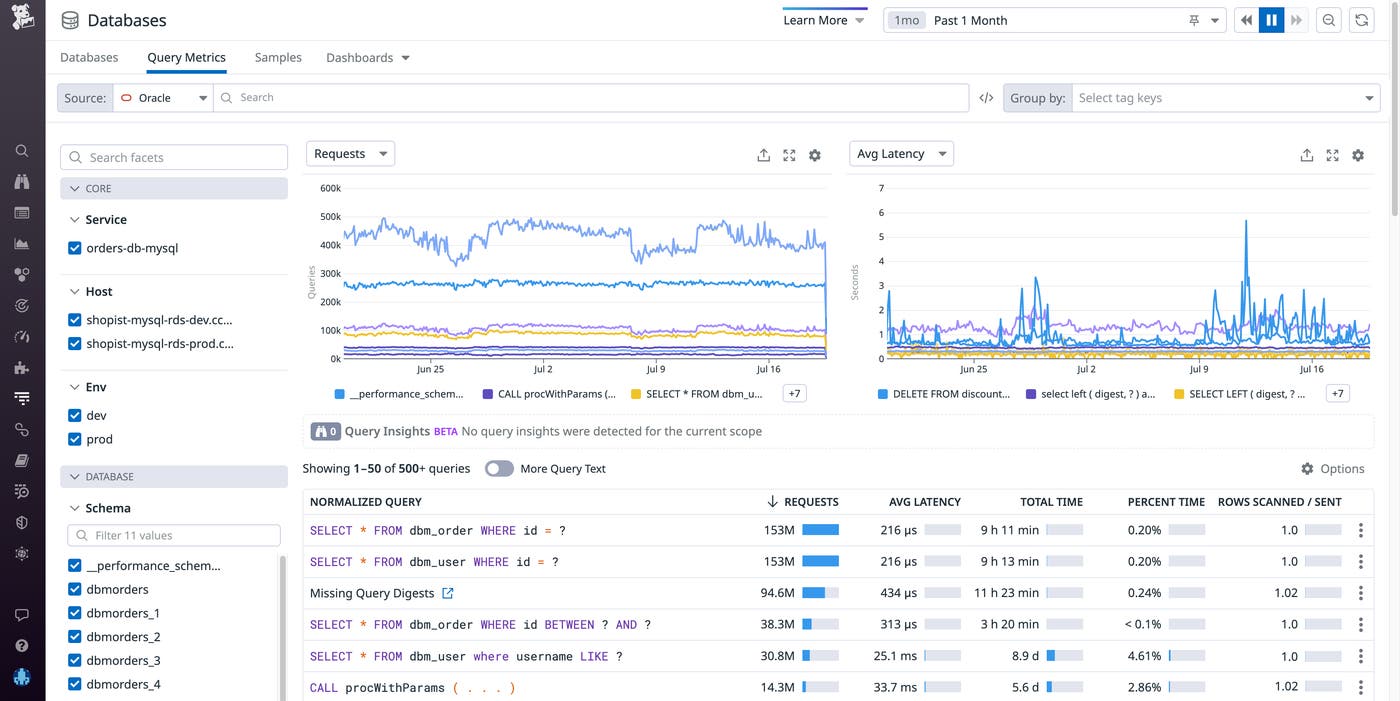
Datadog Database Monitoring (DBM), which provides host-level and query performance metrics for Postgres, MySQL, and SQL Server, is now available for Oracle. The databases view shows you vital health metrics at the host-level, such as throughput and latency. For each host, we capture active connections—the queries that are running on your host—both historically and in near-real time, helping you understand the load that your databases experience and which queries contribute the most to that load. At the query-level, DBM provides visibility into query metrics, samples, and explain plans. These explain plans—the steps the database engine takes to execute a query—can help you see which steps of an expensive query might benefit from optimization. In addition, DBM for Oracle comes with an out-of-the-box dashboard, which provides an overview of host health metrics, like CPU utilization, memory usage, and IO. To get started gaining deeper visibility into your Oracle databases, set up DBM for Oracle on your hosts today. If you have any questions, reach out to your CSM.
Database Monitoring Watchdog Insights
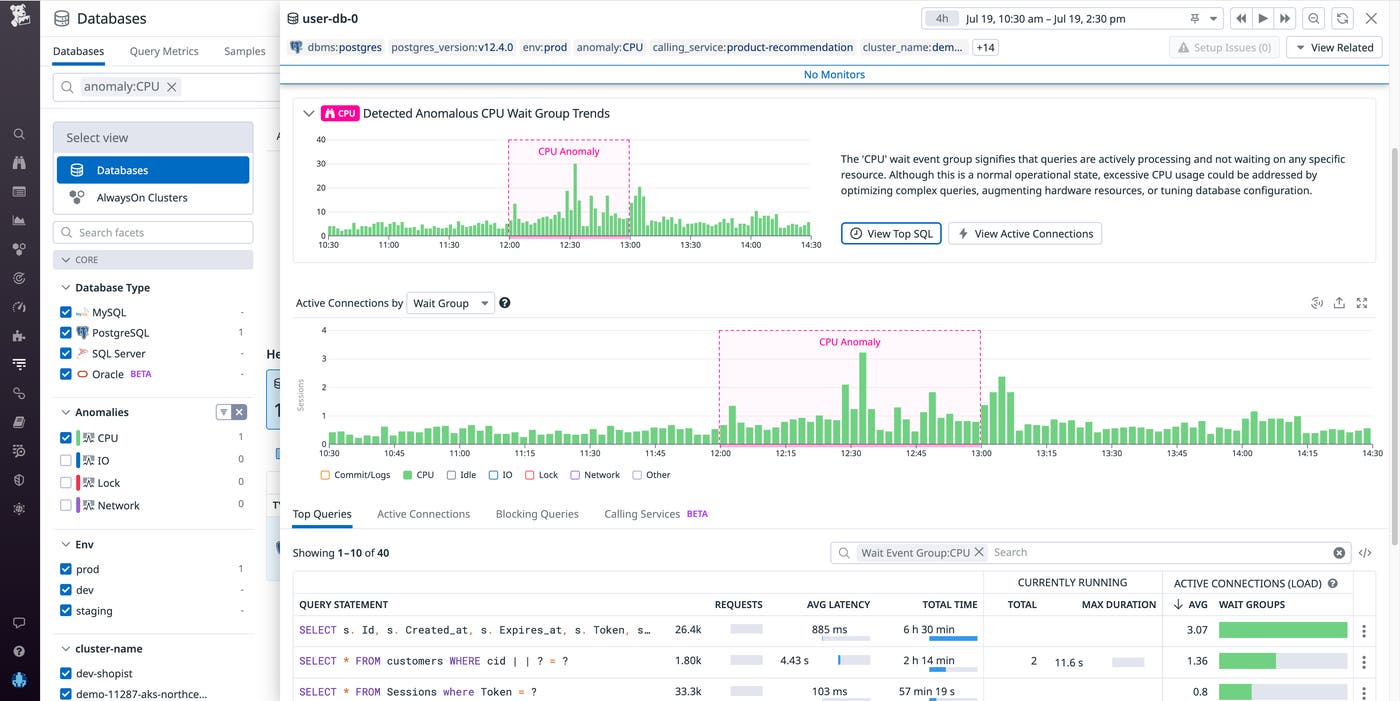
Datadog Database Monitoring (DBM) offers deep visibility into the health and performance of your database hosts and queries. As your environment scales, you may need help identifying where to look first to understand what's going on across your systems and troubleshoot database issues. That's why we're proud to announce Watchdog for DBM—which uses Anomaly Detection to provide insights around interesting patterns in host activity and queries—is now available. Watchdog for DBM scans your hosts and provides health summaries at the top of the databases page.
Health summaries highlight atypical trends in your hosts, organized by wait groups to indicate what queries are waiting on to be able to execute, such as CPU, IO, Lock, or Network. When you click on a wait group, the UI will filter down the list to show you which hosts are experiencing this anomalous activity. From there, you can click on a host to view a breakout panel (as in the screenshot below) containing additional performance metrics, metadata, and a blurb telling you what has been detected. You can also filter the top queries and active connections to see what was running at the time that this anomaly was detected. And at the query-level, Watchdog points out long-running queries, as well as those that are blocking other queries from running. Get started with DBM today and take advantage of Watchdog's insights into the health of your database performance.
Automatically correlate database query metrics and request traces
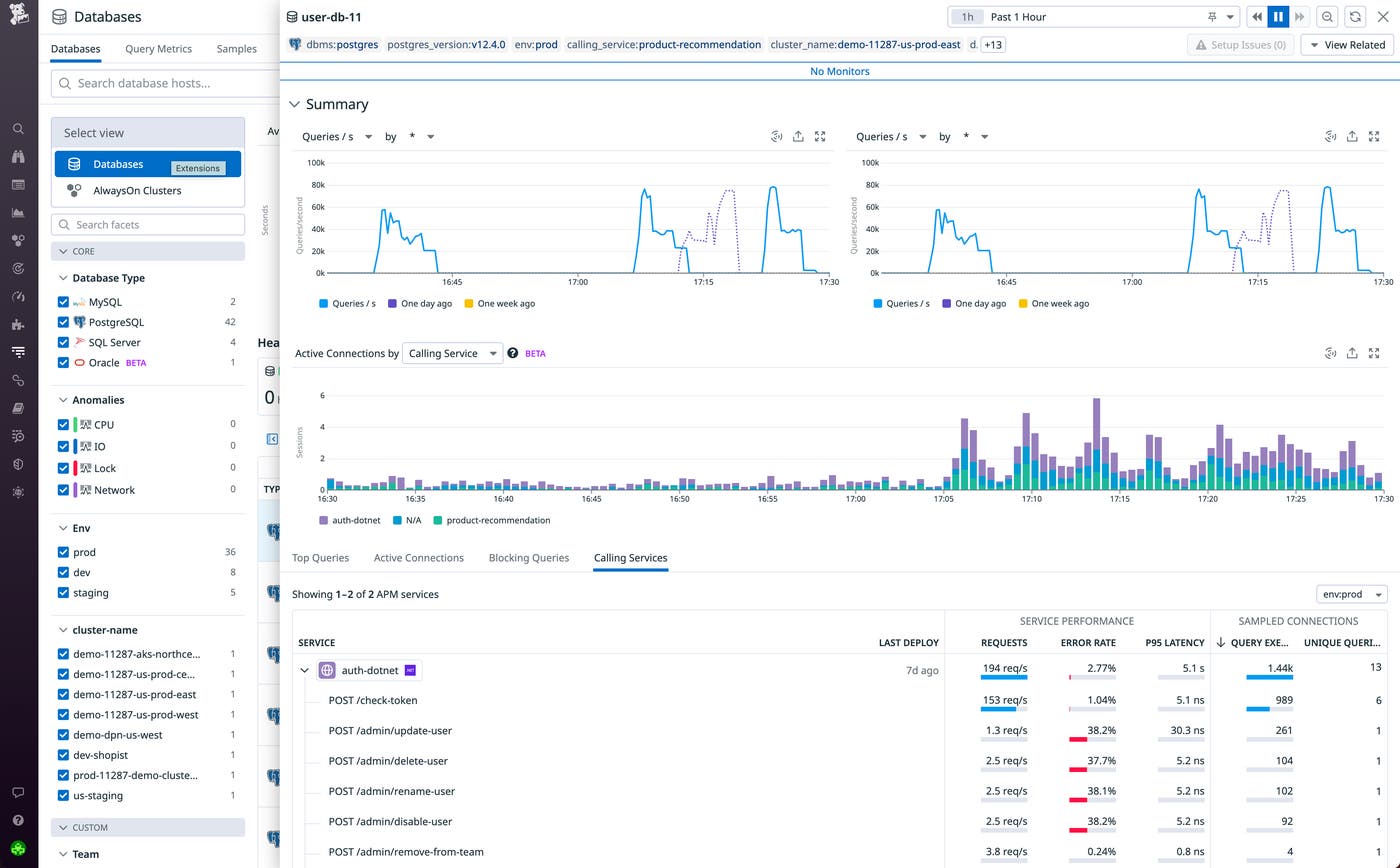
Database-level problems can have an outsize effect on application performance. Datadog Database Monitoring (DBM) provides comprehensive insights into your database queries, wait events, explain plans, and more so you can identify issues and areas for optimization. But understanding exactly which services are actually running these queries and so are affected by poor database performance is vital for quick troubleshooting.
We're excited to announce that you can now seamlessly pivot from Datadog APM's service and trace views directly to relevant database metrics and back with DBM's integration with APM. This enriches your database troubleshooting by surfacing the relevant APM traces and calling services, enabling you to understand how upstream application dependencies relate to your database. For example, starting in APM, you can identify problematic query patterns in Error Tracking and investigate the trace to identify slow-performing queries, isolating the database hosts that are blocked. By connecting DBM and APM telemetry, you can solve database issues faster as important application context is never lost. See our blog post for more information, and learn how to get started today in our documentation.
Alert on Database Monitoring query samples and explain plans
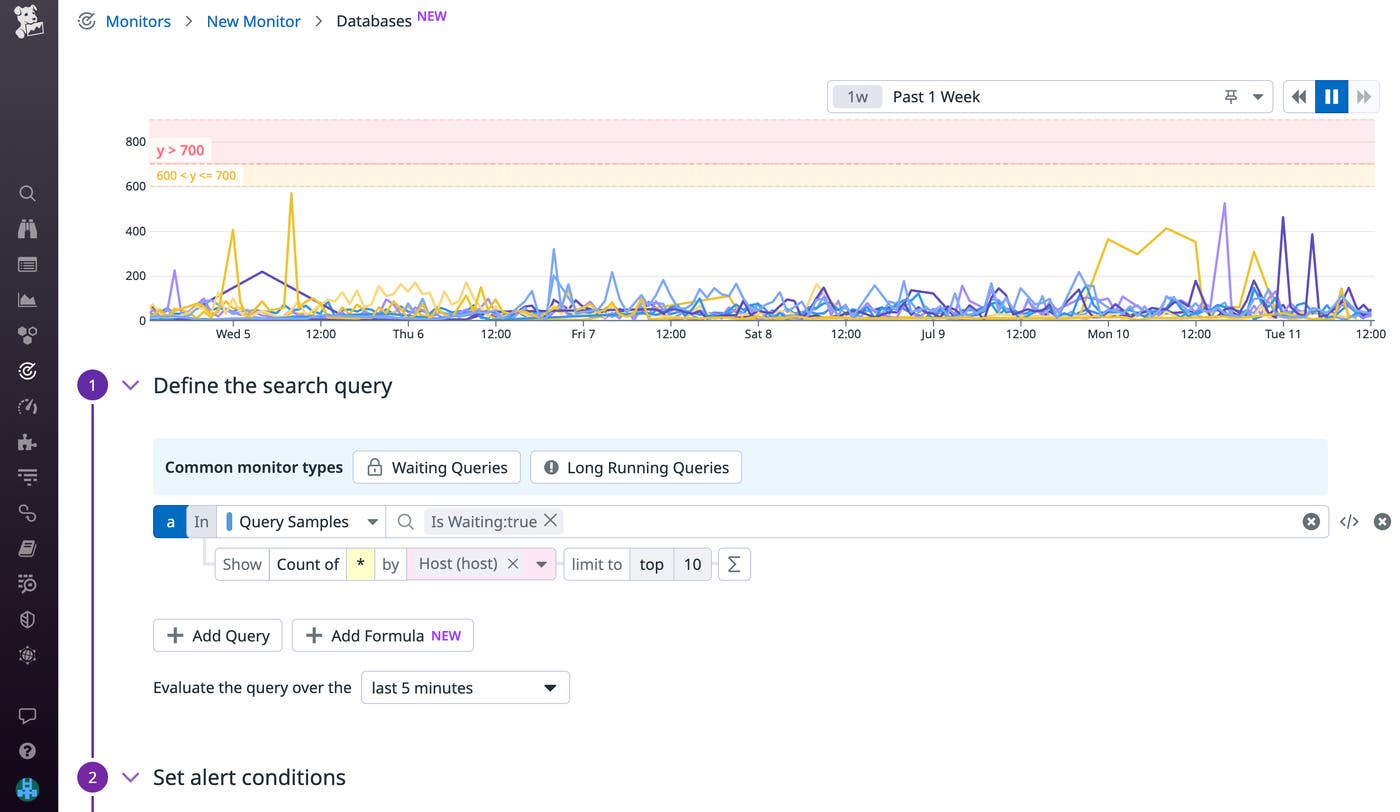
Datadog Database Monitoring (DBM) enables you to get deep visibility into all of your databases and troubleshoot issues by analyzing query performance metrics, explain plans, and host-level metrics. We're pleased to announce that you can now configure DBM monitors to alert on query samples and explain plans. Datadog provides out-of-the-box monitors for waiting queries (shown below) and long-running queries, so you can identify and quickly respond to lock contention and other performance issues. You can also use DBM to identify your most frequently executed queries and configure monitors to track their cost over time. For example, you can set up a monitor to notify you if a query's explain plan doubles in cost, so you can investigate and adjust your query to maximize cost efficiency. Get started by enabling our out-of-the-box DBM monitors, or learn more about configuring DBM monitors in our documentation.
