Jordan Obey

Prashant Jain

Lutao Xie
OpenTelemetry is an open source, vendor-neutral observability framework that provides tools, APIs, and SDKs to collect and standardize telemetry data from cloud-native applications and services. One of OpenTelemetry’s key components is the OpenTelemetry Collector, which receives and processes data before using exporters to route it to the destinations of your choice. Exporters enable you to leverage any number of observability backends without configuring and installing multiple agents, which reduces overhead and helps you avoid vendor lock-in.
As a part of Datadog’s continued commitment to open observability standards and the OpenTelemetry project, we’re pleased to announce the general availability of the OpenTelemetry Collector Datadog Exporter for metrics and traces. The Datadog Exporter expands your observability options by enabling you to send OpenTelemetry data directly to Datadog, in addition to any other third-party observability tools you may be using.
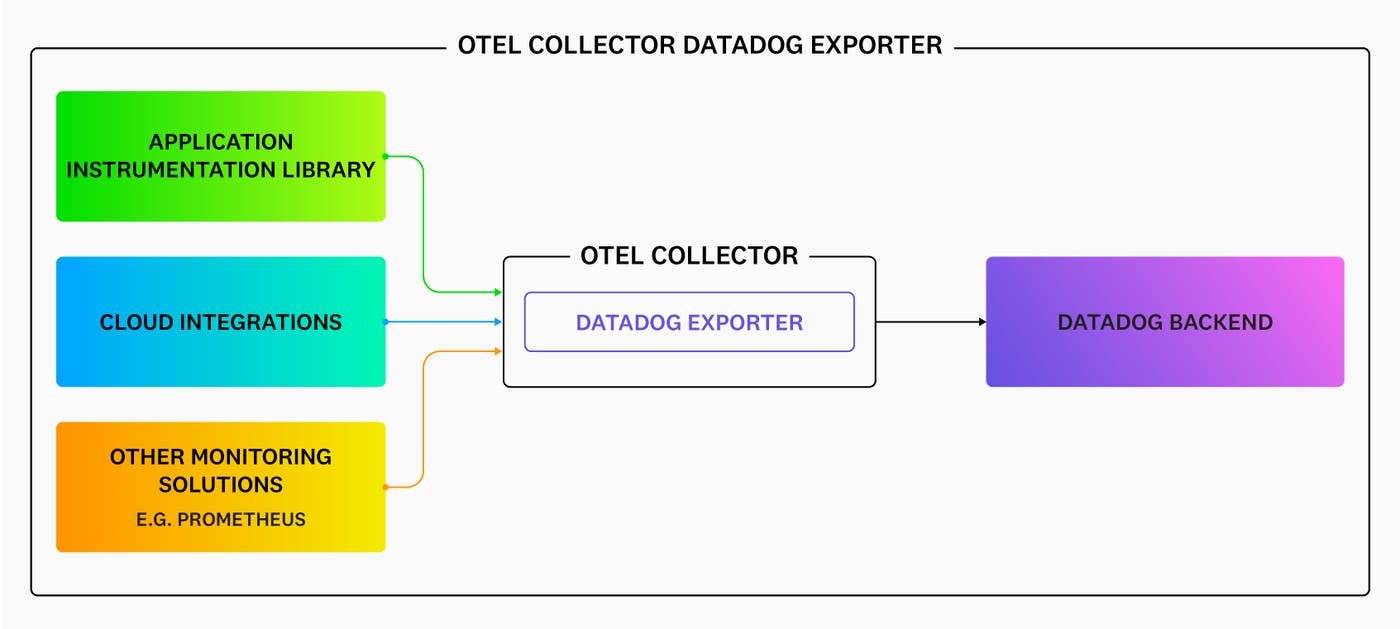
In this post, we’ll look at how the Datadog Exporter can be easily installed by adding just a few lines to your config file. Then, we’ll explore how the exporter sends infrastructure metrics and traces from your applications to Datadog for visualization and analysis.
Send telemetry from the OpenTelemetry Collector directly to Datadog
The Datadog Exporter is a reliable, fast, and hassle-free method of sending OpenTelemetry data to Datadog. You can use the Datadog Exporter alongside any other exporters, observability solutions, and open source tools you’re already accustomed to using, giving you flexibility over what data to collect, how to format it, and where it should be routed.
If you already use the OpenTelemetry Collector to collect observability data, you can send metrics and traces to Datadog by adding datadog and your Datadog API key to the exporters section of your OpenTelemetry Collector configuration file.
exporters: datadog: api: key: "<API key>"You can then enable the exporter by pointing to it in your configuration file’s service section, which we’ll discuss next.
Collect metrics from OpenTelemetry to monitor your infrastructure
Once you’ve configured the Datadog Exporter, you can use it by adding it to a pipeline under the service section of your OpenTelemetry Collector configuration file. The service section specifies which components of the OpenTelemetry Collector to enable, and pipelines define which types of data to collect and where that data should be sent. You will also need to configure one or more receivers, which are used for data collection. For example, you can collect infrastructure metrics from OpenTelemetry with the Datadog Exporter by listing hostmetrics as a receiver and including a pipeline that lists metrics as the data type and datadog/api as the exporter.
receivers: hostmetrics:
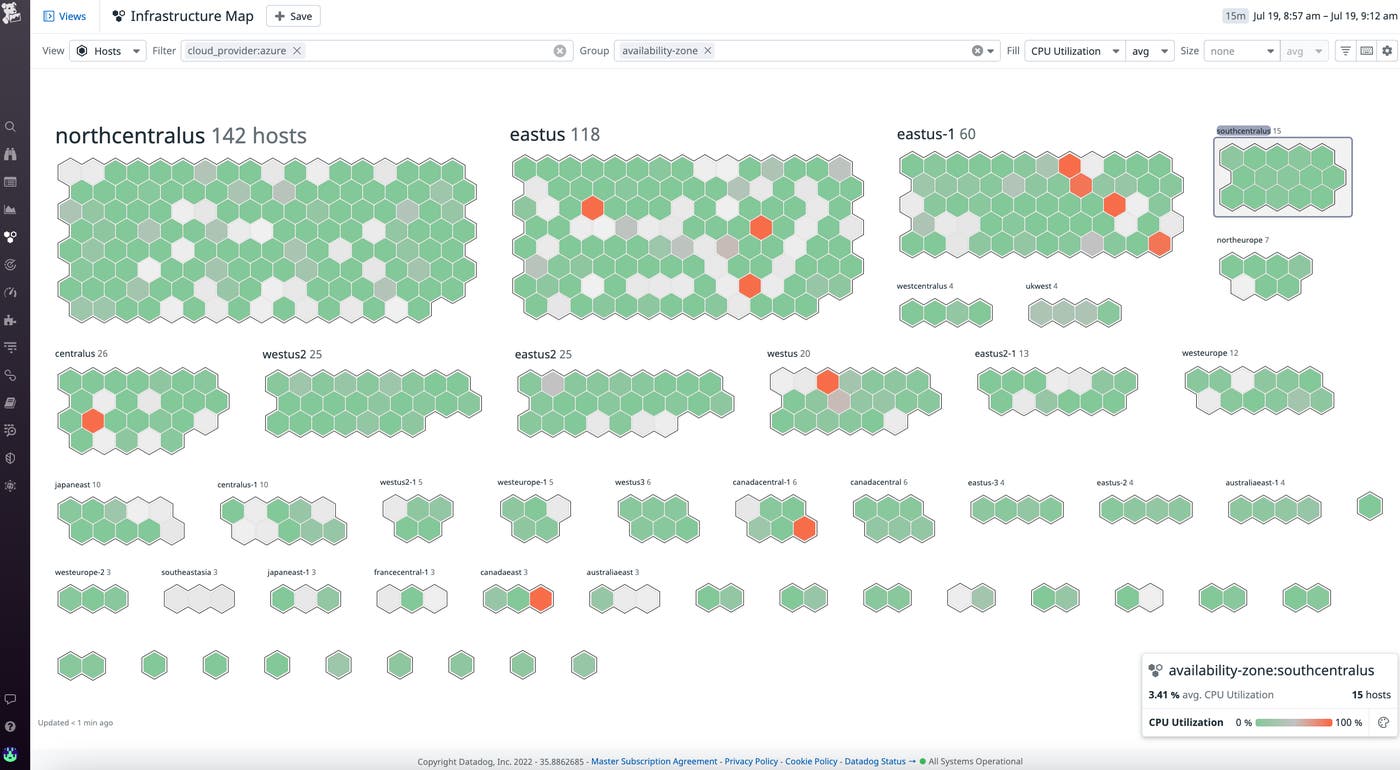
service: pipelines: metrics: … exporters: [datadog/api]Once the Datadog Exporter is configured and you’ve restarted the OpenTelemetry Collector, metrics will be translated from the OpenTelemetry Protocol (OTLP) format and sent to Datadog. You can then visualize these metrics using Datadog’s suite of infrastructure monitoring features, which includes customizable dashboards, host maps, infrastructure lists, and many more. Any metrics sent from the exporter will be stored for up to 15 months so that you can audit historical data and identify trends over time.
Collect OpenTelemetry trace data with Datadog APM
Just as you can enable metric collection with a few additional lines of code, you can also enable trace collection by including a traces pipeline in your OpenTelemetry Collector configuration file.
service: pipelines: metrics: … exporters: [datadog/api] traces: … exporters: [datadog/api]Once you start collecting trace data from the OpenTelemetry Collector, you’ll be able to use Datadog APM and distributed tracing to gain critical insight into your application’s performance. With the Trace Explorer, you can view all incoming traces, as well as latency percentiles and request and error counts. You can then dive into a specific trace in order to see its associated spans on a flame graph, which allows you to identify the exact requests that generated errors or unexpected latency. If you spot an issue, you can investigate further by pivoting seamlessly to relevant metrics and logs that provide crucial context for troubleshooting.
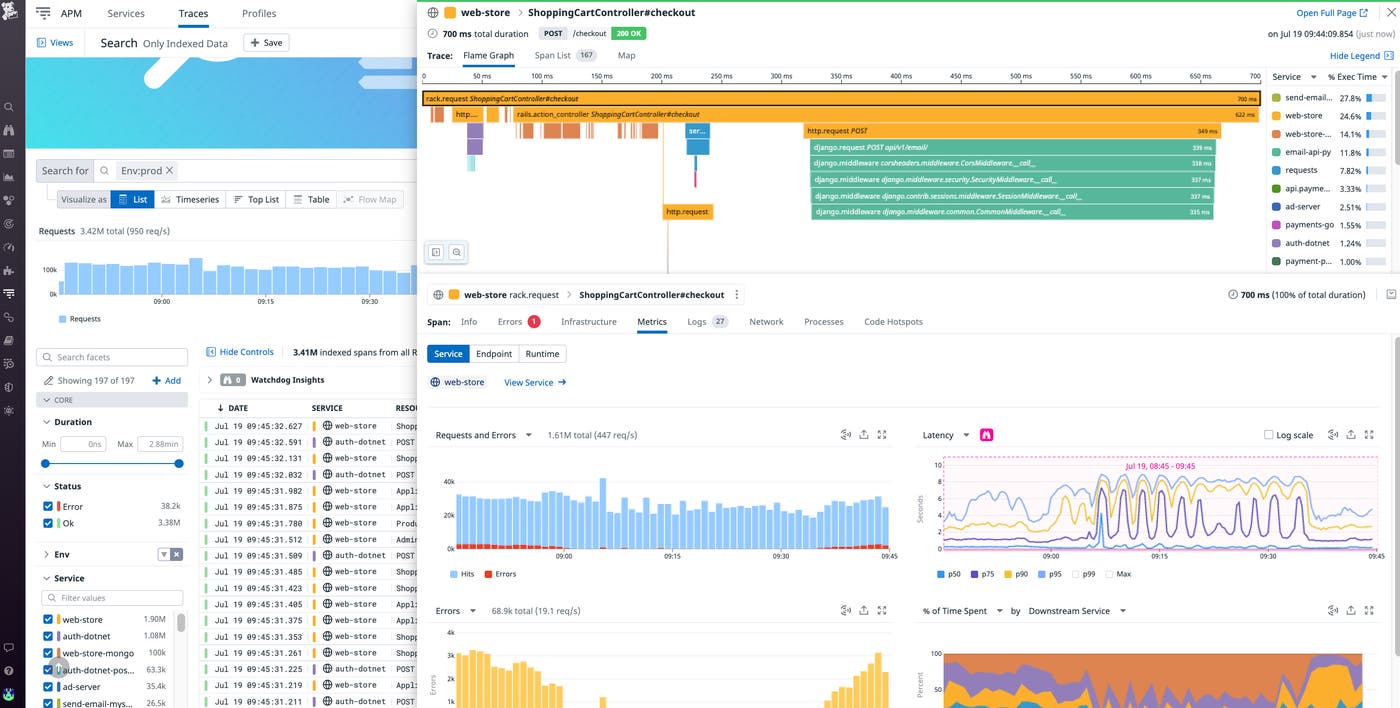
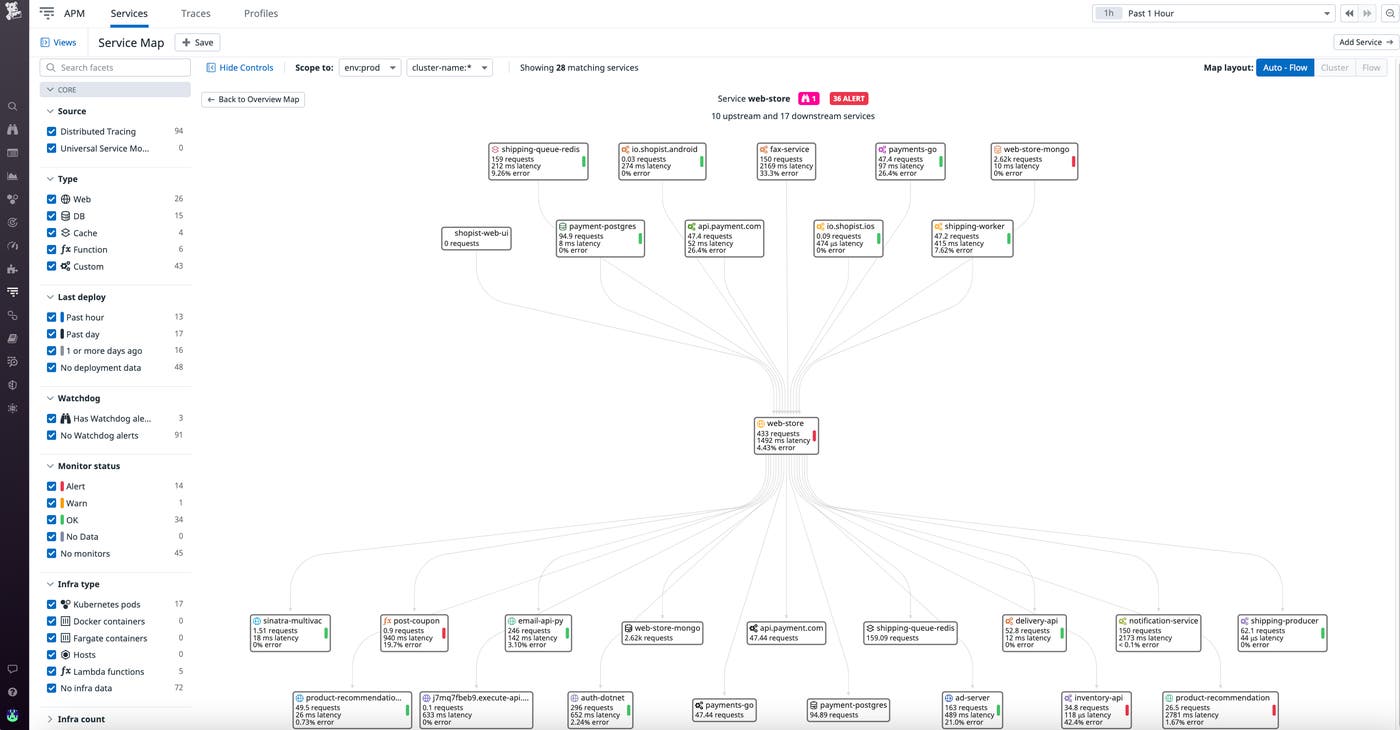
You can also understand how data traverses your architecture with the Request Flow Map and Service Map to visualize the dependencies between each component of your application. These maps are particularly useful for identifying upstream errors that might be impacting other services.
Expand your observability options today
Datadog is committed to helping you ensure the health, performance, and security of your environment, no matter what other technologies and tools are part of your stack. If you already use OpenTelemetry to collect observability data, the OpenTelemetry Collector Datadog Exporter will enable you to further expand your observability capabilities with our suite of visualization and analytics features.
Check out our documentation to learn more about collecting OpenTelemetry metrics and traces with our exporter. In addition to metrics and traces, the Datadog Exporter now enables you to send logs from OpenTelemetry to Datadog for monitoring and analysis. If you’re not already a Datadog customer, sign up for a 14-day free trial.


