


Platform advantage
Unify technology, process, and people
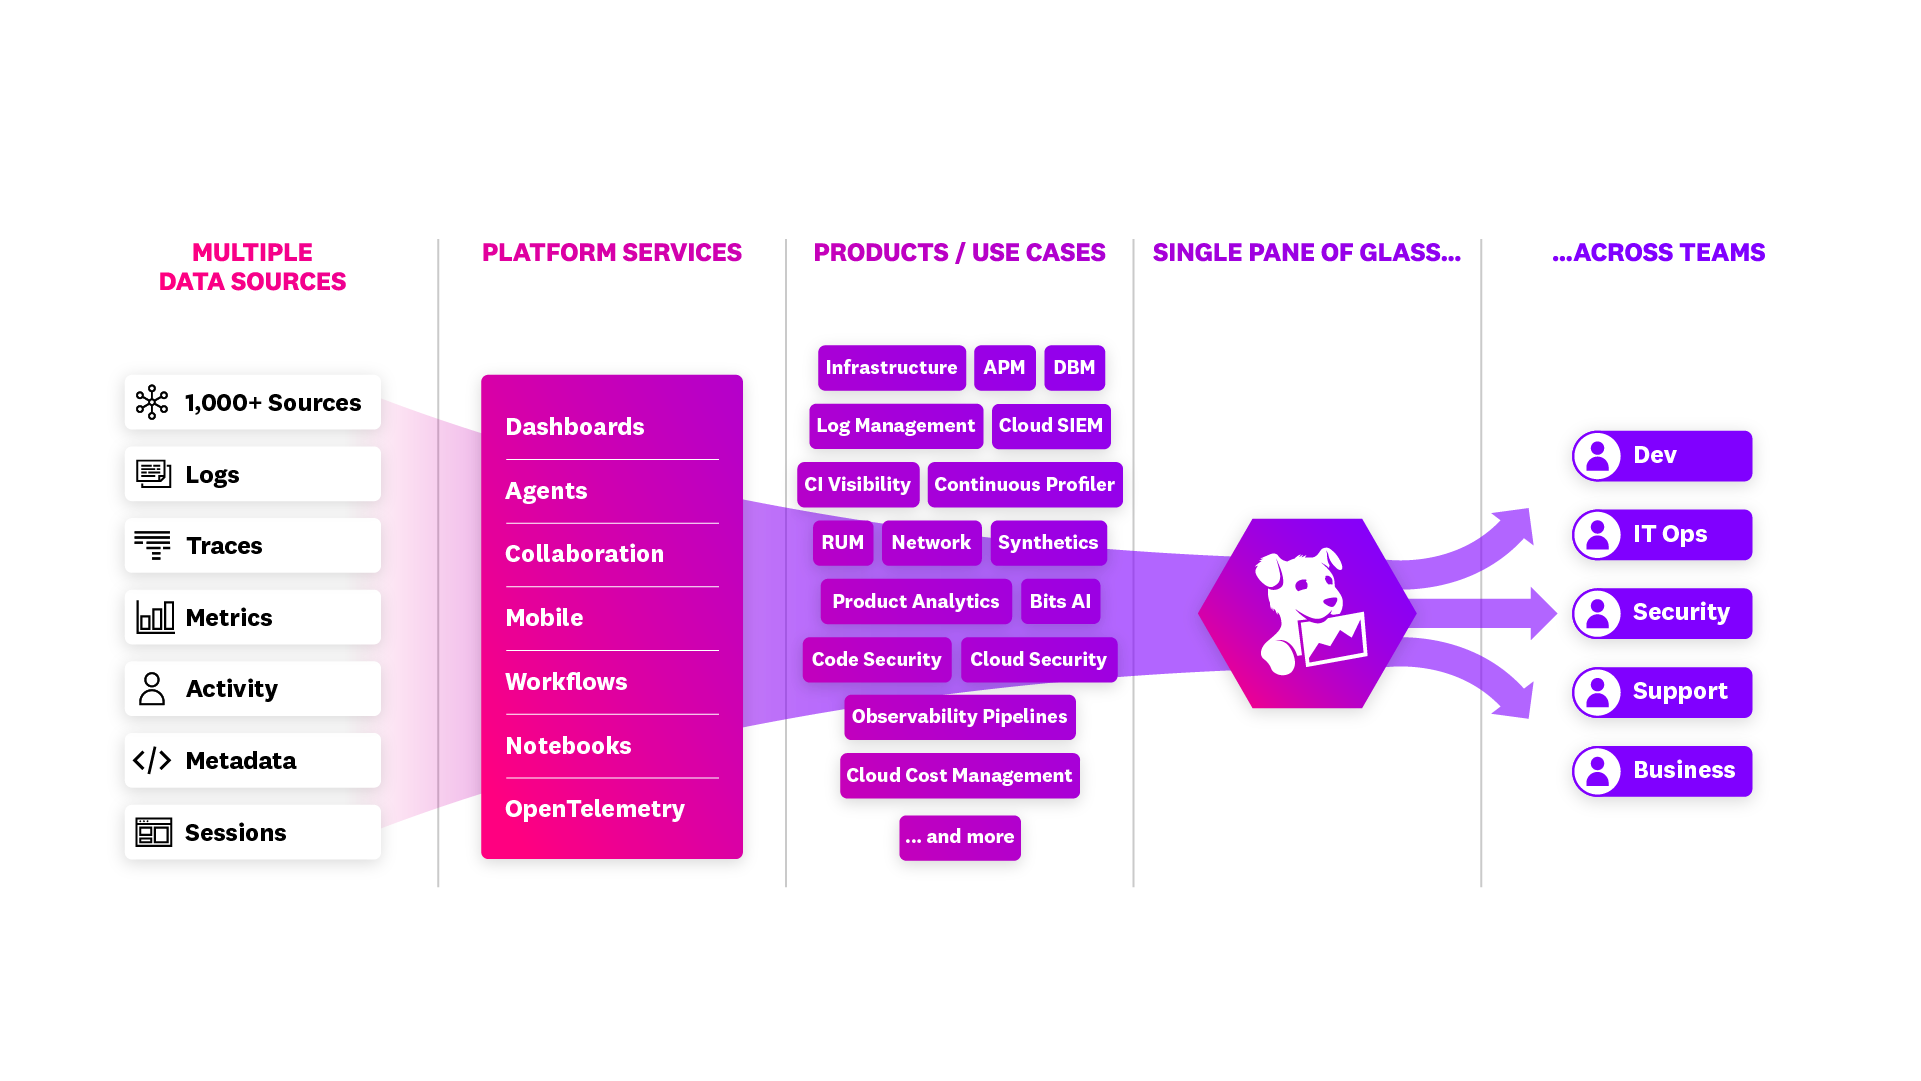
Datadog’s modern observability and security platform brings your tools, technologies, telemetry, and teams together around a single source of truth, enabling a culture of collaboration and resource efficiency for improved service levels and customer experience, cost savings, and faster time to market.
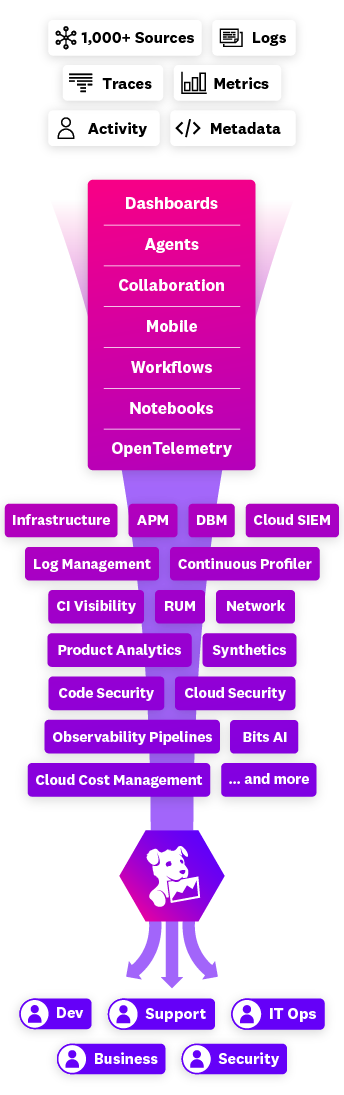
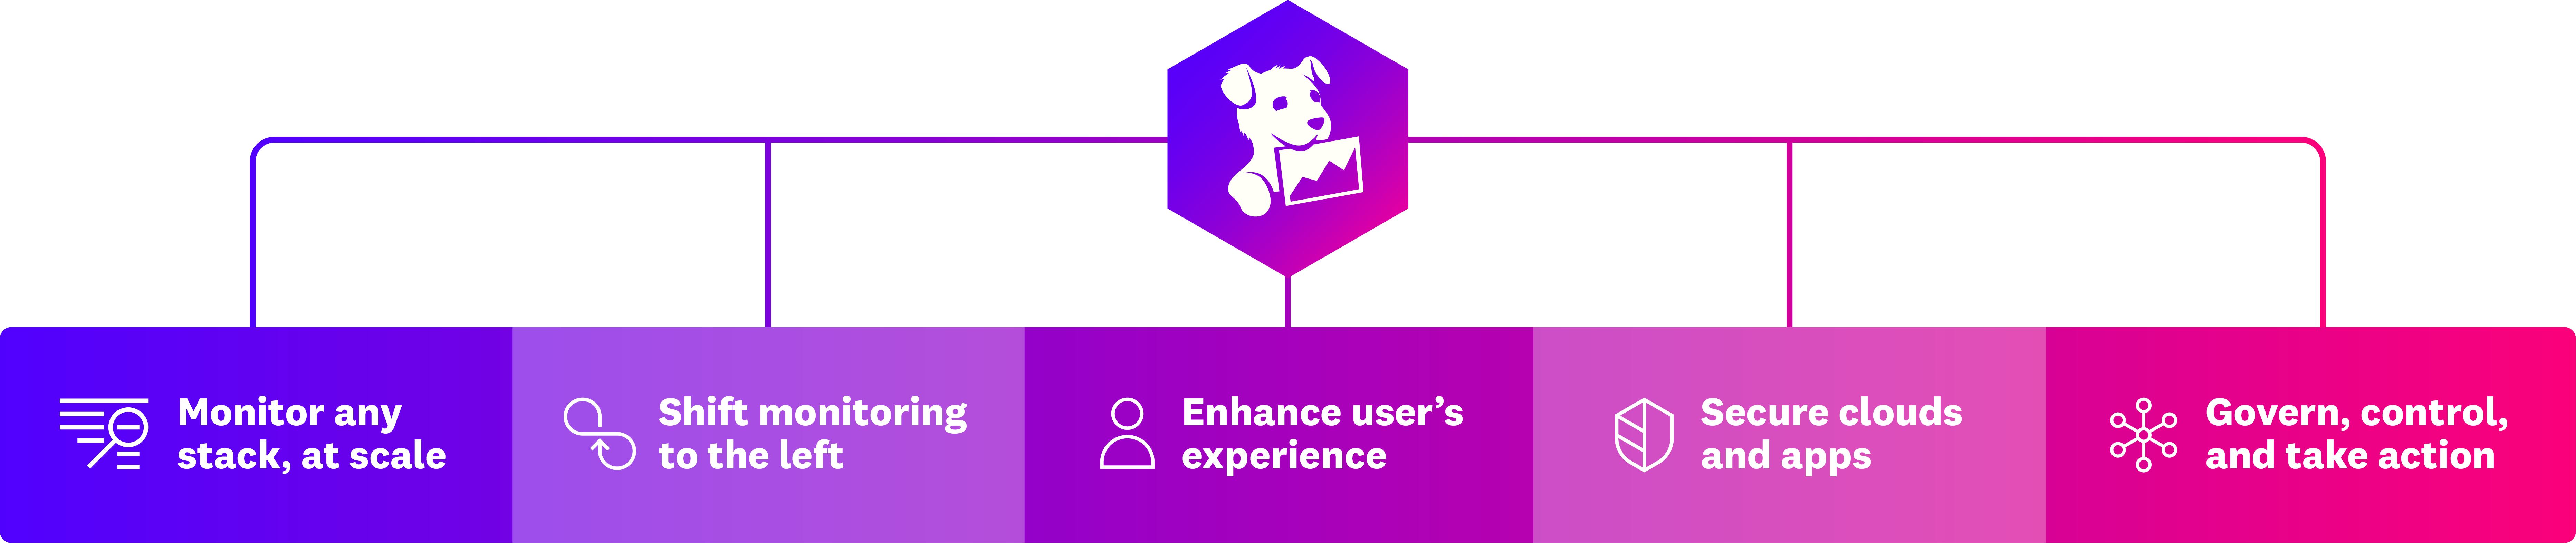
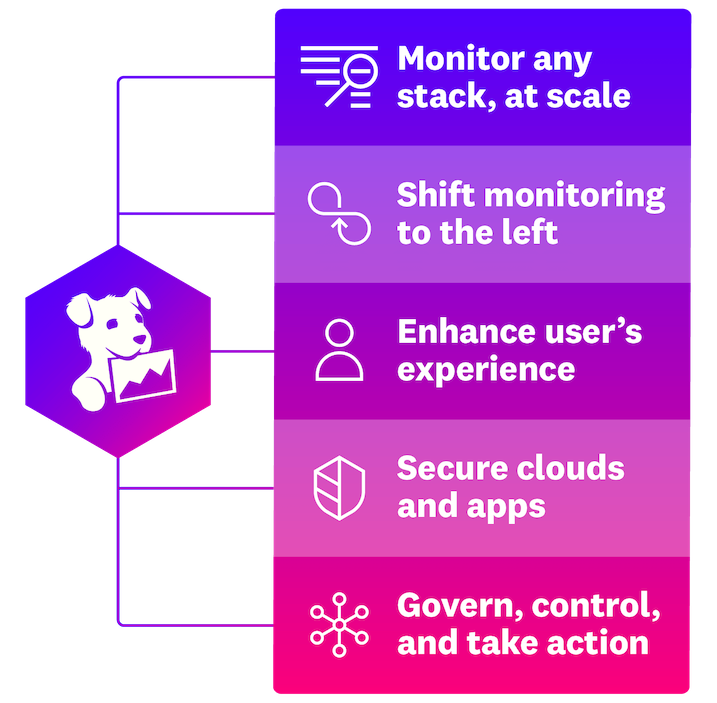
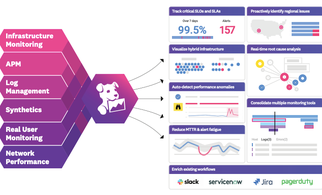
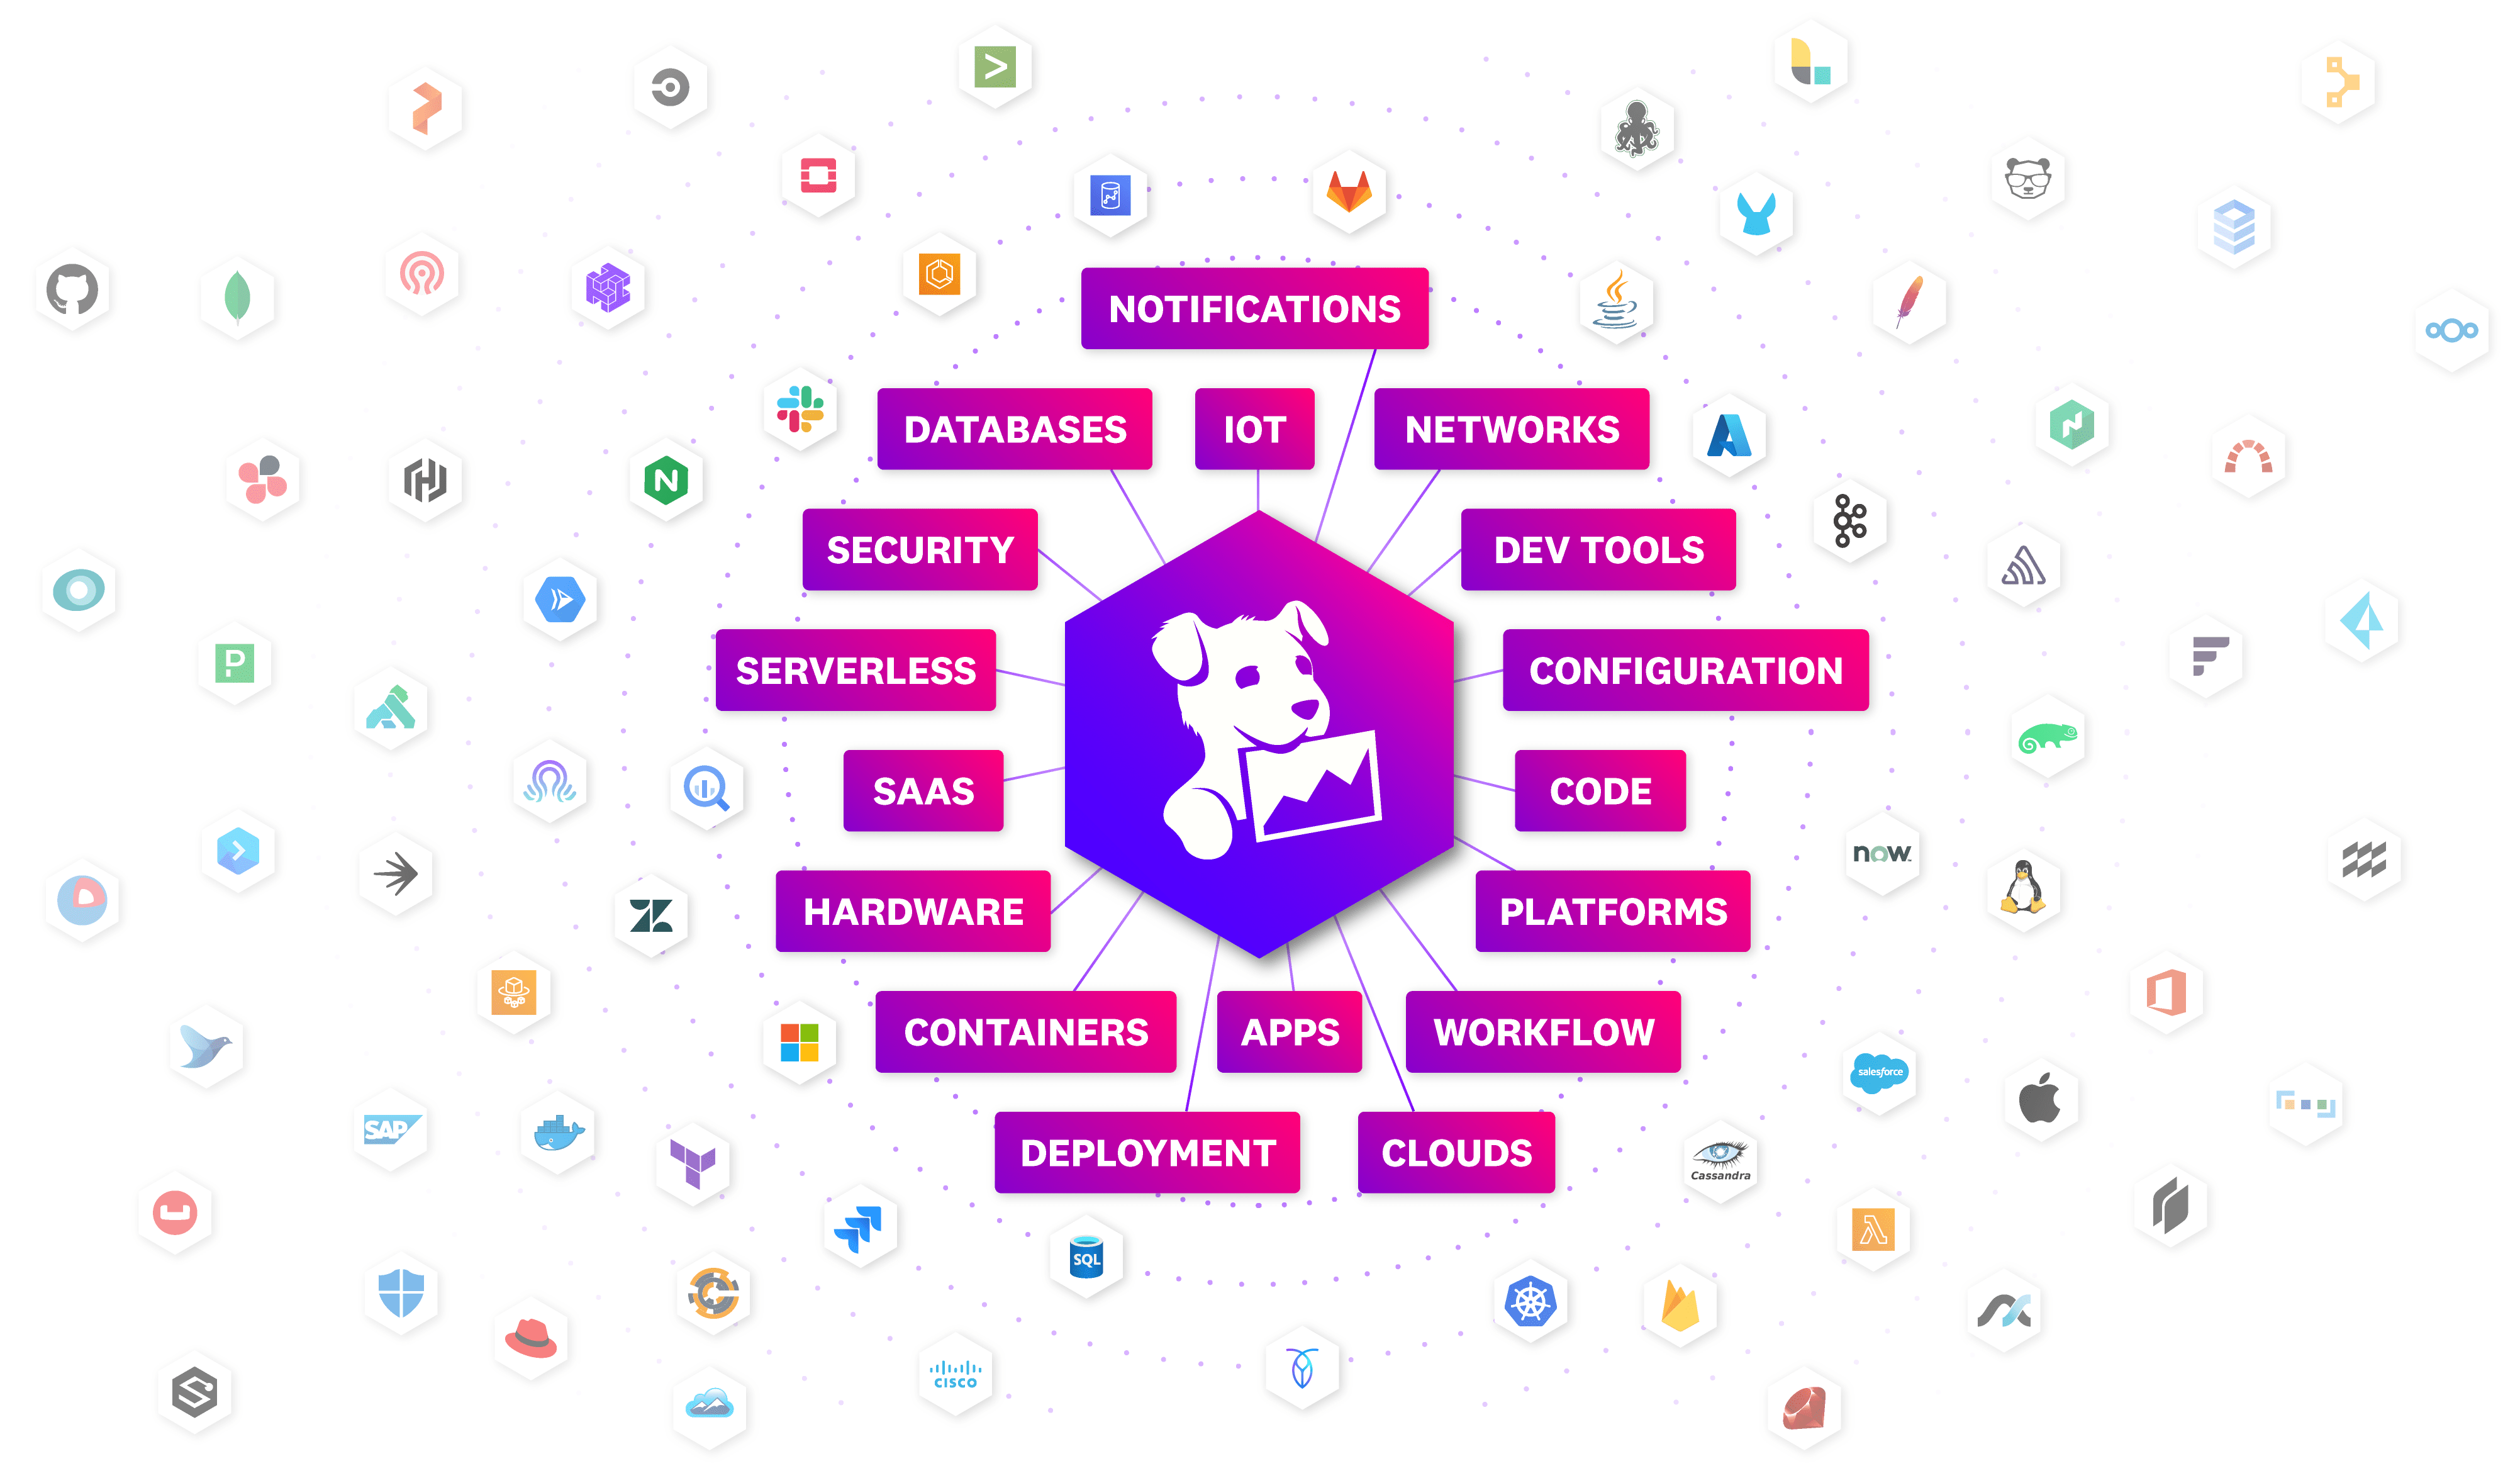
See inside any stack, any app, at any scale, anywhere
With market-leading offerings, unparalleled ecosystem of integrations, and AI-powered technology your teams can ingest, visualize, and troubleshoot across more types of telemetry data than any other vendor on the market—from any source in your stack, all in one unified platform.
Future-proof modernization with continuous innovation
The Datadog platform is constantly growing to help you solve bigger and modern problems with meaningful tooling that gives you full control over your observability data, complete visibility into your AI ecosystem, and end-to-end security for all.