Jason Manson-Hing

Meaghan Vella
When the services in your distributed application interact with a database, you need telemetry that gives you end-to-end visibility into query performance to troubleshoot application issues. But often there are obstacles: application developers don't have visibility into the database or its infrastructure, and database administrators (DBAs) can't attribute the database load to specific services.
Now you can seamlessly link telemetry data from Database Monitoring (DBM) and Application Performance Monitoring (APM) to increase visibility and streamline troubleshooting. Application developers can easily gain key insight into database performance without needing direct access to the database. And DBAs can understand how request traffic from specific services affects the database load and which services might experience latency due to database performance issues.
In this post, we'll show you how you can use DBM and APM together to quickly troubleshoot your applications and the databases that back them. We'll explain how to:
- See database telemetry in your traces
- Correlate service performance with the health of your database infrastructure
- View APM data from each database's calling services
Gain insight into your database queries from within APM
APM's trace view shows you the calls your application makes to all of the distributed services involved in fulfilling a request, including databases. The flame graph visualizes these calls and shows you the relative duration of each one, so you can easily identify a slow query that affects your application's performance. The SQL Queries tab displays the text of the query, and timeseries graphs show you the database's request, error, and duration (RED) metrics and pinpoint the time the query was executed.
Once you've linked DBM with APM, the trace view also shows each query's explain plan, as illustrated below. The plan shows how the database executed the query and quantifies how efficient it was, displaying that value as the query's Plan Cost and attributing a percentage of the cost to each step in the query execution. In this case, the database performed a sequential scan on the UserTeams table.
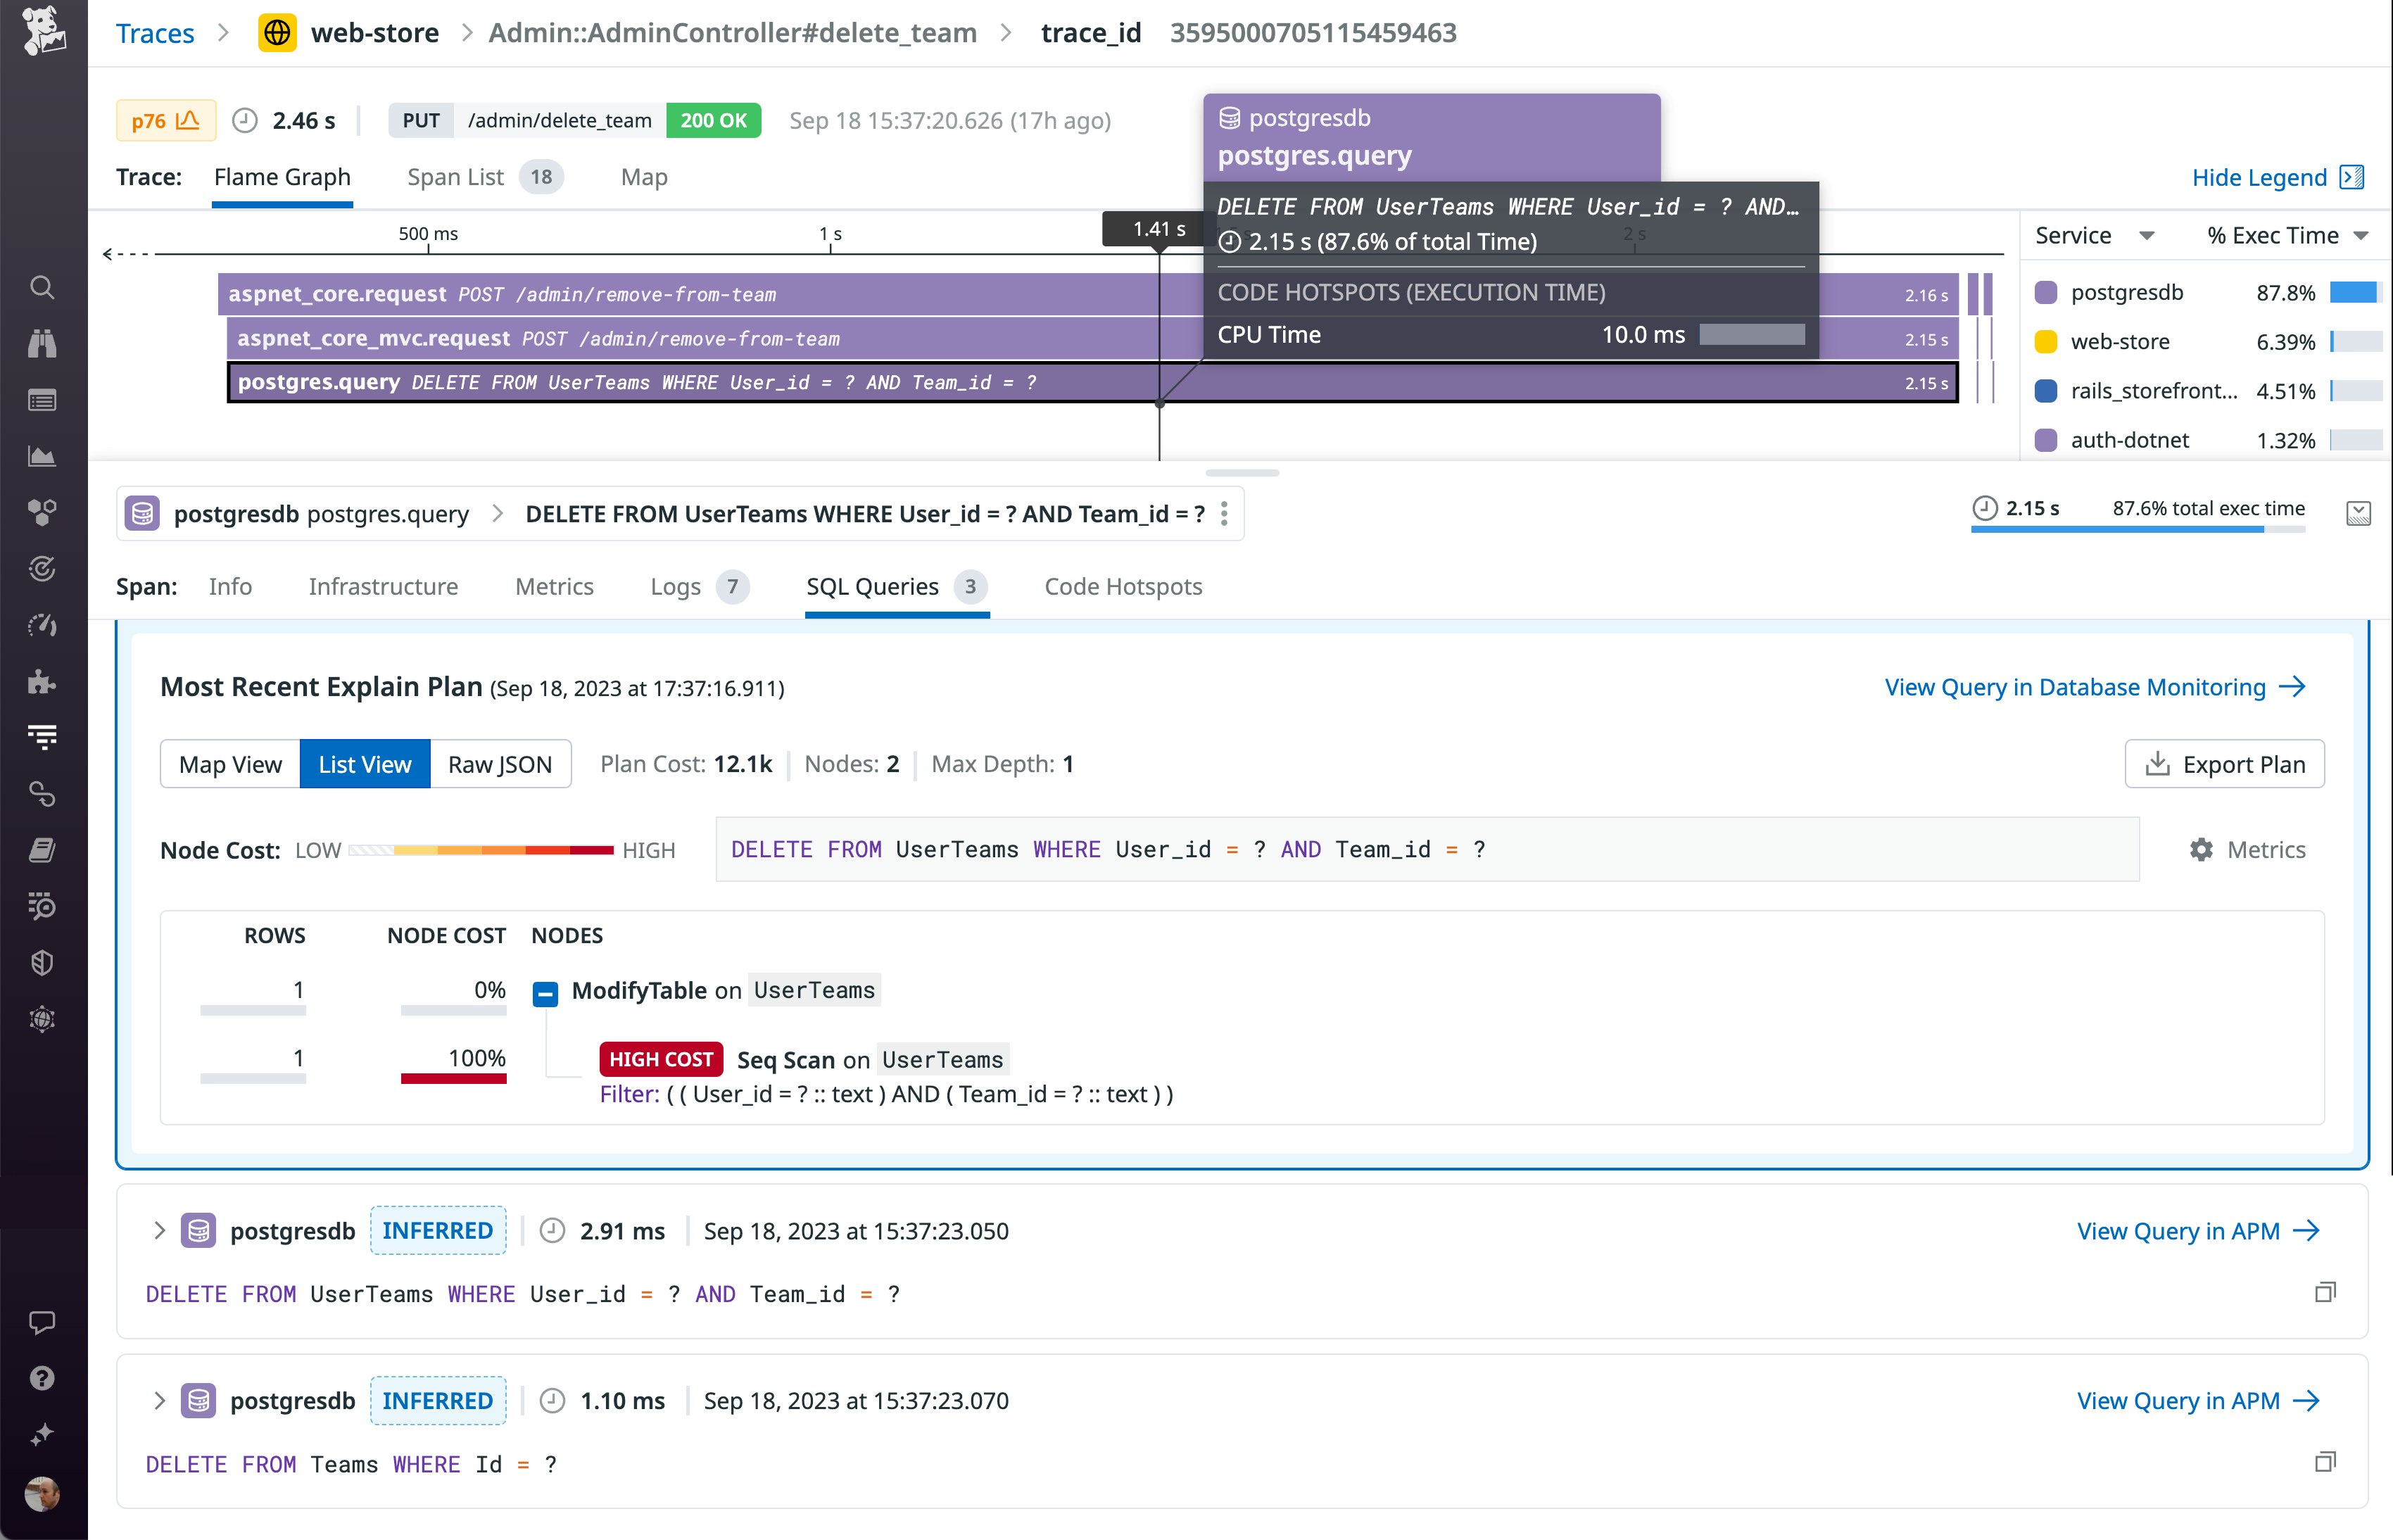
Typically, an application developer whould have to request this information from a DBA, who would have to log into a database node and run a query. But now that this is visible in the trace view, application developers can easily see that the query came with a high cost (12,100) and high latency (2.15 seconds). They can click the View Query in Database Monitoring link to pivot to DBM and search for related performance issues by investigating blocking queries and wait events. With a clear explanation of the error and insight into the performance of the database, developers can easily collaborate with DBAs to mitigate the issue.
Correlate service performance with downstream database infrastructure
The APM Service Page gives you a valuable starting point for troubleshooting issues in your service. A key factor in a service's performance is its downstream database—and the infrastructure that runs that database. When you connect DBM and APM, the Databases tab—shown in the screenshot below—surfaces key insights into your database hosts, including the status of their monitors, query rate, connections, and wait events.
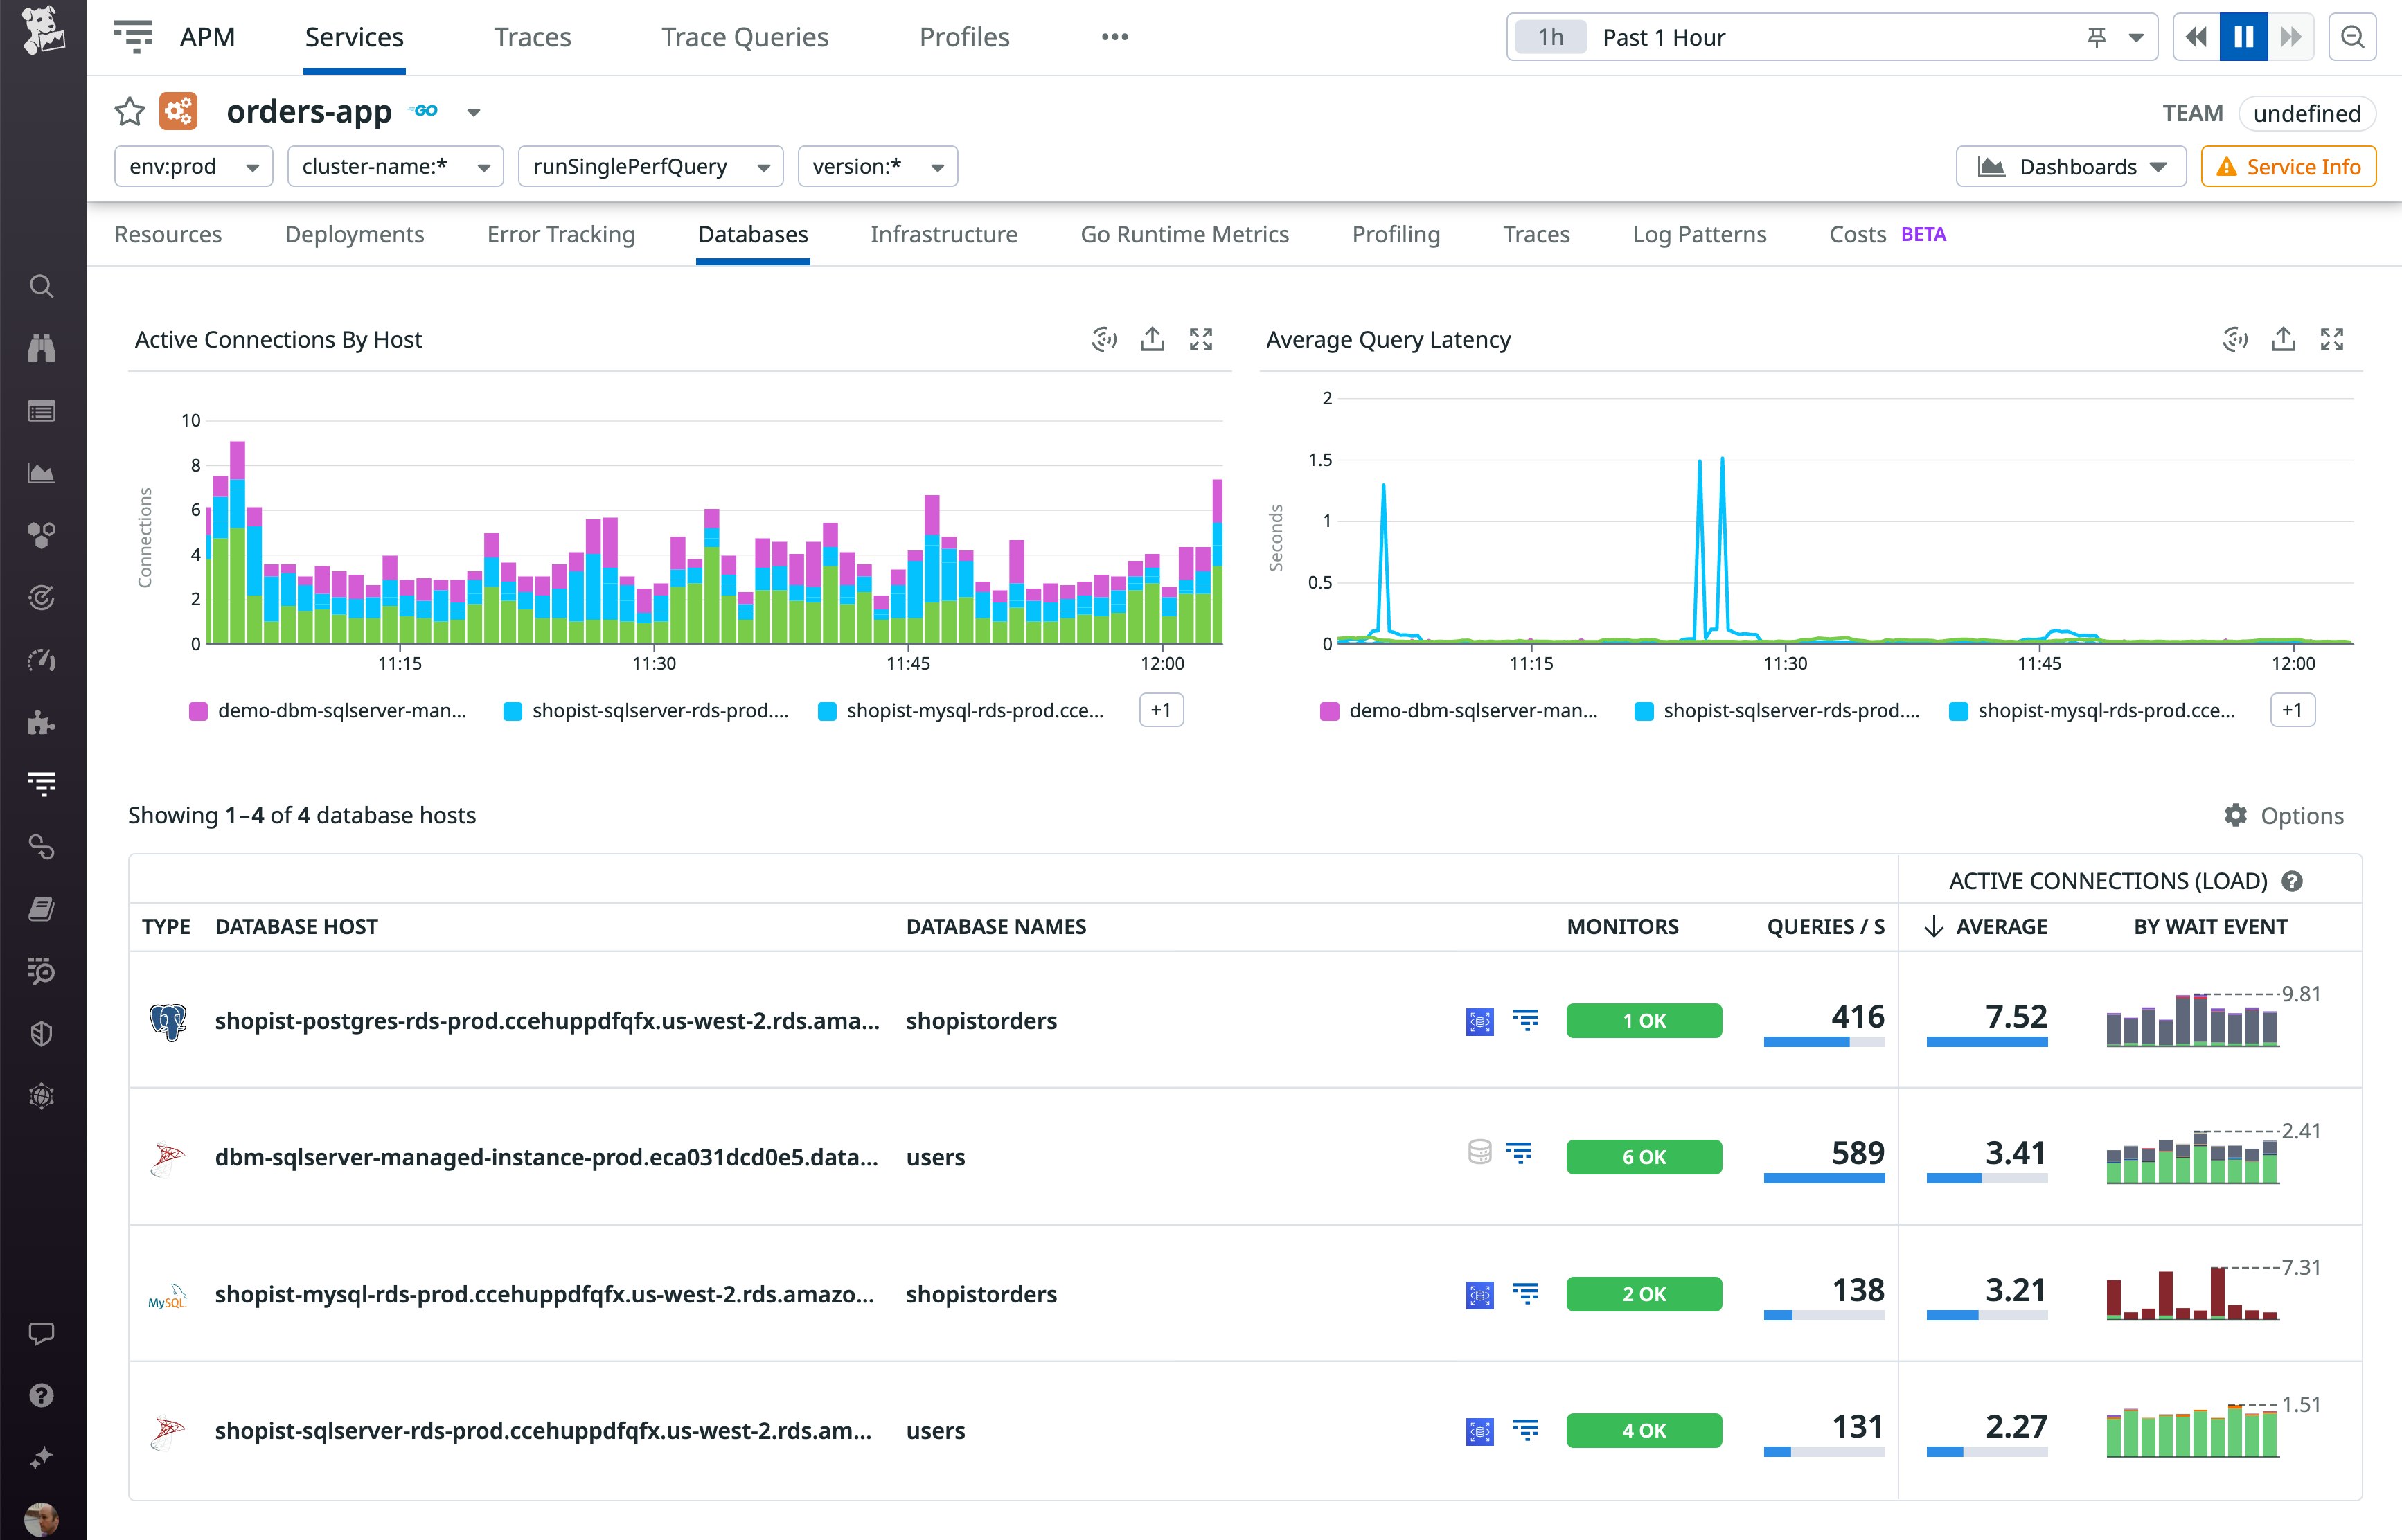
Now, application developers can see database infrastructure data without leaving the Service Page. They can quickly see when a database host has encountered an issue—for example, high load leading to resource contention and a change in the overall query performance profile seen in the wait events—that could cause their service's performance to degrade. Instead of searching for a root cause in the application code, developers can now pass this information to DBAs who can mitigate the issue by scaling up other database hosts or adding hosts to the fleet.
View APM data to gain context around database performance
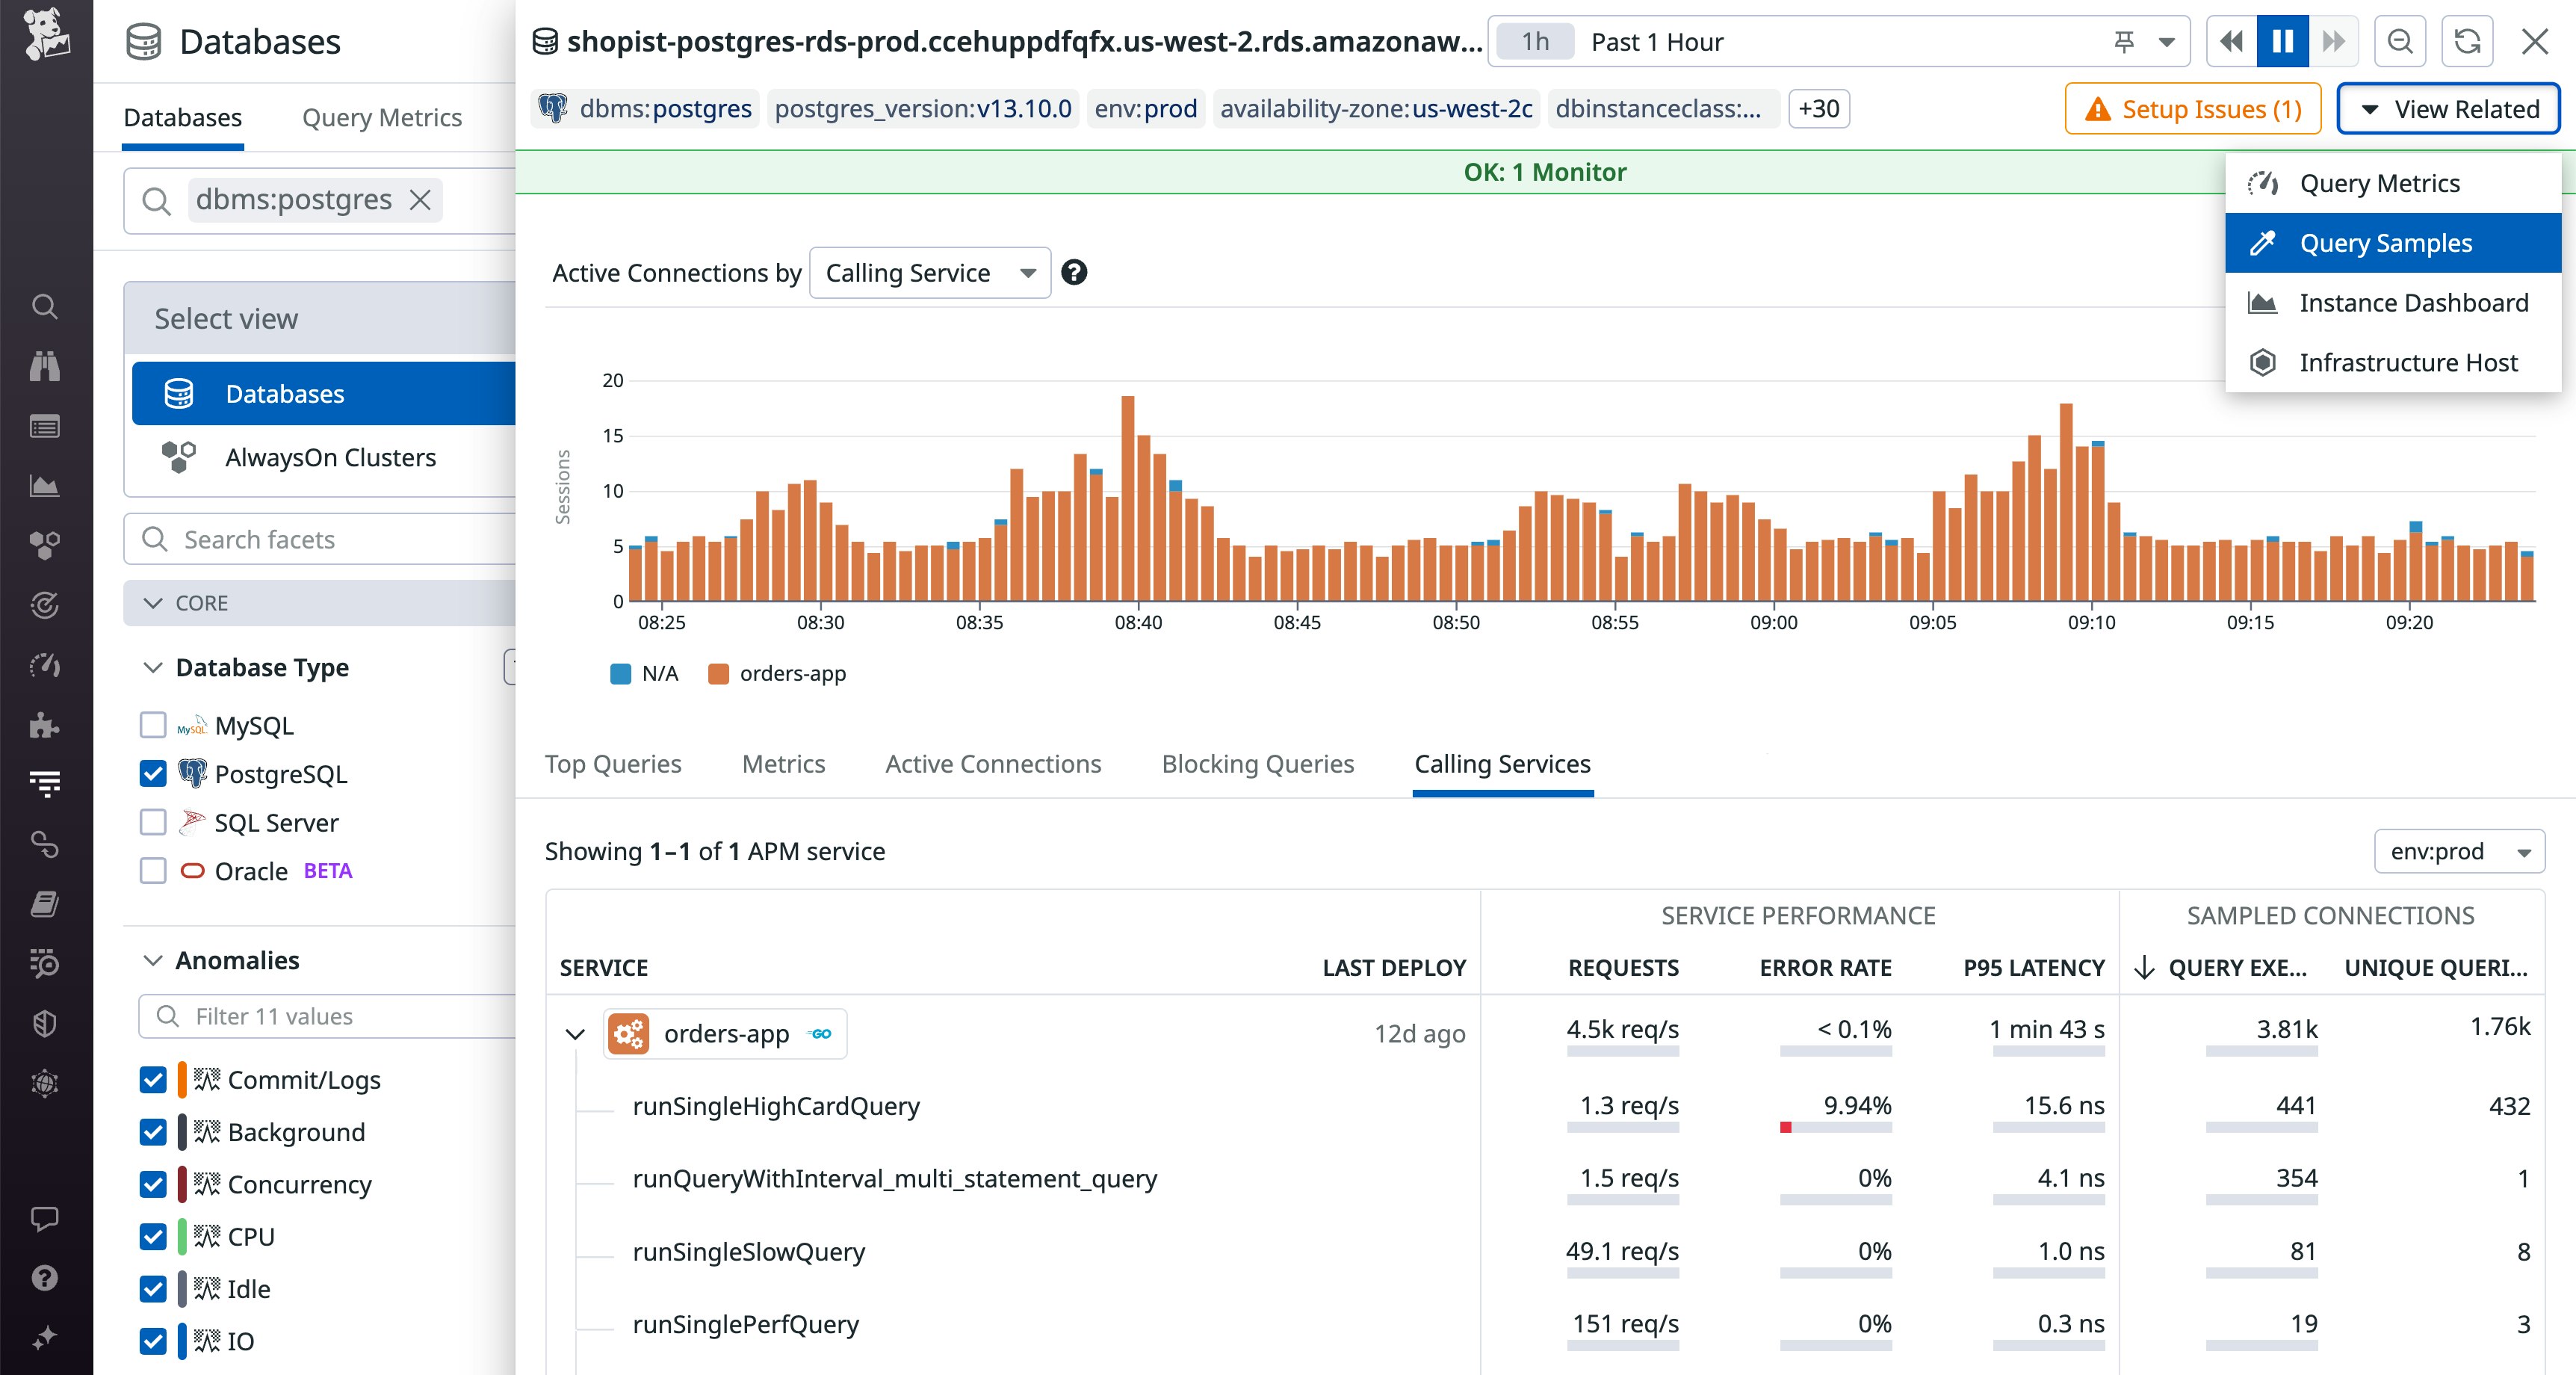
DBM shows you key information about database load, activity, and performance—including blocking queries and wait events—to help you troubleshoot issues and ensure the overall health of your database. And once you link DBM with APM, you'll see where each query came from—the calling service that sent the request—plus that service's request rate, error rate, and latency. This makes it easy to correlate database query metrics with service activity and helps DBAs attribute potential sources of database load so that they can understand how your database is affected by the services that call it.
In the screenshot below, the Calling Services tab shows that the users database has received traffic from two services: auth-dotnet and product-recommendation. The auth-dotnet service is expanded to show each resource that has sent queries, and a performance summary and sample of connections are available for each one. Note that the service's /admin/create-user resource has a 100 percent error rate calling the database.
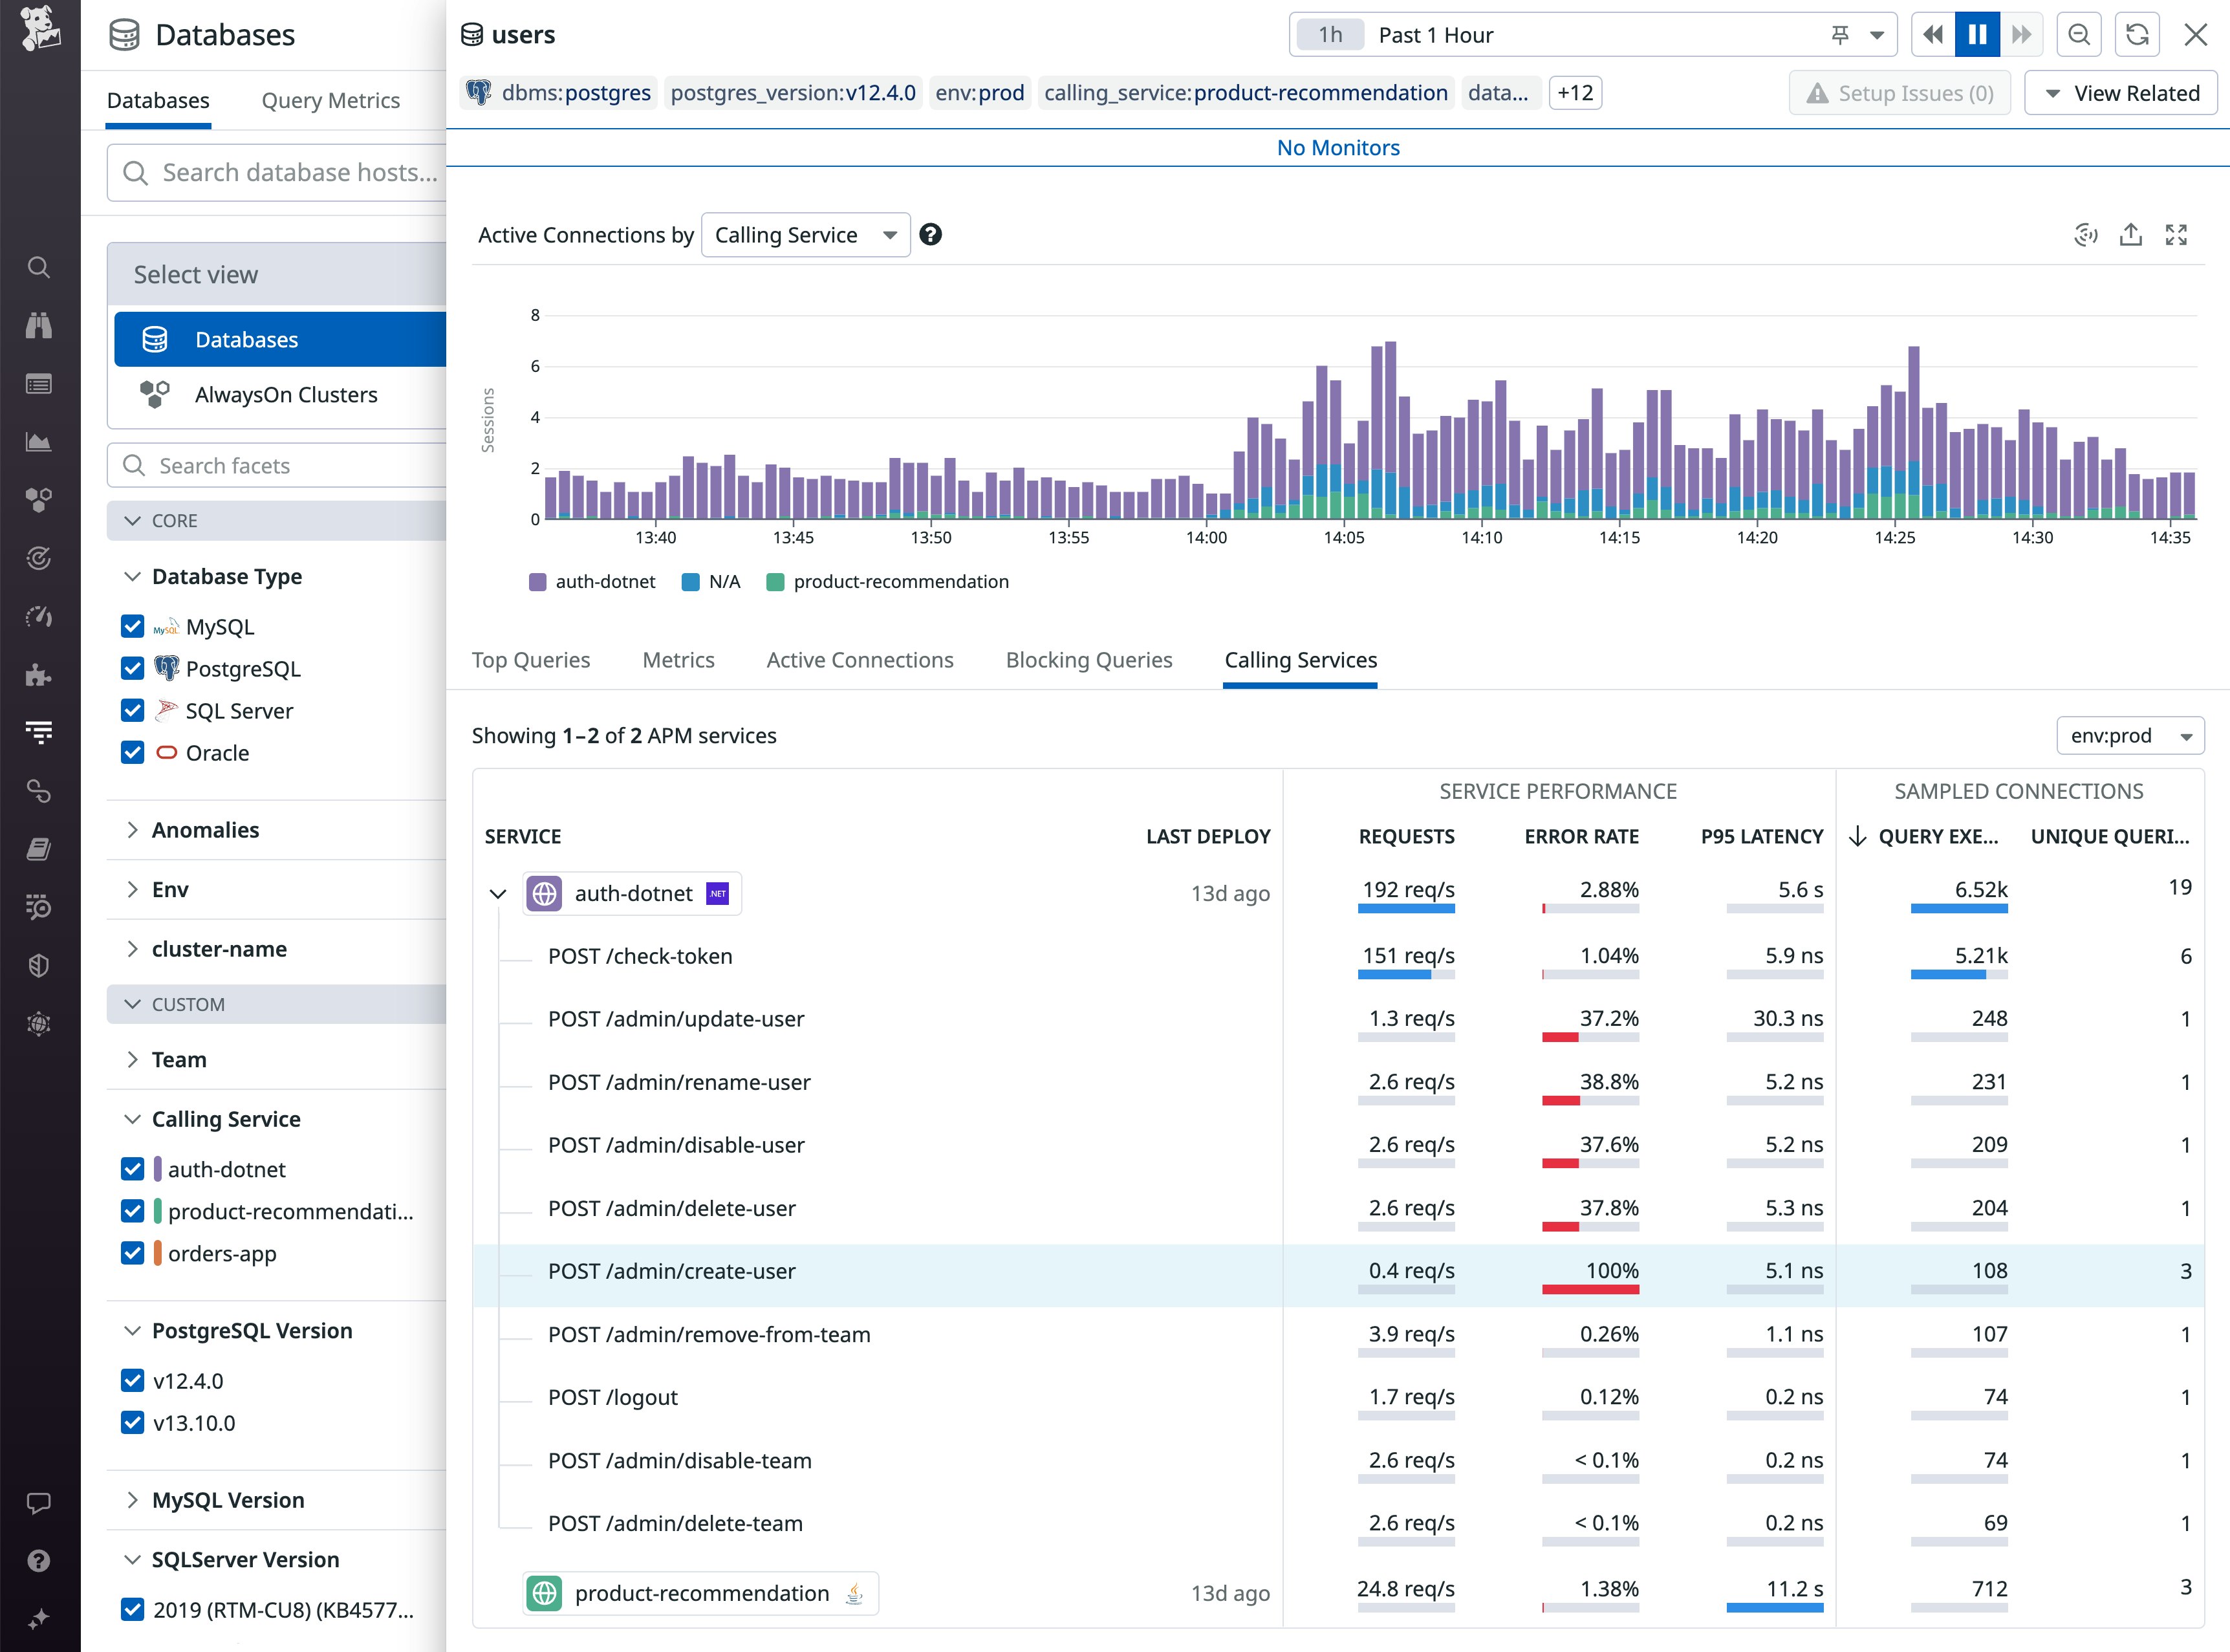
A DBA who's investigating the source of the errors can click the View Related button in the top-right to see details about the incoming requests, including a sampling of queries along with a flame graph that shows how the database contributes to overall application latency.
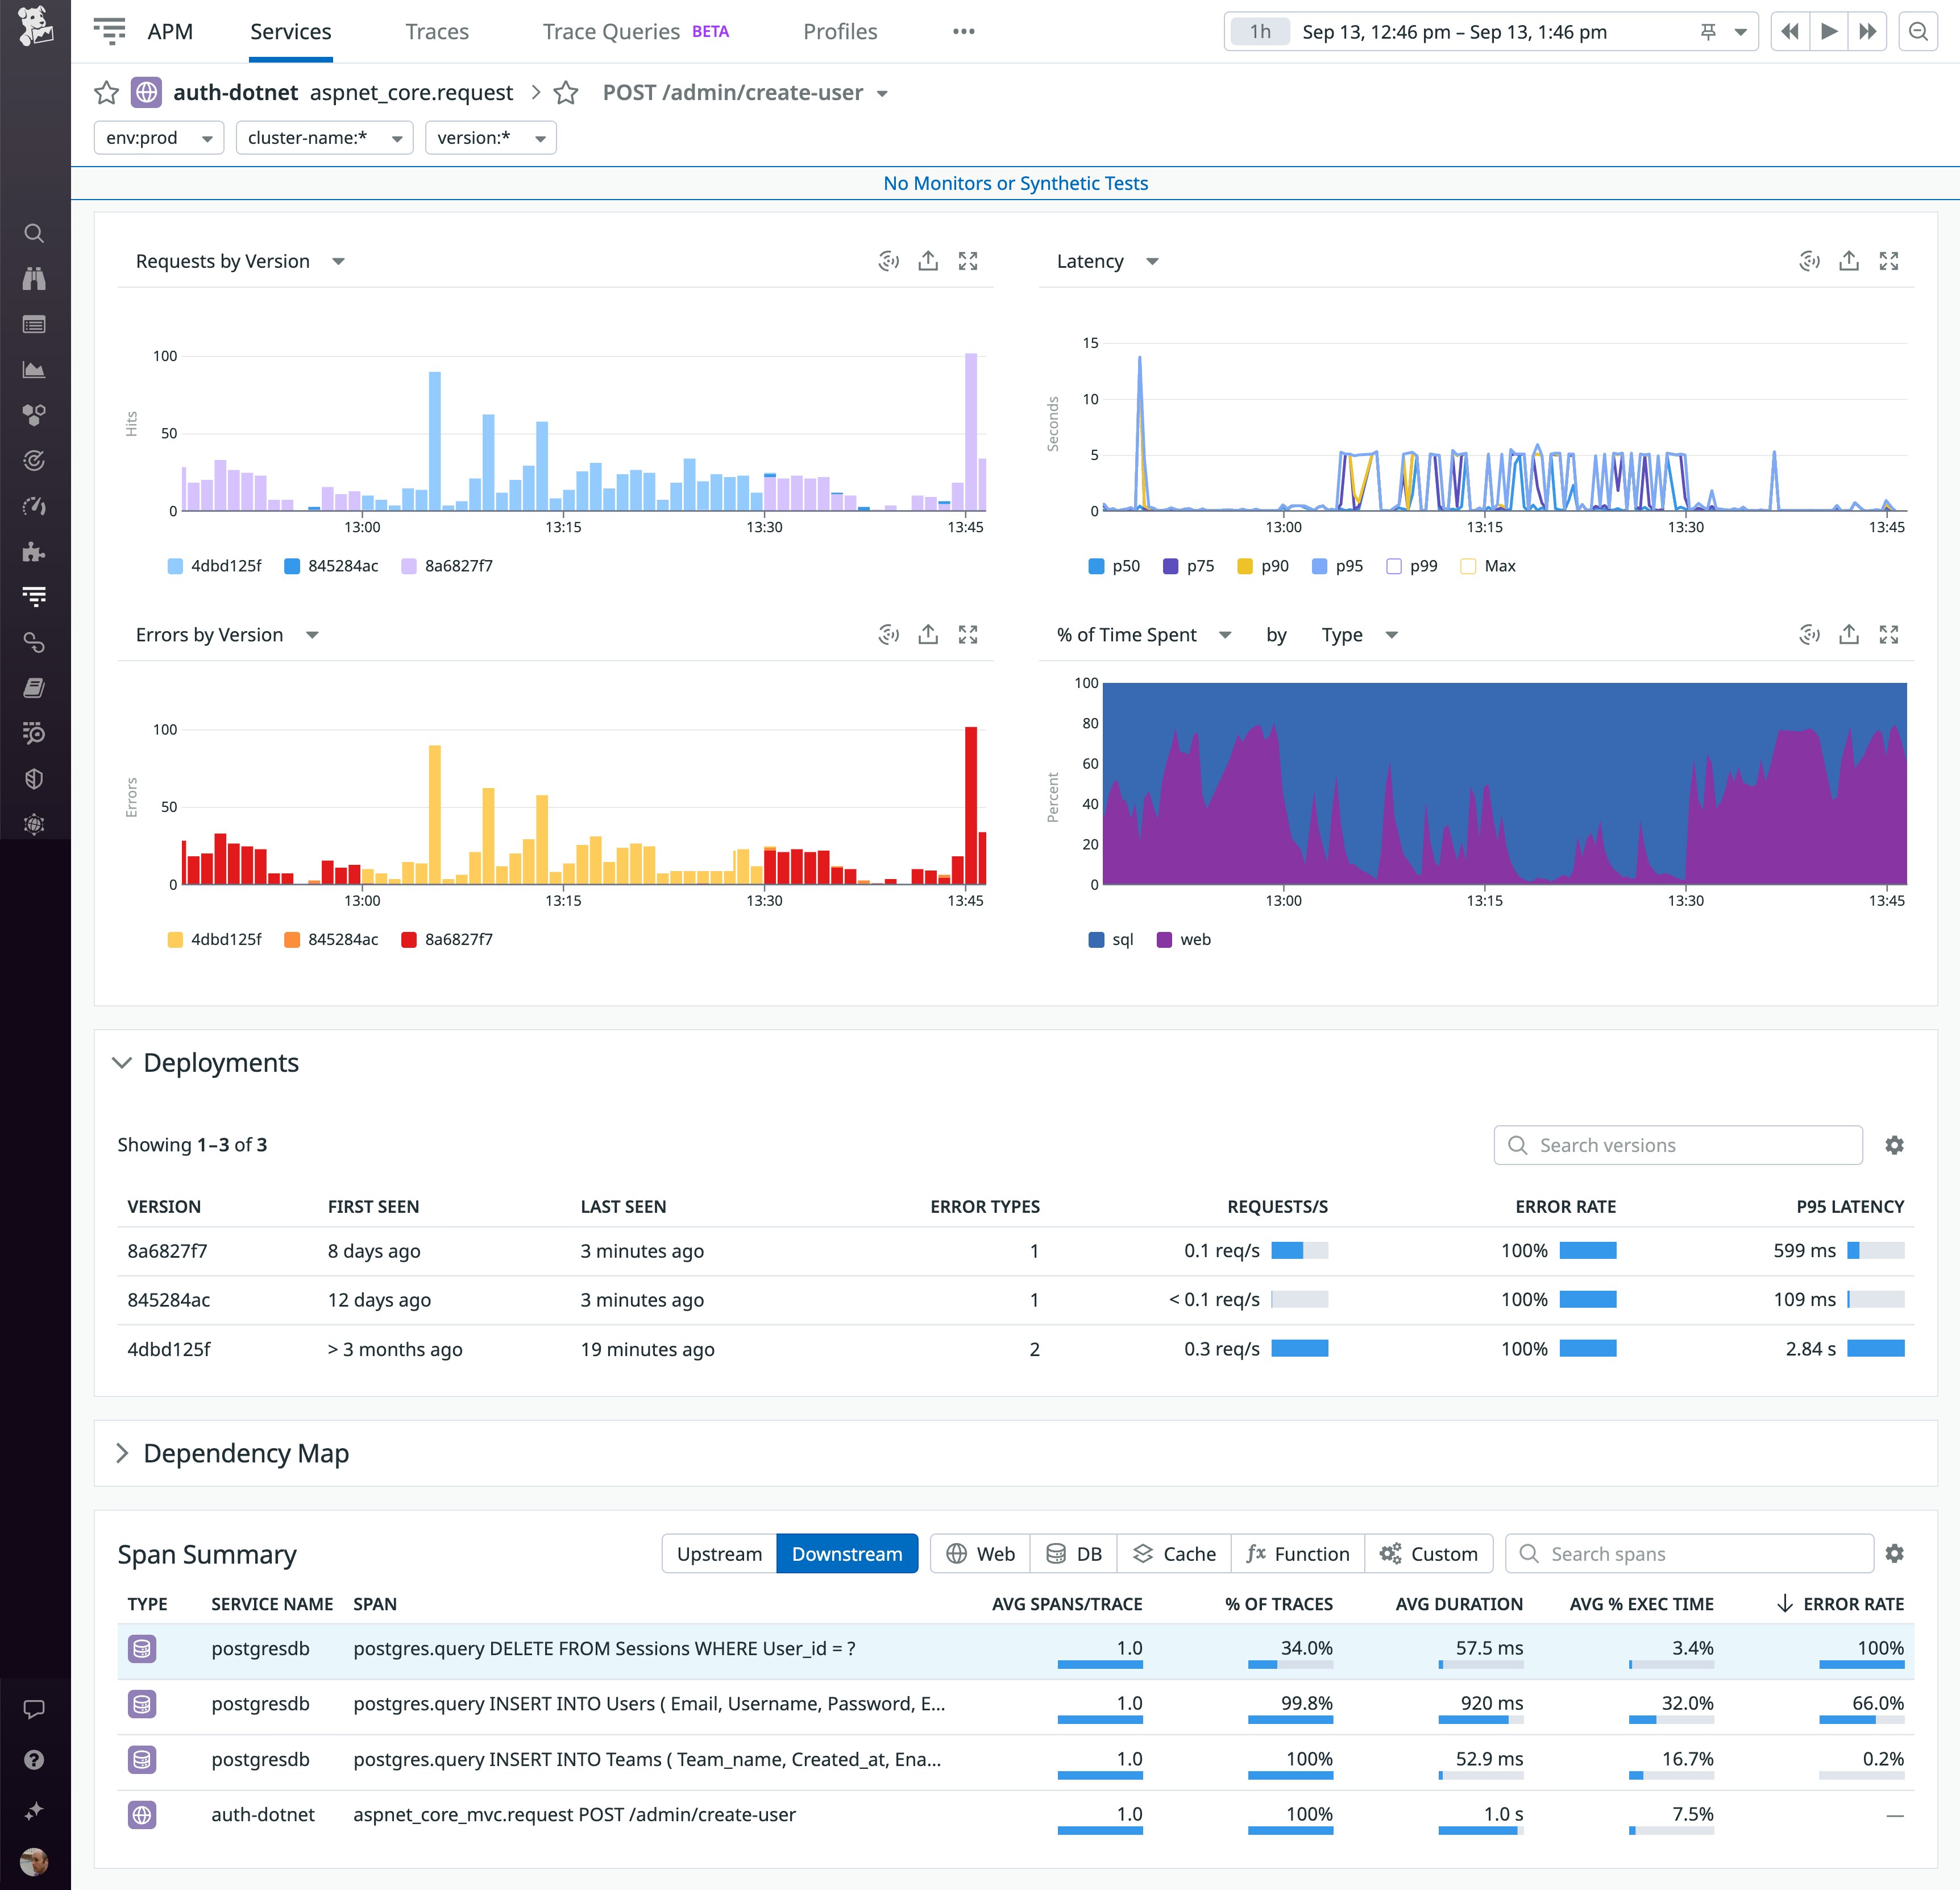
To see data about the service's recent deployments and dependencies—as well as performance data about the resource experiencing the errors—they can click the /admin/create-user row to pivot to APM. In the screenshot below, the Service Page shows a correlation between a rise in errors and the most recently deployed version of the service. The Span Summary section of the page shows the SQL statement that's causing the error, giving application developers and DBAs key information they can use to troubleshoot and mitigate the issue.
Link DBM and APM telemetry for fast, intuitive troubleshooting
By connecting DBM and APM, you can gain the visibility you need to correlate the performance of your services with the databases and database infrastructure they rely on. Speed up your troubleshooting and streamline collaboration by surfacing telemetry and trace data without switching contexts. See the documentation for complete information about how to link DBM with APM and how they work together with the databases, languages, and frameworks you use. And if you're not yet using Datadog, start today with a 14-day free trial.

