Brooke Chen
Senior Product Manager

Othmane Abou-Amal
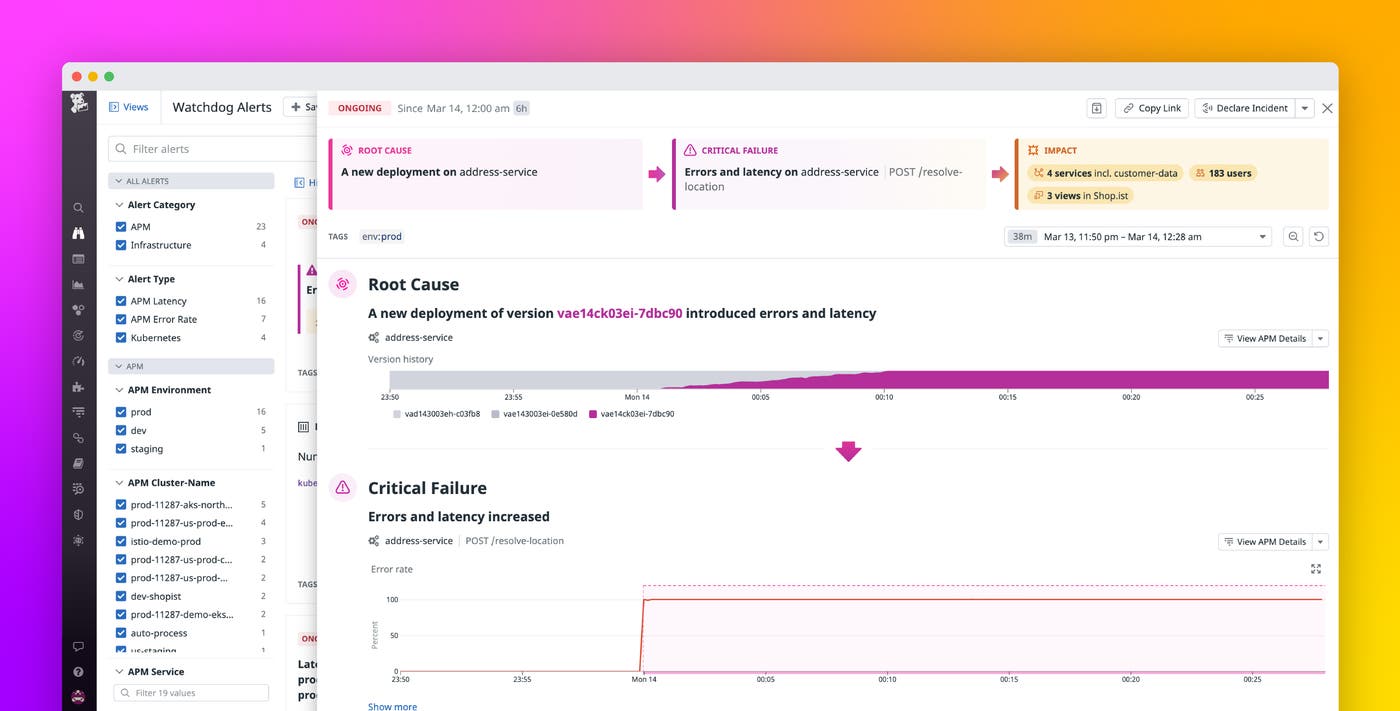
Since 2018, Watchdog has provided machine learning-based anomaly detection to notify you of performance issues in your applications. Watchdog groups APM and infrastructure anomalies across different services to help you better understand the scope of issues, without requiring any manual configuration. Today, we're excited to announce the general availability of Watchdog Root Cause Analysis (RCA), which automatically identifies causal relationships between symptoms across your applications and infrastructure—and pinpoints the root cause. This hands-free approach to root cause analysis enables you to resolve problems faster than ever, significantly reducing your mean time to resolution (MTTR).
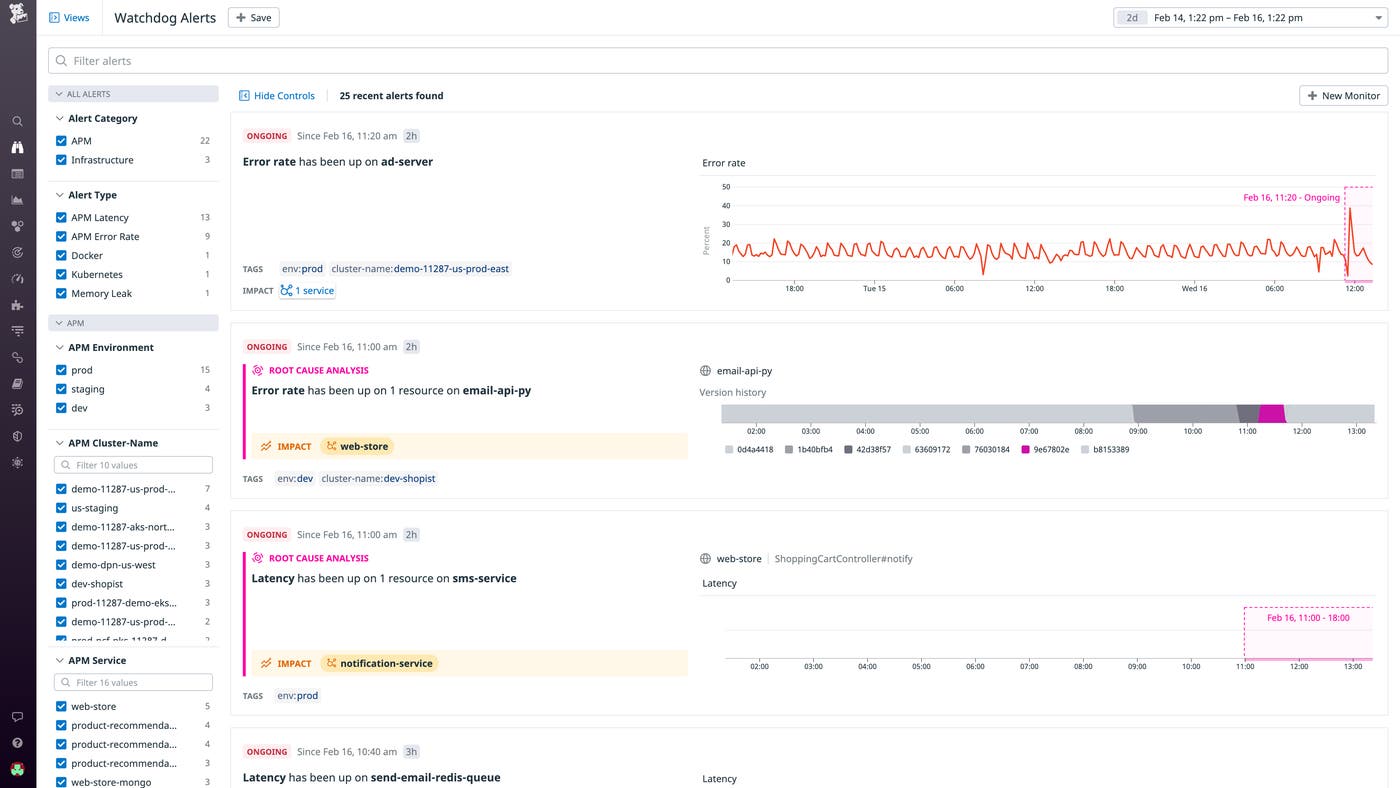
Automatically identify the root cause of anomalies and the resulting critical failure
When Watchdog detects an anomaly in your environment, it adds a "story" to your feed, which includes a summary of the issue, a graph scoped to the period of interest, and other contextual information such as impacted services and users. Watchdog RCA builds on this existing functionality by mapping your applications and infrastructure and understanding how these different components typically interact. As new anomalies are detected, Watchdog is able to use its knowledge of your system to identify the probable root cause of issues. It also surfaces the resulting critical failure, which is the first sign of failure in a causal chain initiated by the root cause. To better illustrate these concepts, let's take a look at an example story.
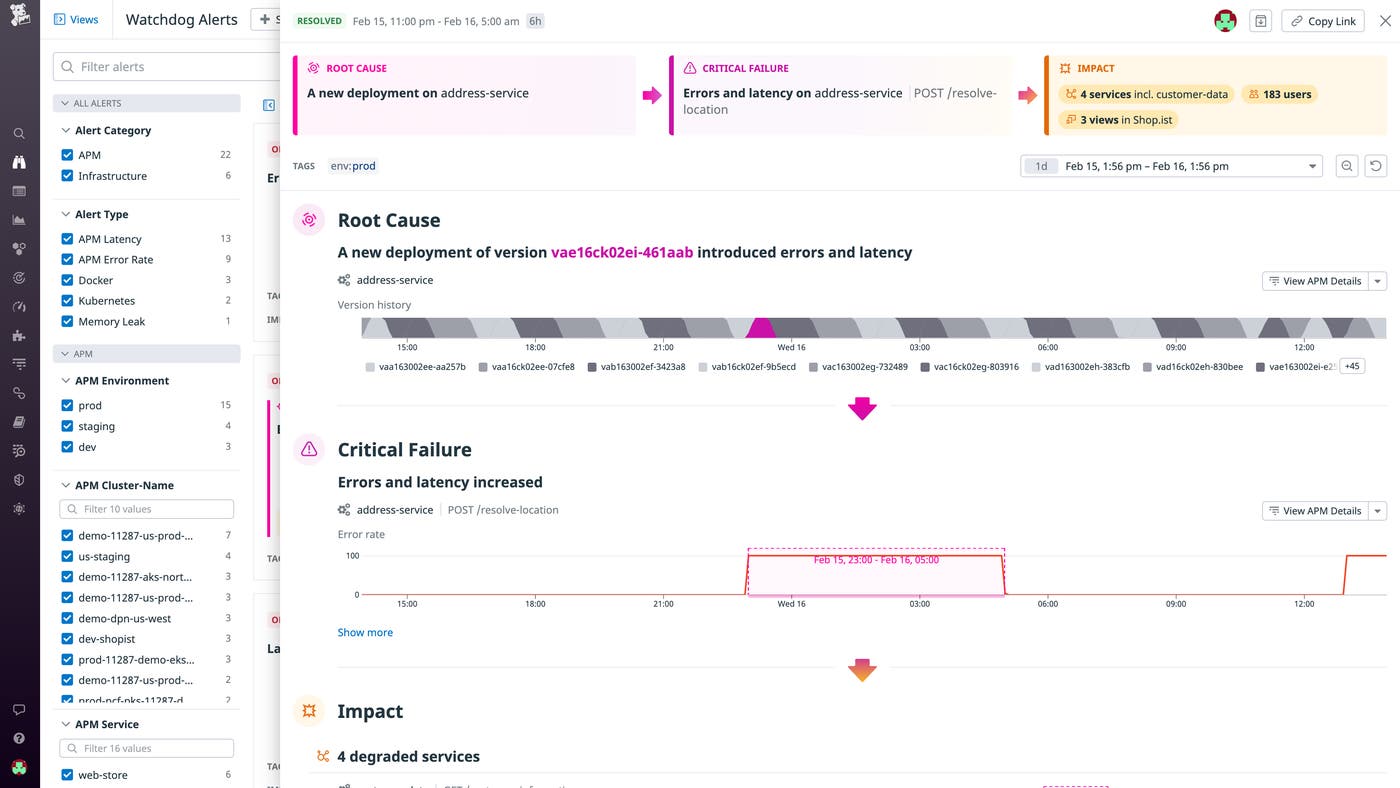
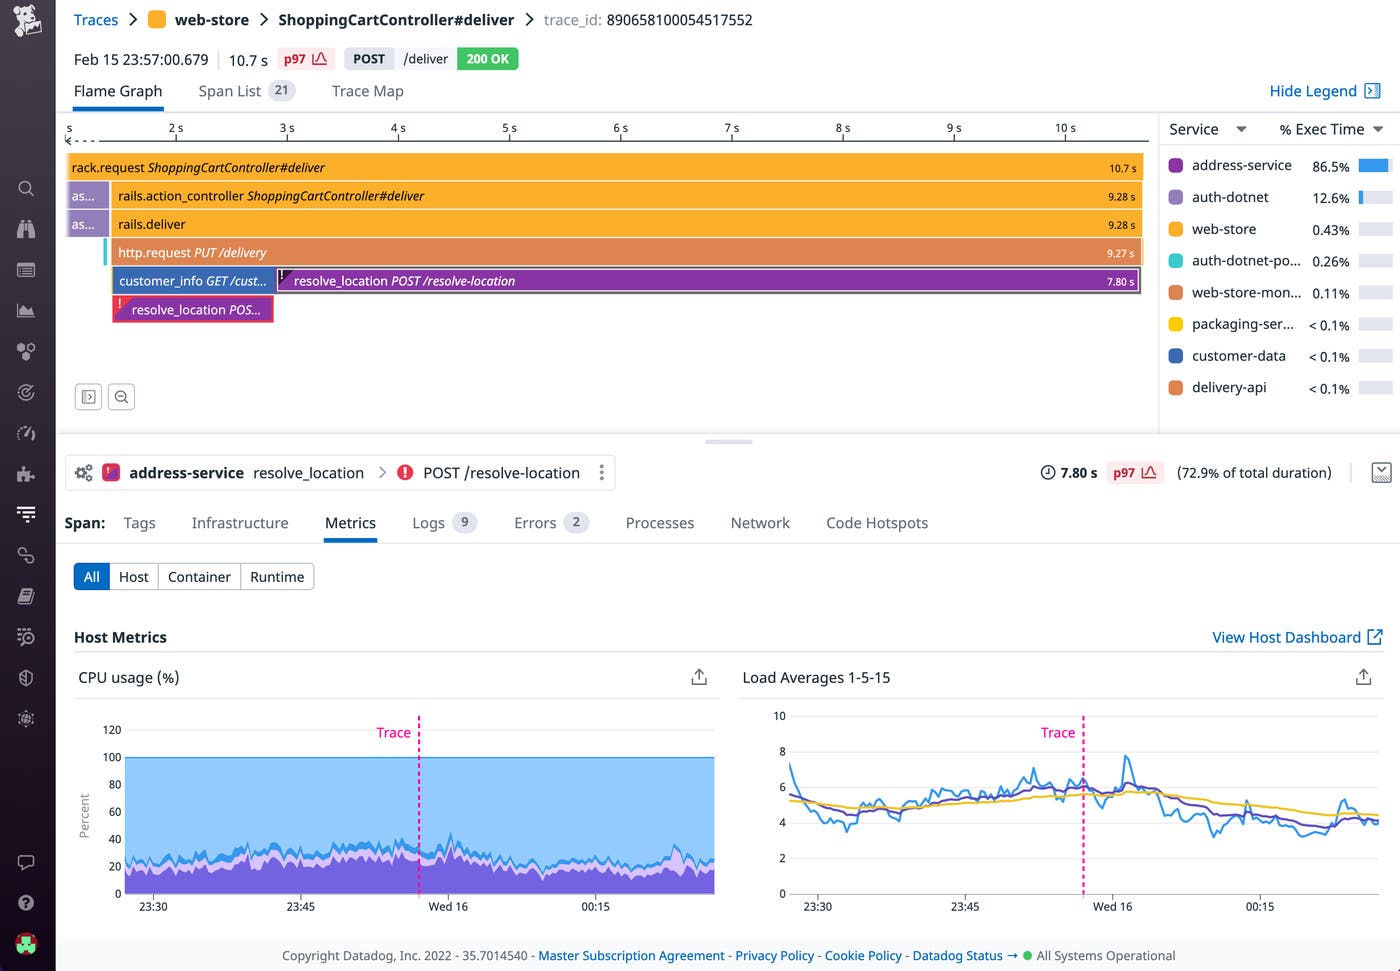
Here, Watchdog RCA has identified that a faulty deployment of address-service (root cause) introduced unwanted errors and latency (critical failure) for 6 hours between February 15 and 16. To help you quickly remediate the issue, it shows you the exact error that occurred, as well as sample request traces. Clicking on a trace sample takes you to a flame graph, which you can correlate with infrastructure metrics, logs, code profiles, and other types of monitoring data for additional troubleshooting context.
In addition to problematic code changes, Watchdog is also able to detect the following root causes:
An increase in traffic from a client: For instance, if a service is querying a database more frequently than usual and driving up latency across many other services as a result, Watchdog will enable you to see the increased load—and identify the offending service and resource.
An AWS instance failure: If an unreachable AWS EC2 instance is causing its dependent services to fail, Watchdog will surface the problematic instance to speed up troubleshooting.
A disk reaching its maximum capacity: If your web app search endpoint is erroring out due to an increase in errors in your Elasticsearch cluster, a full disk on one of its hosts could be at fault. Watchdog identifies the exact host that is causing the issue and highlights the offending disk metric, so you can take swift corrective action.
If you do not see a root cause for a story that Watchdog has created, your application may not be instrumented to collect the telemetry data required to identify the causal relationship, or we may not yet have support for that particular root cause. We are currently working to expand our coverage to other infrastructure issues, such as CPU saturation and memory leaks.
Assess the end-user impact to better prioritize troubleshooting efforts
As discussed above, Watchdog provides continuous visibility into your application and lets you know where to start investigating an issue. But if there are dozens of issues in your environment, you need a way to understand which ones are the most urgent so that you can triage them accordingly. To address this challenge, Watchdog Impact Analysis shows you exactly which services are facing performance degradations and who they are impacting. This way, you can accurately assess the scope of issues and prioritize those that are affecting the most users.
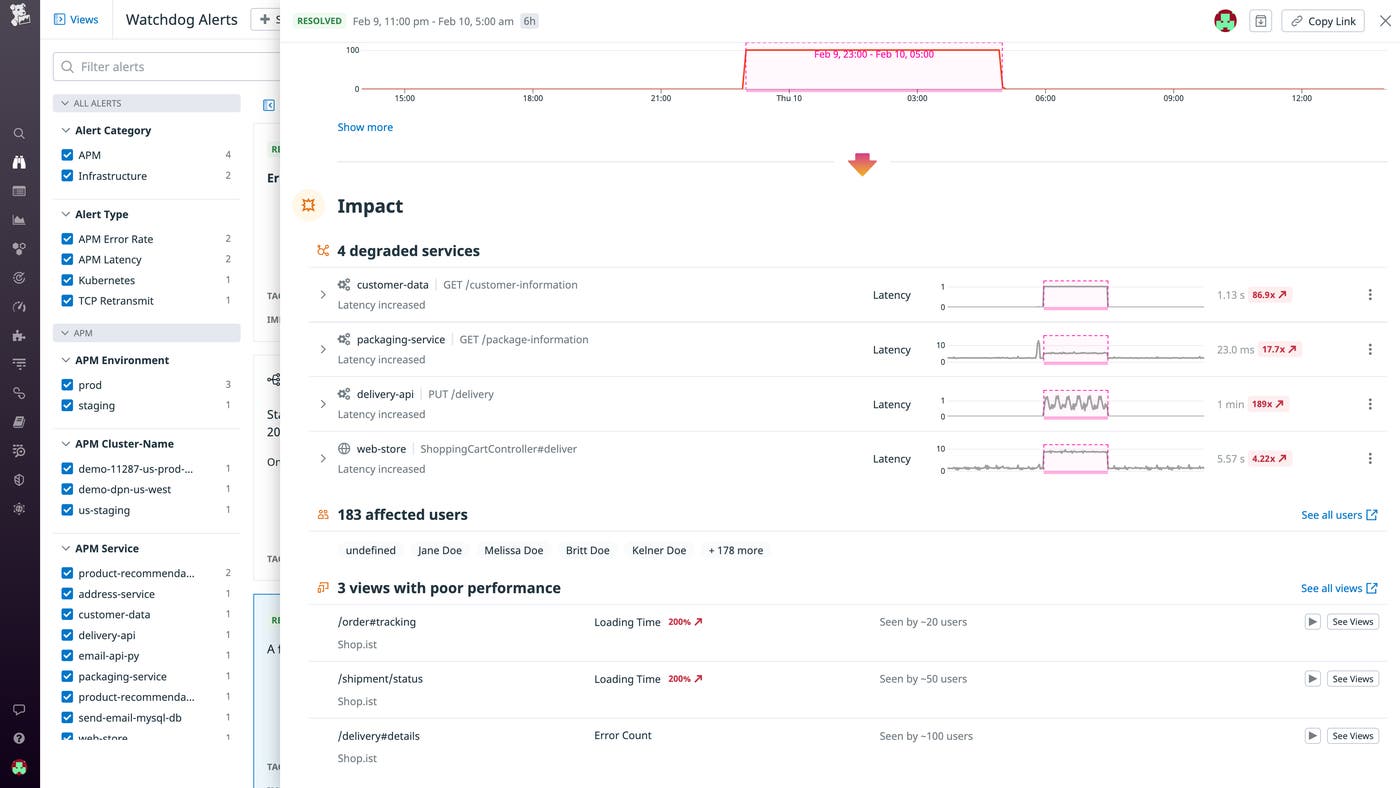
Additionally, Watchdog uses Real User Monitoring (RUM) metrics to identify views with elevated latency and error rates, and lets you easily pivot to Session Replay to see a playback of problematic user sessions. Replays remove the guesswork from bug reproduction, allowing you to jump straight to resolution.
Automate your root cause analysis
By observing your applications and infrastructure, Watchdog is able to automatically detect anomalies, group related anomalies across services, and, with the addition of Watchdog RCA, pinpoint the root cause. This capability allows you to resolve issues as quickly as possible in order to minimize their effect on your end-user experience. We're constantly working to incorporate more datasets into Watchdog RCA to give you root cause details for a wider set of issues, so stay tuned for more updates.
As you're investigating issues, you can also leverage Watchdog Insights, which highlights outliers in your application logs, traces, and RUM data–read our dedicated blog post to learn more. If you’re not already a Datadog customer, start exploring Datadog's machine learning capabilities today with a 14-day free trial.
