Renaud Boutet
Traditional logging solutions require teams to provision and pay for a daily volume of logs, which quickly becomes cost-prohibitive without some form of server-side or agent-level filtering. But filtering your logs before sending them inevitably leads to gaps in coverage, and often filters out valuable data. After all, logs constantly change in value based on factors that can’t be anticipated ahead of time, such as whether the log was generated during normal operations, or during an outage or deployment.
Datadog log management removes these limitations by decoupling log ingestion from indexing, which makes it possible to cost-effectively collect, process, and archive all your logs. We are pleased to announce that we’ve developed a set of features to help you take this new approach of Logging without Limits™. You can now:
- dynamically choose which logs to index and retain for troubleshooting and analytics (and override these filters as needed)
- archive enriched logs in your long-term cloud storage solution at no additional cost
- observe and query a Live Tail of all processed logs across your entire infrastructure (even the ones you choose not to index)
Ingest it all now, and filter later
Logging without Limits™ means that you no longer have to choose which logs to collect, and which logs to leave behind—you can cost-effectively collect them all. Our ingestion pipeline is built to handle cloud-scale volumes, so you can send terabytes of log data every day. And you can dynamically decide which logs are most useful to index. Indexed logs will be available for faceted search, dashboarding, and correlation with other sources of monitoring data, over your desired retention period (7 days, 15 days, etc.).
Unify your logs, metrics, and distributed traces with Datadog log management.
Index high-value logs when you need them
You can instantly override indexing and retention policies based on what’s happening in your infrastructure. For example, during an incident, you need maximum visibility for effective troubleshooting. Now you can start indexing relevant logs immediately in Datadog, instead of adjusting cumbersome server-side filtering policies.
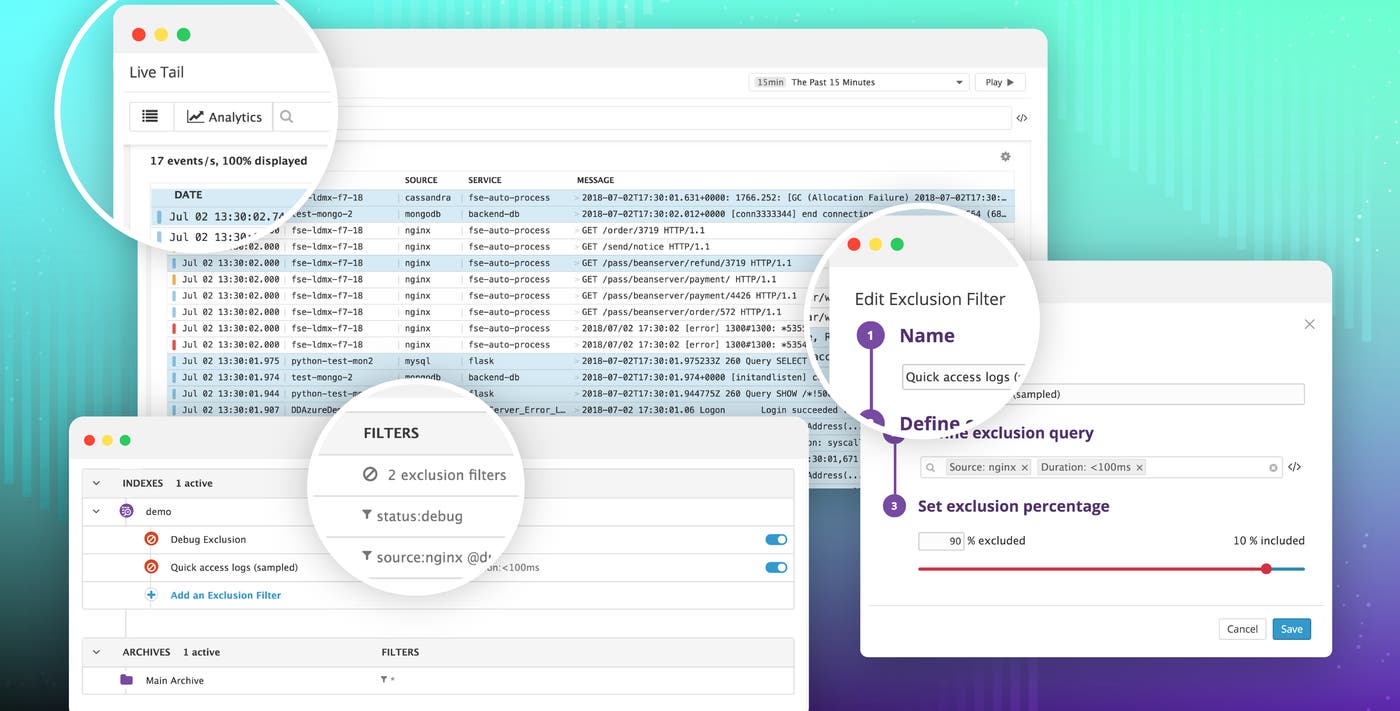
In the Log Processing Pipelines page of your Datadog account, you can add filters that set specific rules on which logs should be indexed, based on search queries that use attributes like status, service, or image_name. Below, you can see an example of a filter that excludes all logs with status:debug from indexing. If you’re in the middle of an outage, you can instantly disable this exclusion filter to get maximum visibility.

Fine-tune your indexing policies on the fly
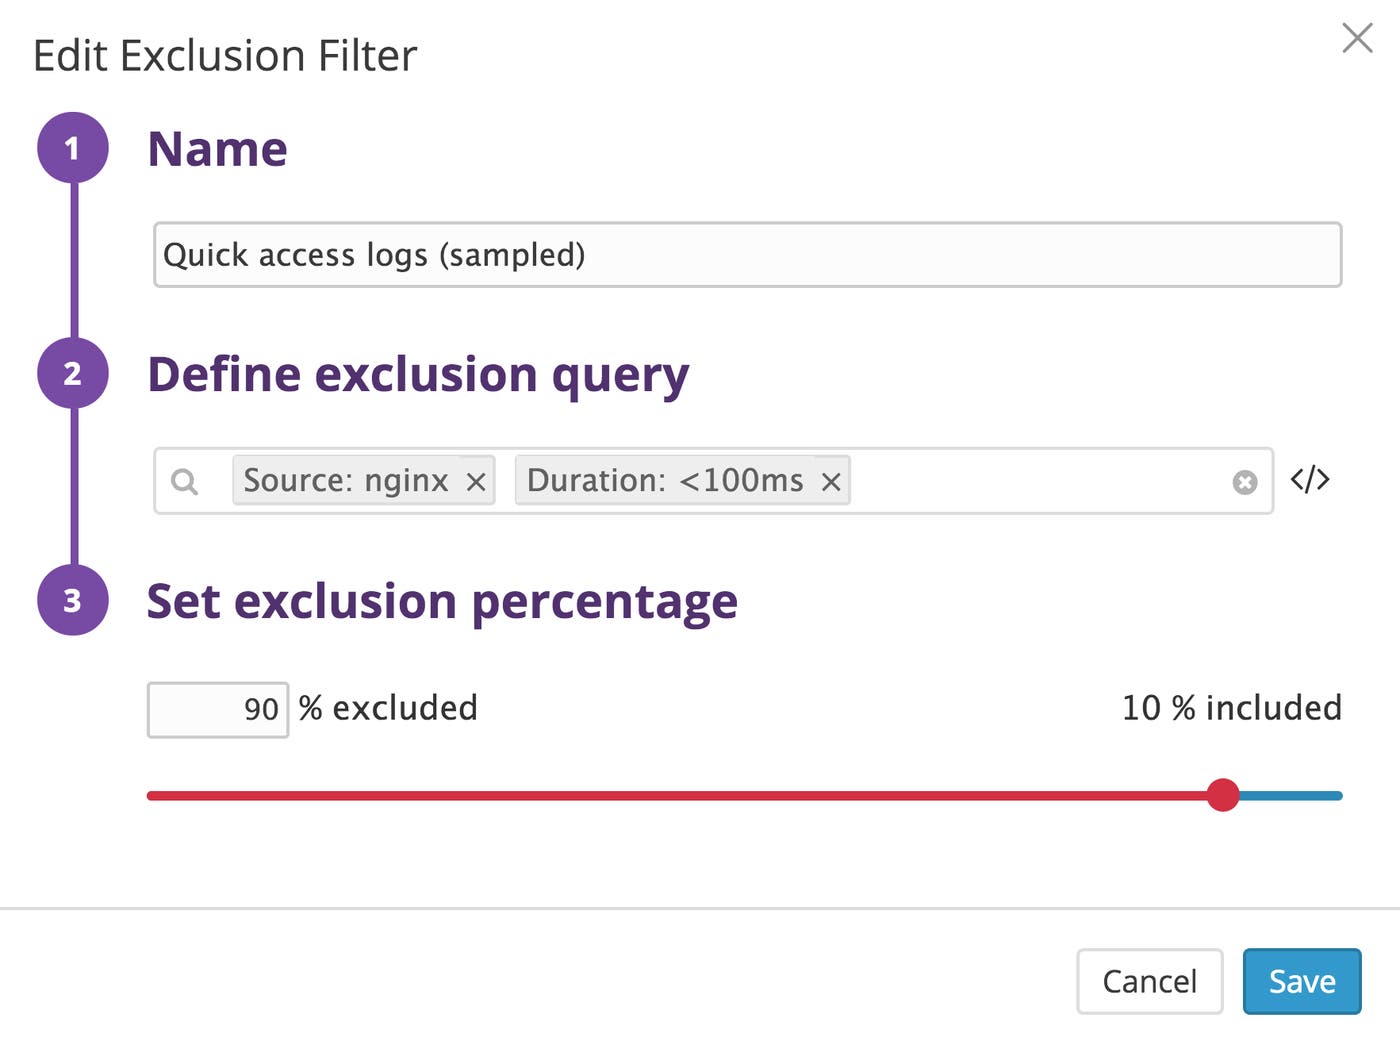
You can also control the sampling rate of any filter, which enables you to decrease the volume of logs you index, while still tracking the most important trends. The filter below will index 10 percent of NGINX access logs that had a response time of less than 100 milliseconds, and exclude the other 90 percent. By indexing just a subset of your logs, you can still analyze and gather insights without having to pay for the indexing and retention of the other 90 percent of your access logs.

Just as you can enable or disable exclusion filters on the fly, you can also instantly adjust the exclusion percentage of any filter to make sure you’re capturing enough information to help you investigate an issue. And if the number of generated logs increases based on seasonality (e.g., Black Friday), you can adjust the exclusion percentage to keep costs under control while still monitoring the logs that matter most.
Archive logs for auditing and compliance purposes
What happens to the logs that you don’t index? Ingested logs don’t get left behind on your servers—instead, they get routed to your own long-term cloud storage solution at no additional cost. This means that you can maintain a complete history of your company’s operations, which can be invaluable for auditing purposes.
In the Log Processing Pipelines page, you’ll see an Archives section, where you can set up Datadog to route logs to an Amazon S3 bucket (with support for other endpoints to come).

Observe a Live Tail of all your processed logs
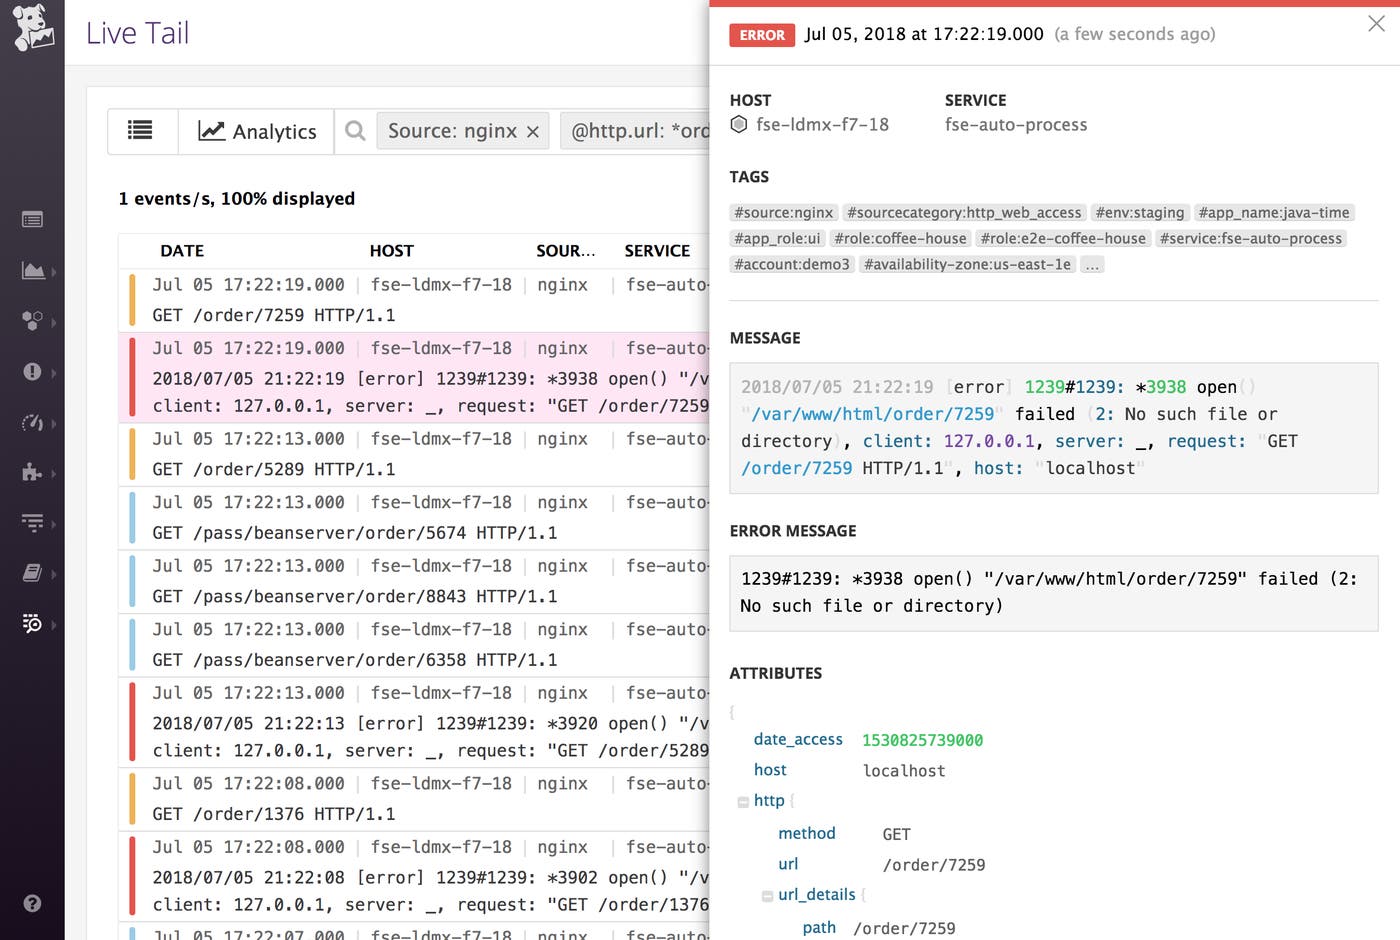
Live Tail provides another way to derive and leverage insights from your logs as they are collected from all your containers, servers, applications, and cloud services. Live Tail shows you a real-time stream of the logs you’re currently processing (even the ones you exclude from indexes)—no need to ssh into your servers one-by-one.
Like the Log Explorer, Live Tail shows your logs after they’ve been processed, which means that you can drill down to query for logs from specific hosts, services, or applications, or filter by any other meaningful log attribute (e.g., filename, HTTP method, etc.). You can use Live Tail to observe a deployment, tail new applications, or track user actions in real time, depending on your needs.
If you spot anything you’d like to view in more detail, simply pause the feed or click to inspect an individual log. To get even more context, you can navigate to related sources of monitoring data—such as host-level metrics or APM—with a single click.

Start Logging without Limits™
All these log management features are now generally available in Datadog. You can start using them today to ensure that you have access to all the logs you need for troubleshooting and debugging, while keeping your data-storage requirements under control. If you’re new to Datadog, and you’d like to monitor your logs, metrics, and distributed request traces in one fully integrated platform, you can start a 14-day free trial.


