Paul Gottschling
AWS Step Functions is a service that abstracts distributed applications into state machines, with each state representing a component of an application. Step functions give you flexibility to orchestrate complex workflows and implement effective retry and error handling behaviors. Not only does this automatically generate an architectural diagram of your application’s workflow, it also makes it straightforward to reorder your states as well as implement parallel execution, handle retries, and other tasks. Whether your states are AWS Lambda functions, Elastic Container Service tasks, or AI/ML models hosted on Amazon Bedrock, you can use AWS Step Functions to seamlessly coordinate your workloads.
Monitoring many millions of executions that may involve complex state transitions can get difficult to debug and optimize. To help overcome this challenge, Datadog provides native support for monitoring and tracing AWS Step Functions. You can use Datadog to monitor your state machines individually and alongside the rest of your infrastructure, drill down to a single execution to reveal any states that are slowing down performance, and easily correlate metrics with distributed trace data from your states and functions for insights into errors.
Deep visibility into the state of your states
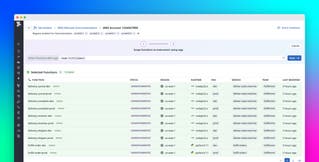
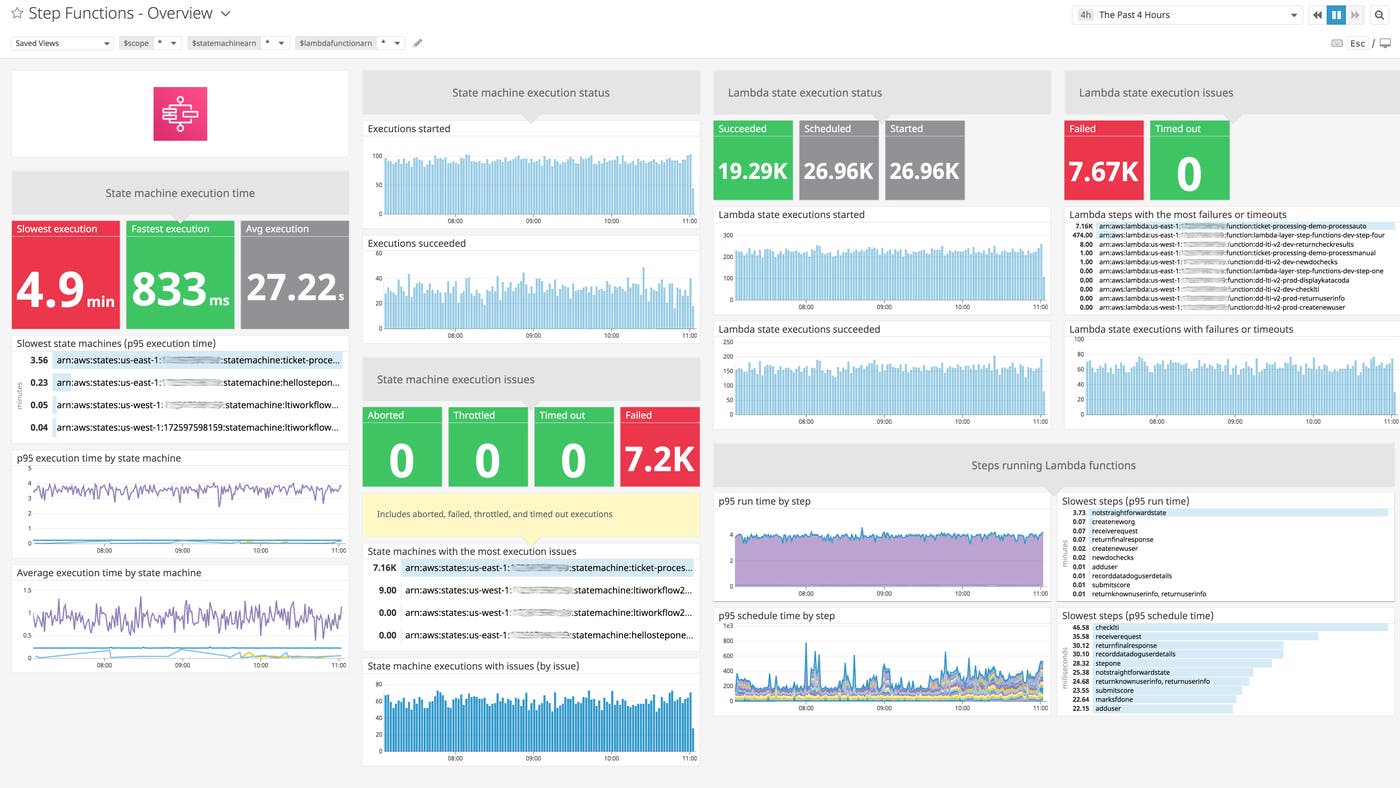
Datadog provides a bespoke monitoring experience for your Step Functions. You can get deep visibility into how all of your Step Functions are performing in the Serverless view. With summary graphs, you get a high-level overview of each state machine’s execution count, average duration, failures, and successful executions. To drill down and understand your state machine’s status better, you can open the side panel to view recent traced executions, enhanced metrics, error tracking and logs—all within a single, unified view.
When enhanced metrics are enabled, the serverless view will also surface state-level metrics such as state latency and show the summary in an aggregate map view to help you quickly determine the health of your Step Function. Datadog automatically tags metrics with the relevant step name, state machine name, and state machine ARN, making it straightforward to compare the performance of functions running as part of the same state machine.
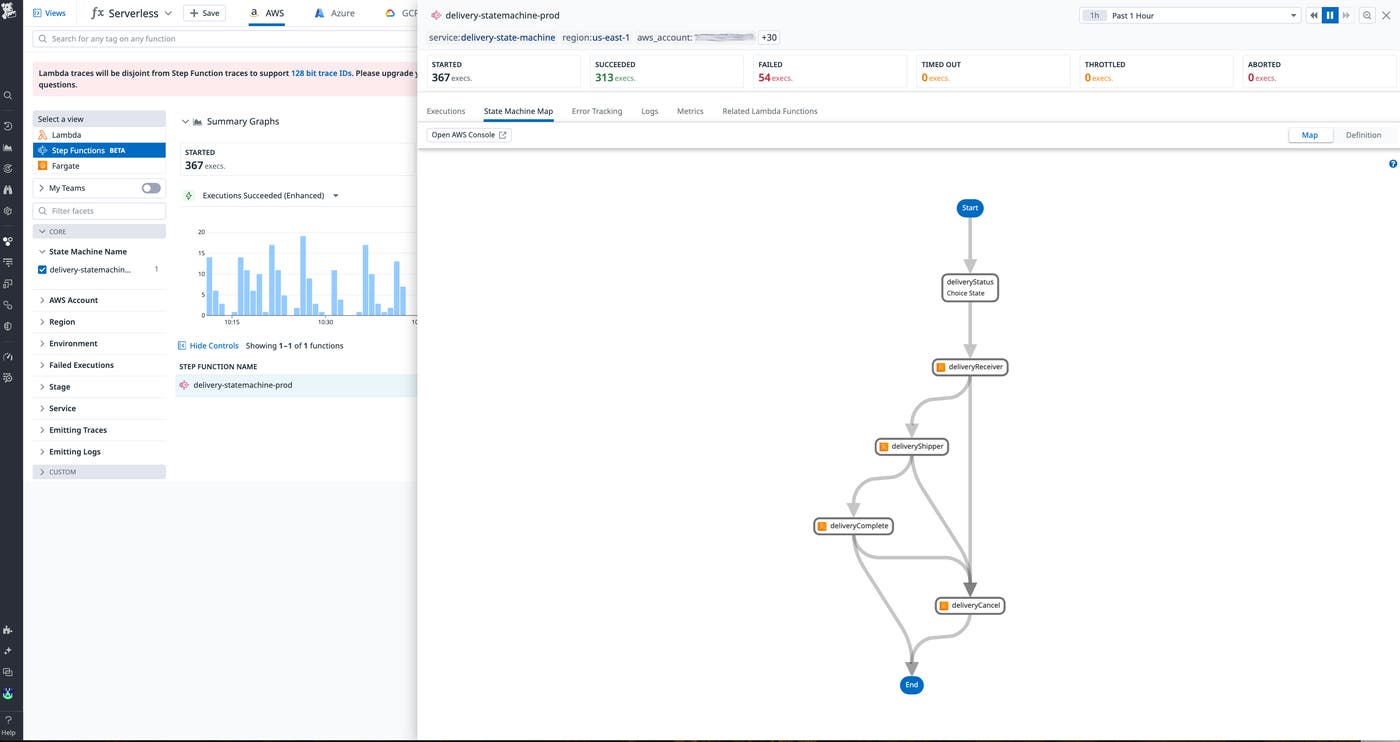
Datadog’s out-of-the-box customizable dashboards visualize key Step Function metrics. You can also instrument your Step Functions to get enhanced metrics generated by Datadog. This means that with Datadog, you can view a combination of high-level and state-level metrics such as the number of successful executions and execution latencies.
By cloning and customizing the out-of-the-box dashboard, you can use these tags to compare metrics from AWS Step Functions and AWS Lambda. If this dashboard shows rising state execution failures, it’s likely due to a similarly high volume of AWS Lambda errors rather than, for instance, a misconfigured IAM role. You can then use these same metrics to set alerts and notify your team when your state machines fail more frequently than expected or experience slower than normal execution times.
Drill down into each execution
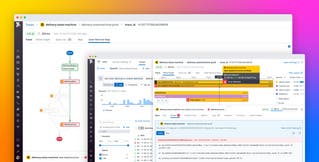
If your Step Functions states are failing or underperforming, you’ll want to find out as quickly as possible. Datadog supports native distributed tracing and APM for Step Functions. By tracing across an entire state machine, as shown in the screenshot below, you’re able to visualize how long each state ran for and whether any errors occurred while executing the workflow.
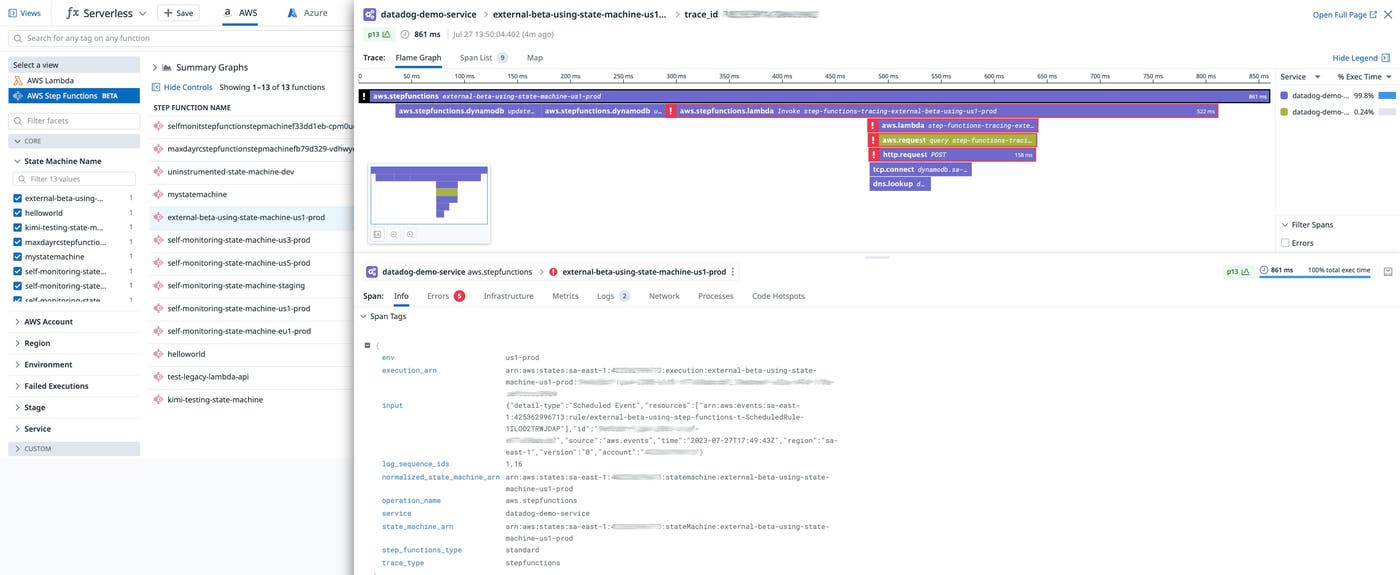
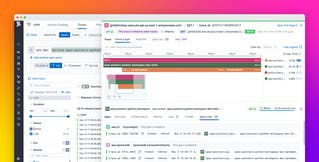
Datadog’s native tracing also gives you visibility into trace data from your Lambda functions themselves, including how long they take to execute and how often they return errors. And since your state machines might be processing events at a high volume—over 100,000 per second in the case of Express Workflows, for example—you’ll need a way to find the most relevant traces for your investigation.
Lambda orchestration monitoring
Since AWS Lambda functions process well-defined inputs into predictable outputs without maintaining data between invocations, they work particularly well as Step Functions states. Furthermore, when Step Functions are instrumented, Lambda functions that are invoked by the Step Function are automatically included in the flame graphs of Datadog serverless traces, giving you deep insight into issues that may be caused by bugs in Lambda code.
Stay proactive with your issues
AWS Step Functions gives you several ways to handle errors when executing steps, such as retrying an execution or passing the error to another state. Datadog’s AWS Step Functions integration helps you plan the most realistic error handling strategies for your state machines.
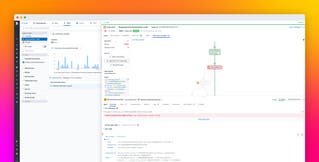
If something looks awry within an AWS Lambda function that is part of a Step Functions state machine—let’s say Watchdog has shown an increased error rate—you can explore your traces to get the context you need to start troubleshooting. From the Serverless view, just click the name of a Lambda function running as part of your state machine to see a list of traces—including any errors that Datadog discovers during execution. Once you know what kinds of errors your state machines are encountering, you can determine the best way to handle them.
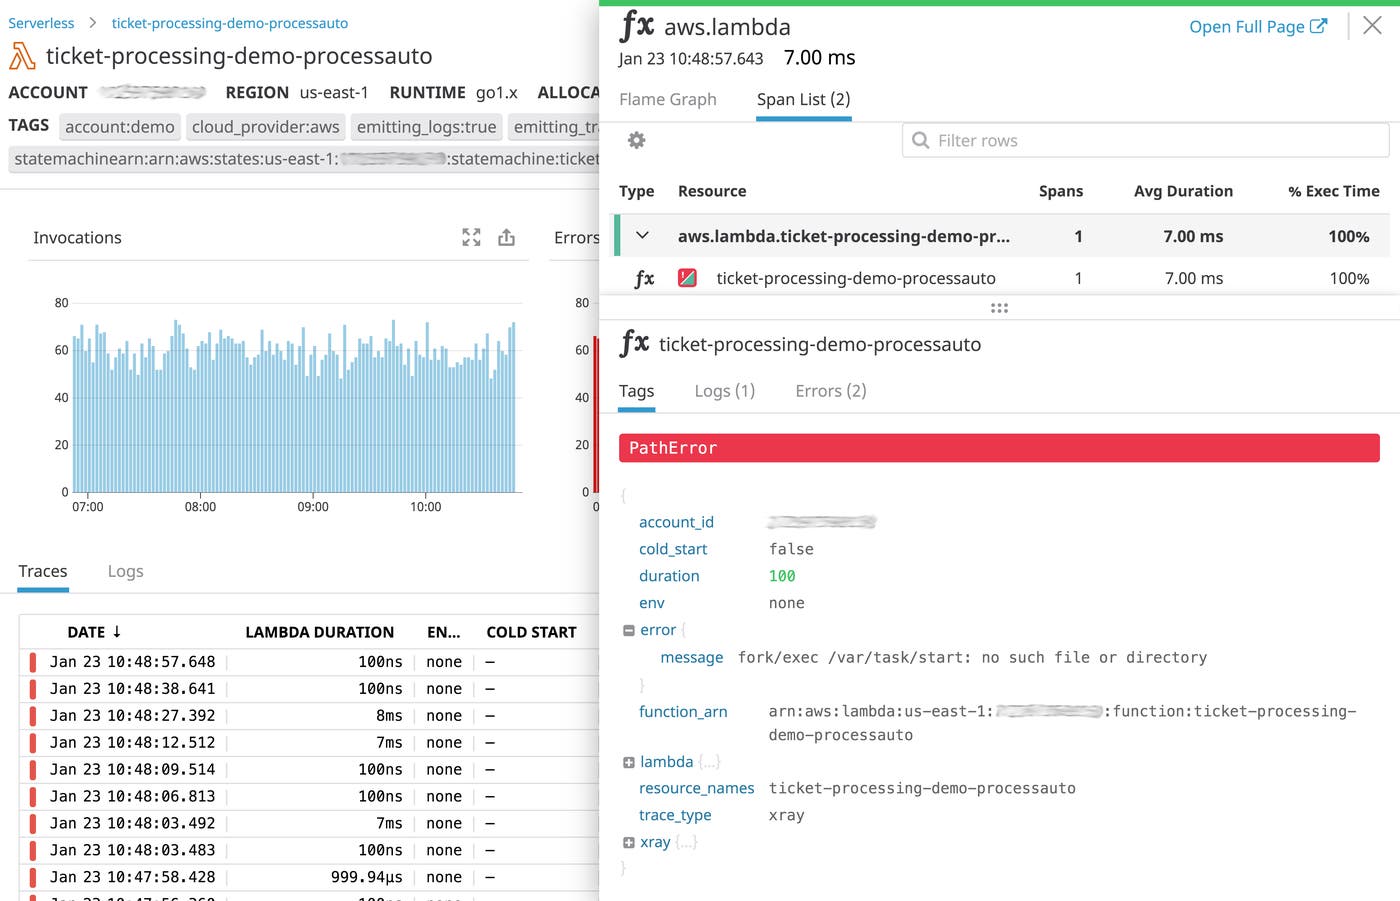
Failed executions for Step Functions sometimes need to be executed again. Retrying or redriving the Step Function using the same payload can be extremely useful when downstream services or APIs are temporarily unavailable or experience an intermittent failure. With Datadog, you can re-run or redrive your Step Functions directly from the Serverless app.
Full visibility, step by step
You can set up the AWS Step Functions integration and instrument them right from your Datadog account to get full visibility into your state machines. And since Datadog integrates with other AWS services you can run with Step Functions, like Amazon Simple Queue Service and Amazon SageMaker, you can inspect every state of your workflows, along with the rest of your infrastructure, in a single platform.
Don’t have a Datadog account yet? Sign up for a free trial.


