Digital Experience Monitoring | Datadog

Digital Experience Monitoring

Maersk logo

Thousands of customers love & trust Datadog

Get a single source of truth for frontend monitoring data

Companies have become increasingly reliant on web and mobile applications to meet their customers' needs, so it's important for them to proactively test key workflows and monitor real user sessions in order to deliver a consistent user experience. Other frontend monitoring solutions can help surface frontend issues, but they often require specialized knowledge of query languages and testing frameworks—and force users to pivot back and forth between tools throughout the troubleshooting process. These limitations make it difficult to assess an issue's context, onboard new team members, and collaborate with other stakeholders.

Datadog's Digital Experience Monitoring suite, which includes Real User Monitoring (RUM), Synthetic Monitoring, and Error Tracking, provides a single source of truth for frontend monitoring data, so teams can better understand user activity and troubleshoot frontend issues as efficiently as possible.

Run synthetic tests against different environments, devices, browsers, and locations

The agile development methodology enables teams to release new features quickly, but it also makes it harder for them to create and maintain tests that reliably detect regressions. With Datadog Synthetic Monitoring, teams can create scalable browser and API tests that can be executed in any environment, including CI pipelines. This enables them to catch issues such as slow response times, elevated error rates, and broken endpoints earlier in the development process—and prevent breaking changes from reaching production.

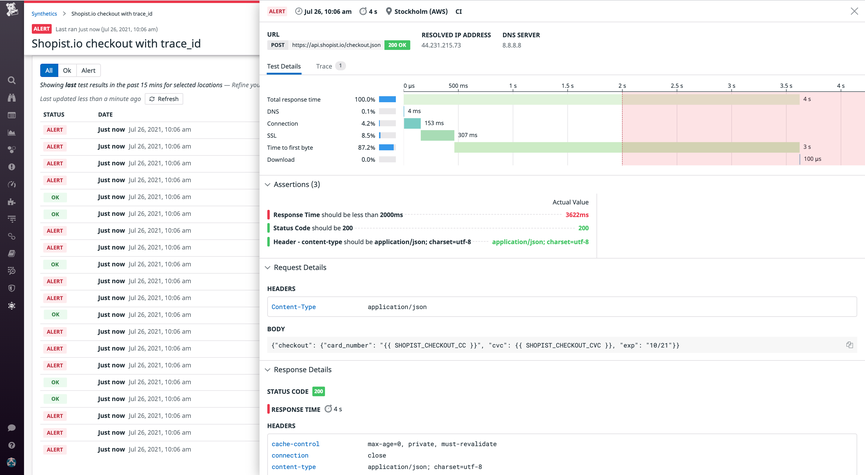
View detailed breakdowns of Synthetic test results.

Teams can use Datadog's code-free web recorder to create Synthetic browser tests, which simulate key user journeys across different browsers and devices while automatically updating in response to unrelated UI changes. They can also leverage API tests to proactively monitor endpoints on different network layers—and chain these tests together to validate key workflows from end to end. All Synthetic tests can be run on a range of managed and private locations, so teams can be sure their internal and public-facing applications are working as expected for users around the globe.

Eliminate data silos for improved UX collaboration

Real user data can help teams across an organization make informed decisions, but data silos in traditional tools can make it difficult to determine, for example, why users are abandoning their carts or struggling to navigate through an application. Datadog RUM enables developers, designers, marketers, and product managers to access the same user data, so they can monitor their applications' frontend performance holistically and collaborate on UX improvements.

For instance, Engineering and QA teams can alert on error rates, load times, or Core Web Vitals, and they can use tags such as country and device to determine which users are affected by particular issues. Meanwhile, Support and Design teams can leverage Session Replay to view video-like re-creations of user sessions, which enables them to identify the exact user actions that triggered errors. Product and Marketing teams can also analyze product usage through custom metrics, such as number of items sold, to advance business objectives and prioritize future initiatives.

Prioritize issues based on severity, frequency, and scope

Modern environments can generate thousands of errors in rapid succession, and these errors can affect users differently depending on their browser, location, and device. This makes it difficult for teams to assess the scale and impact of issues in order to prioritize their resolution. Datadog Error Tracking extracts error events from RUM data and automatically groups related errors into context-rich issues, which can be filtered by tags and facets such as service, environment, and application version. Users can also monitor each error's frequency in order to gauge its severity and appropriately prioritize its resolution. This enables engineers to triage and investigate more efficiently so they can focus their bandwidth on building new features and optimizing their applications.

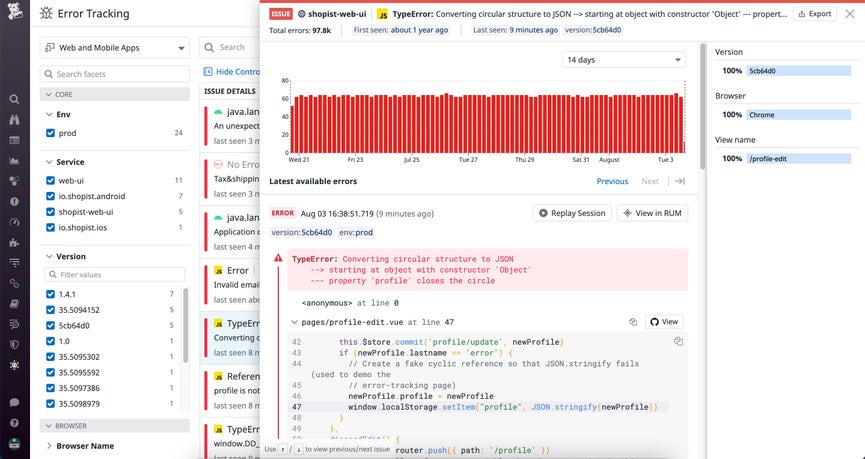
View error details with Datadog Error Tracking.

Reduce MTTD and MTTR with full-stack visibility

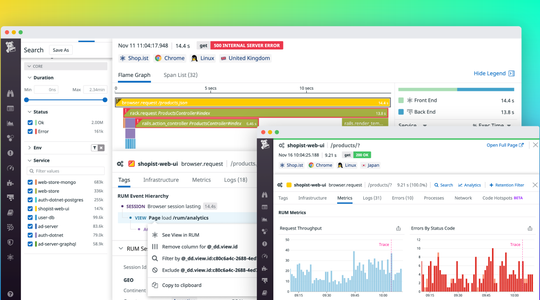
Frontend errors and high latency can impact retention, churn rates, conversions, and revenue, but it can be challenging to pinpoint the source of these problems without a solution that provides full-stack visibility. Datadog unifies Application Performance Monitoring (APM) with Synthetic Monitoring and Real User Monitoring (RUM) to facilitate seamless, two-way correlation between frontend user sessions, synthetic test runs, and backend traces. This allows teams to troubleshoot with context so they can identify which part of the stack is responsible for user-facing issues. For instance, if a user sees a spike in their application's load time, they can pivot to related traces in a single click in order to pinpoint the exact source of the bottleneck. Traces are also automatically linked to relevant logs, which provide more granular insight into what occurred at each stage of a request.

Our DevOps and SRE teams use the Datadog RUM to APM connection to visualize the full user journey and pinpoint the exact source of an errant or slow customer request. The automatic correlation of the frontend and backend enables our teams to communicate using the same language when resolving errors across the stack.

Ronni Persson
Engineering Manager, Web Platform Team, SeatGeek
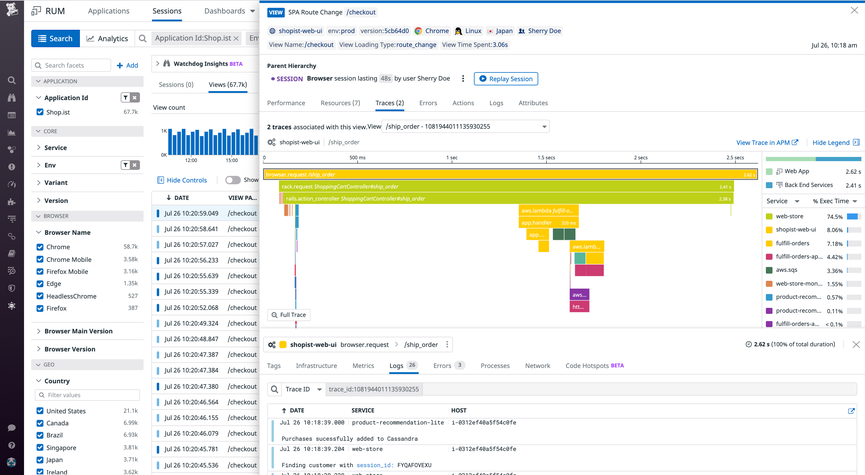
An end-to-end trace from a single user session that includes a breakdown of frontend and backend latency.