Anjali Thatte
Product Manager

Mallory Mooney
NVIDIA is well known for its computing advancements across a broad range of industries and has become the clear leader in the artificial intelligence (AI) space. Due to their high-performance capabilities, NVIDIA's discrete graphics processing units (GPUs) now account for approximately 80 percent of the market share for production-level AI, gaming, graphics rendering, and other complex data processing tasks. In these environments, GPUs are required because of their ability to handle parallel computing, which CPUs alone cannot do effectively. With the rapidly growing popularity of AI-based applications, and NVIDIA's role in supporting them at scale, an increasing number of organizations need to efficiently monitor NVIDIA's GPU performance alongside the rest of their AI stack.
As part of our ongoing commitment to providing our customers with increased visibility into the layers of their AI stack, we're excited to announce our integration with NVIDIA Data Center GPU Manager (DCGM) Exporter, a suite of diagnostic and management tools for monitoring GPUs in high-performance environments. Now, organizations can use Datadog to seamlessly collect metrics exposed by the DCGM Exporter from widely used GPU architectures, such as NVIDIA's Tesla, A100, and Kepler series. This capability enables you to monitor the performance of all your GPU workloads in a single platform, regardless of whether they are containerized, hosted locally, or deployed in the cloud. And because collected telemetry is deeply integrated with the rest of the Datadog platform, organizations can correlate GPU performance and usage with other critical parts of their AI stack.
In this post, we'll show you how you can use our integration to:
Visualize the health of your GPUs
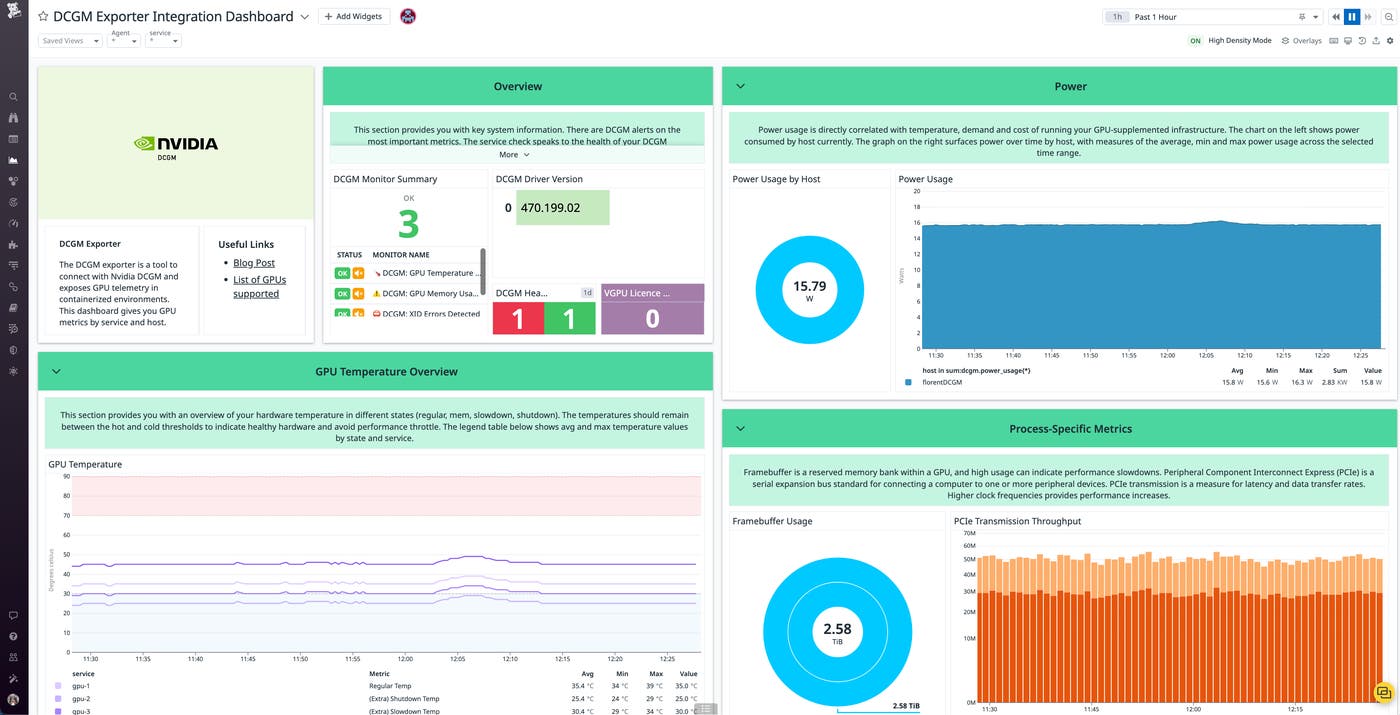
NVIDIA GPUs power a wide variety of resource-intensive applications, so it's important to have comprehensive visibility into each GPU instance to ensure that it is supporting workloads efficiently. Our integration offers an extensive collection of GPU utilization, performance, and process-specific metrics that you can easily customize based on your specific telemetry needs. We also provide an out-of-the box dashboard and multiple monitors to help you track these metrics alongside trends in overall performance.

With the dashboard, you can review key GPU metrics like temperature, power consumption, and framebuffer usage to better understand the state of your AI stack. You can also track the status of our integration's out-of-the-box recommended monitors, which will automatically notify you of critical performance issues like increased memory utilization or a high number of XID errors. This visibility enables you to quickly determine how to best optimize inefficient AI workloads.
Identify the source of bottlenecks in GPU resources
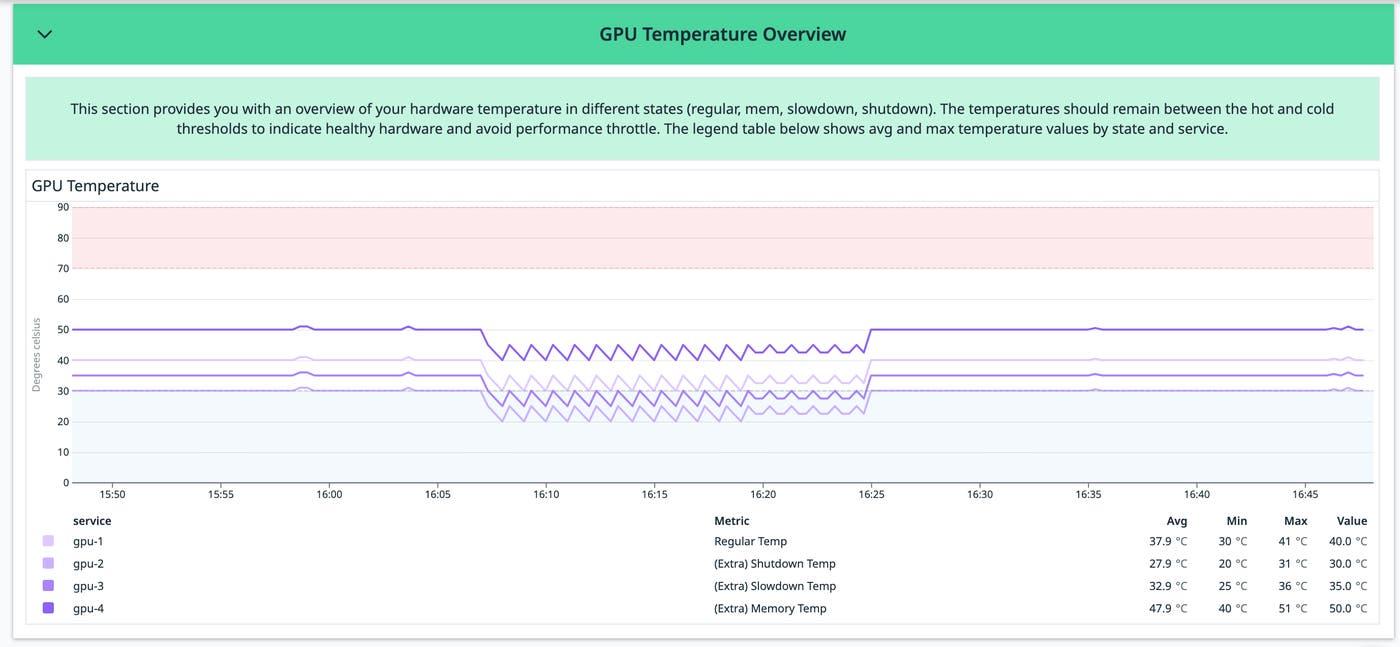
Training AI models requires substantial computing power from GPUs, and it can quickly increase hardware temperatures—a crucial indicator of GPU health and performance. Monitoring GPU temperature can help you ensure that your workloads are not overloading your hardware during these types of high-compute tasks, which can lead to performance throttle and hardware burnout.
For example, one of our integration's customizable monitors will automatically notify you when a GPU's temperature exceeds the safety threshold of 85 degrees Celsius. You can then use the dashboard's GPU Temperature Overview section to determine if the issue is due to an isolated spike or a gradual increase in hardware temperature over time.

Comparing this data with other key performance metrics like memory utilization can help you pinpoint the exact cause of the issue. For example, a sudden spike in GPU temperature could indicate a hardware malfunction, such as a broken fan. A gradual increase in both temperature and memory utilization, on the other hand, could be the result of an exceedingly demanding workload that the GPU is struggling to keep up with.
Track GPU power usage to manage costs
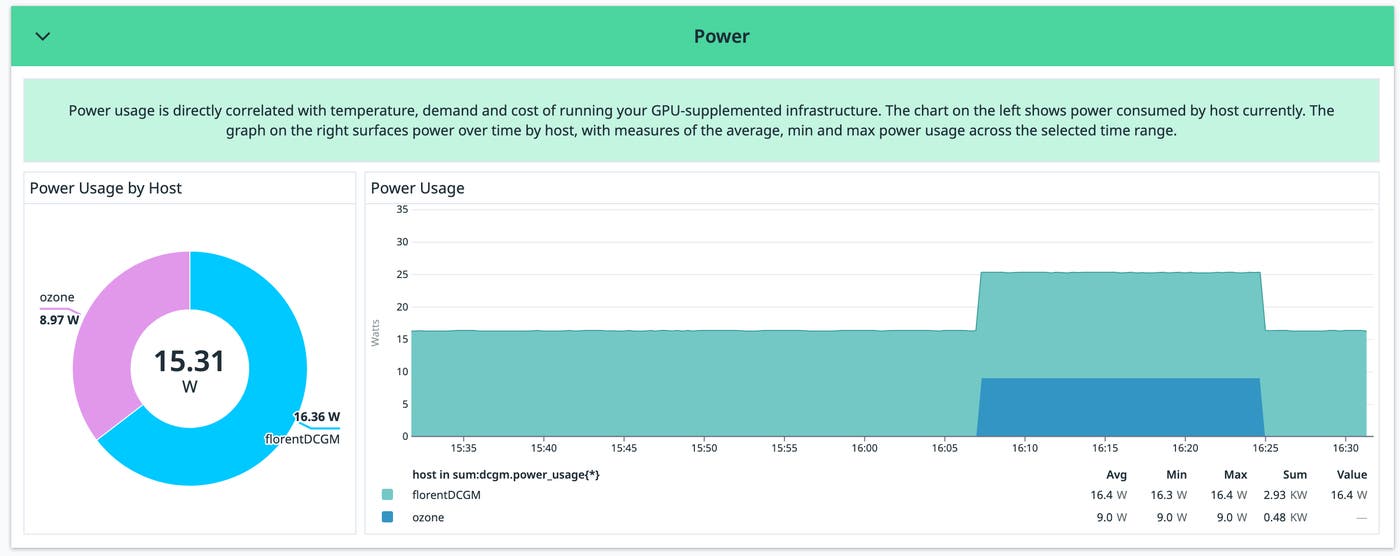
Since AI workloads require extensive GPU processing power, monitoring their usage can help you make sure your hardware remains performant and cost effective. For example, a GPU's power usage measures the number of watts it is consuming to process information. A consistently higher-than-normal wattage could indicate that an AI workload is processing more data than the GPU can handle in the long term. This not only affects GPU health but can also increase the overall costs of running your AI workloads.
You can use the integration dashboard to visualize how much power a GPU is consuming over time and quickly identify times when it's using consistently higher wattage. Then you can correlate this data with any other processes running during that time period for better troubleshooting.

If a particular GPU is consuming a significant amount of power, you may need to optimize its AI workloads. For example, lowering the batch size for a model's training data or leveraging liquid-cooling architectures can help reduce power consumption.
Start monitoring your GPU-powered workloads
Datadog's integration with the NVIDIA DCGM Exporter enables organizations to collect, monitor, and alert on metrics from their NVIDIA GPU resources. And since collected telemetry is deeply integrated with the rest of the Datadog platform, teams can easily correlate performance and usage with other technologies that support AI—including large language models (LLM)—use cases.
Our DCGM check will be included with version 7.47+ of the Datadog Agent, which will collect telemetry exposed by the DCGM Exporter's container. We also offer templates to help you configure both the Agent and the Exporter to collect critical metrics from your environment. For more details, check out our documentation for monitoring GPU metrics. If you don't already have a Datadog account, you can sign up for a free 14-day trial today.

