
David M. Lentz

Addie Beach
Technical Content Writer
Real user monitoring (RUM) helps frontend and mobile engineers measure, monitor, and troubleshoot the performance and availability of their user experiences (UXs). Slow page load times and crashes lead to customer churn, fewer ad impressions, and abandoned shopping carts. By giving engineers visibility into real-time user metrics and key application events like errors and network calls, RUM helps teams identify and address these critical issues.
Datadog RUM collects in-depth user data from every part of your app, then enriches it with global context and code-level insights. RUM organizes that data into easy-to-parse visualizations that help you quickly evaluate health, performance, and UX. RUM works alongside the rest of your observability data—including backend traces, session replays, and end-to-end synthetic tests—to provide additional visibility into the health and performance of your services.
In this post, we’ll explore how Datadog RUM helps you:
Analyze broadly and investigate deeply through RUM without Limits™
Troubleshoot frontend and mobile issues with user-level session data
Analyze broadly and investigate deeply through RUM without Limits™
The foundation of Datadog RUM is RUM without Limits™. Many developers use fixed sampling rates to keep data costs low, but these samples can miss critical errors or performance regressions.
Datadog RUM without Limits™ decouples sampling from ingestion, enabling you to collect all real-time user data from your app and selectively retain the most meaningful sessions for deeper investigations. By gathering over 30 metrics from your browser and mobile user sessions before samples are extracted or filters are applied, RUM without Limits™ helps you identify trends across your app and create accurate monitors, SLOs, and dashboards. Then, you can use dynamic filters to keep full session context only when meaningful criteria apply, such as poor Core Web Vitals, login errors, or activity from important user segments.
We’ll take a greater look at what you can do with this data in the rest of the post.
Understand user experience across your entire app
Users form opinions of your app in as little as 50 milliseconds and won’t hesitate to abandon slow or bug-filled flows. To retain users, you need to optimize performance from the earliest interactions to the last.
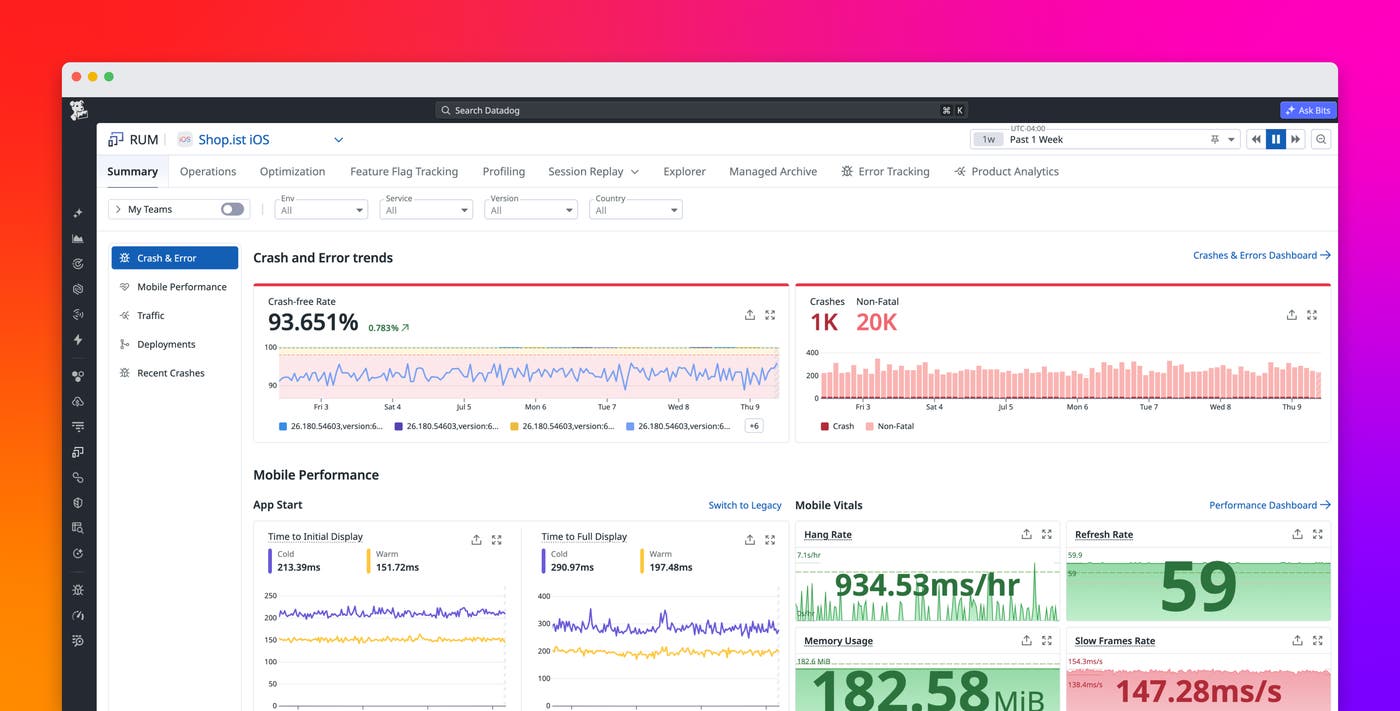
With the Performance Summary page in Datadog RUM, you can understand the availability and performance of your entire app at a glance. RUM automatically tailors the metrics in your Performance Summary page depending on whether you’re analyzing a browser app or a mobile app. Thanks to RUM without Limits™, these metrics are based on every user session across your app.
For web apps, the metrics you’ll see include the Core Web Vitals (CWVs)—Largest Contentful Paint (LCP), Interaction to Next Paint (INP), and Cumulative Layout Shift (CLS)—as well as FCP and loading time. This data shows you how quickly and smoothly your users are able to interact with your app. The Performance Summary page provides you with a color-coded overview of these metrics for every page in your app, which helps you immediately determine where improvements may be needed.
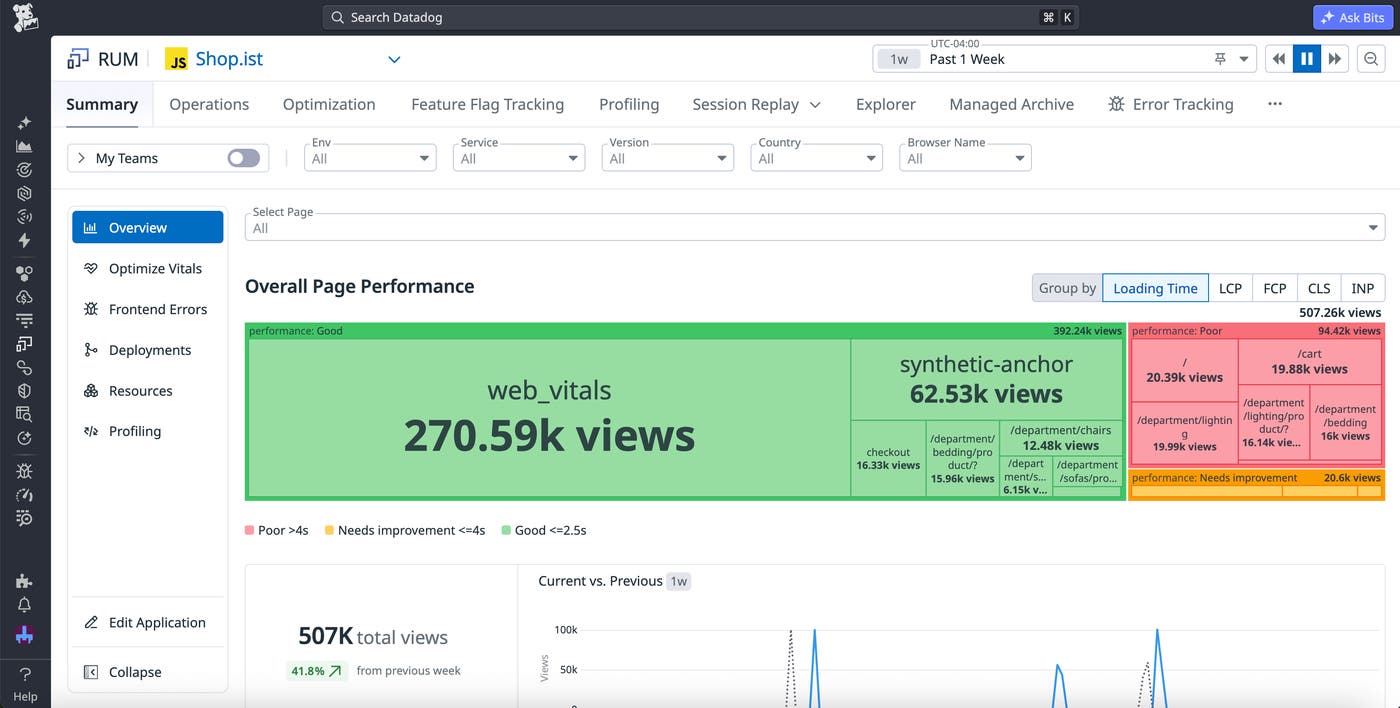
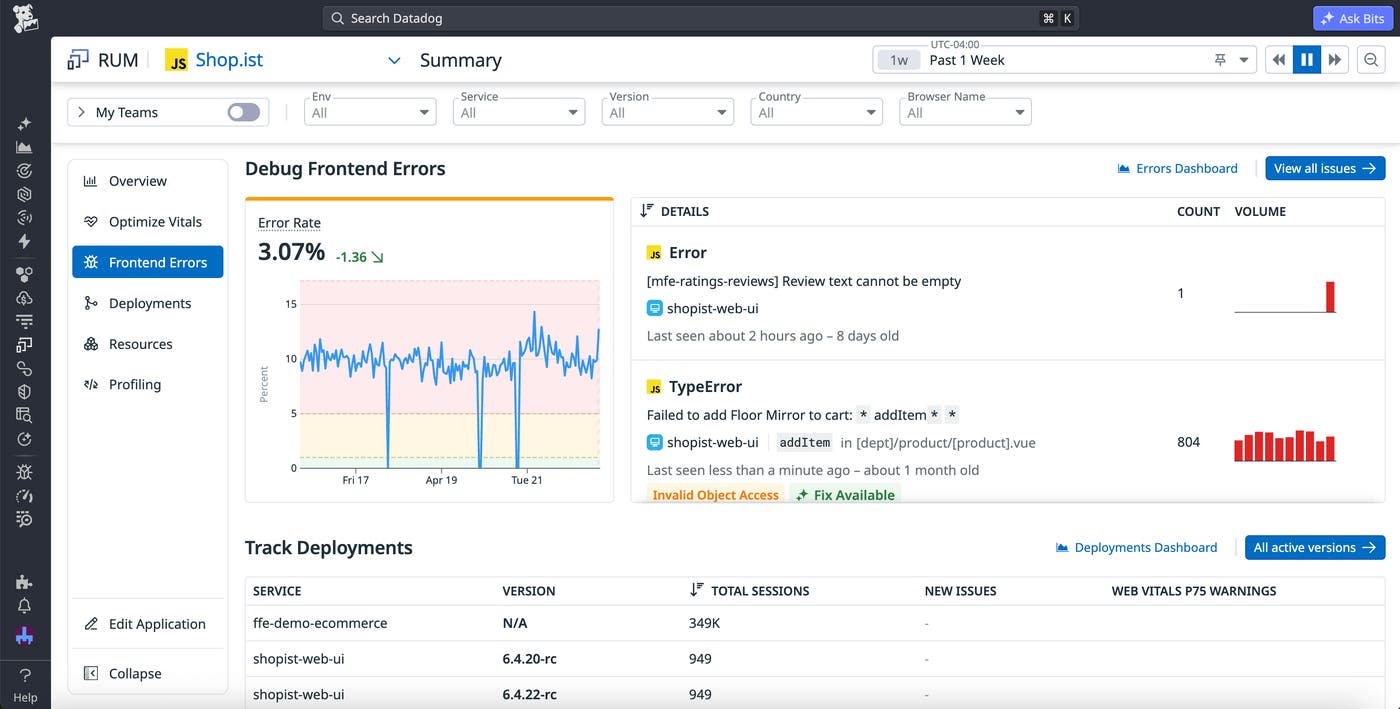
The page also comes with a list of recent errors, deployments, and slow functions, so you can pivot straight to troubleshooting concerning performance trends.
For mobile apps, reducing crashes and startup times is critical to preventing app uninstalls. The Performance Summary page tracks changes in crash-free sessions, fatal crashes, Time to Initial Display (TTID), and Time to Full Display (TTFD) so you can understand trends at a glance. The page also highlights mobile vitals that can impact the quality of your users’ interactions, including the refresh rate, slow frame rate, and rate of application not responding (ANR) errors.
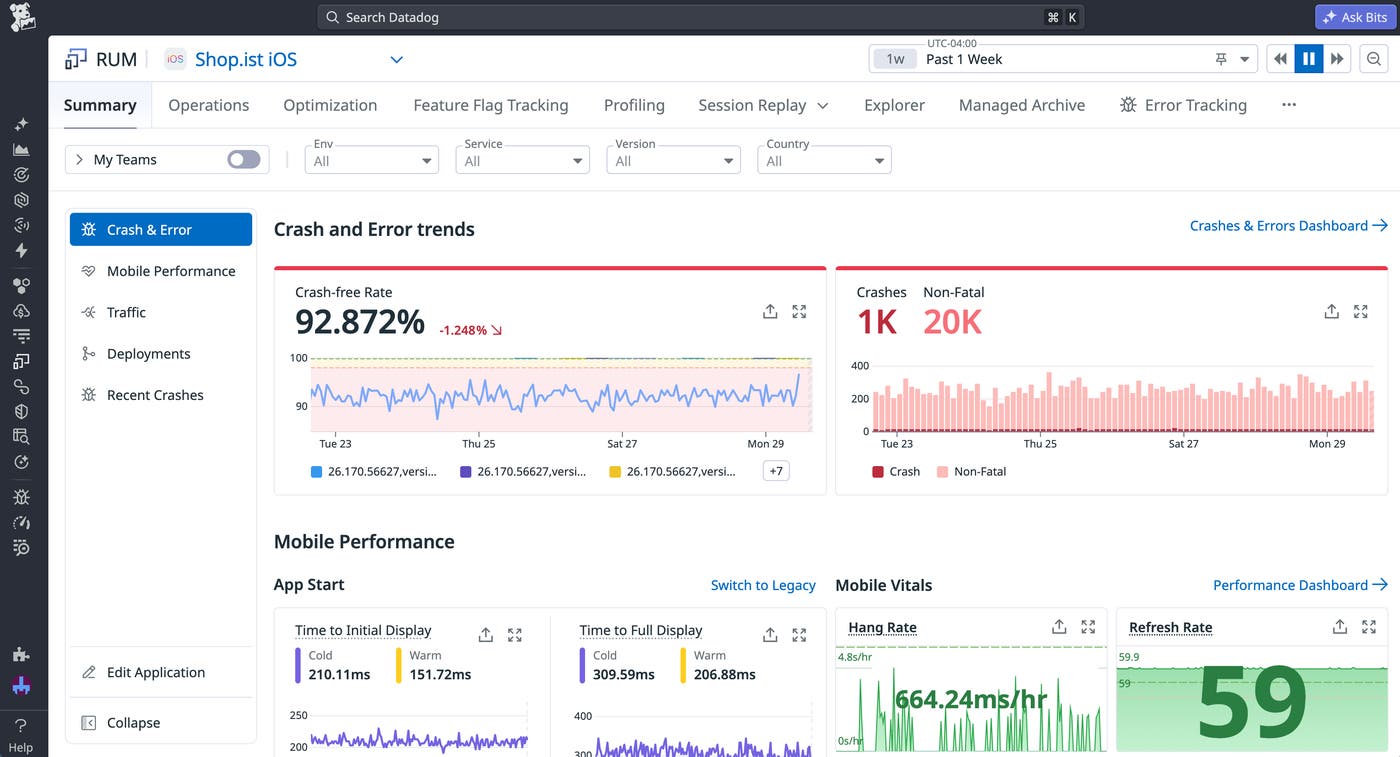
As with the browser version, the mobile Performance Summary page includes diagnostic information like version tracking and a list of recent fatal errors to help you debug. You can access all of these metrics for Android and iOS devices, as well as for cross-platform frameworks like Flutter and React Native.
Troubleshoot frontend and mobile issues with user-level session data
When troubleshooting issues in web and mobile apps, every piece of data can be critical, including how long users spent on a view, what device or browser they accessed your app through, and what errors or network requests occurred during their session. Combing through all of these data points to find the most relevant information for a project or investigation can be challenging, though.
Datadog RUM organizes view data, including user actions, errors, frustration signals, and resource loads, into visualizations that help you understand app performance. First, RUM creates sessions that contain all of the successive data for a single user visit. RUM enhances these sessions with attributes that give you context about the session, including the country, app version, and browser or OS involved.
You can access step-by-step breakdowns of each session in RUM Explorer, filtering on attributes or RUM events to find the most relevant data. These breakdowns enable you to answer troubleshooting questions, such as what events are causing your mobile app to crash.
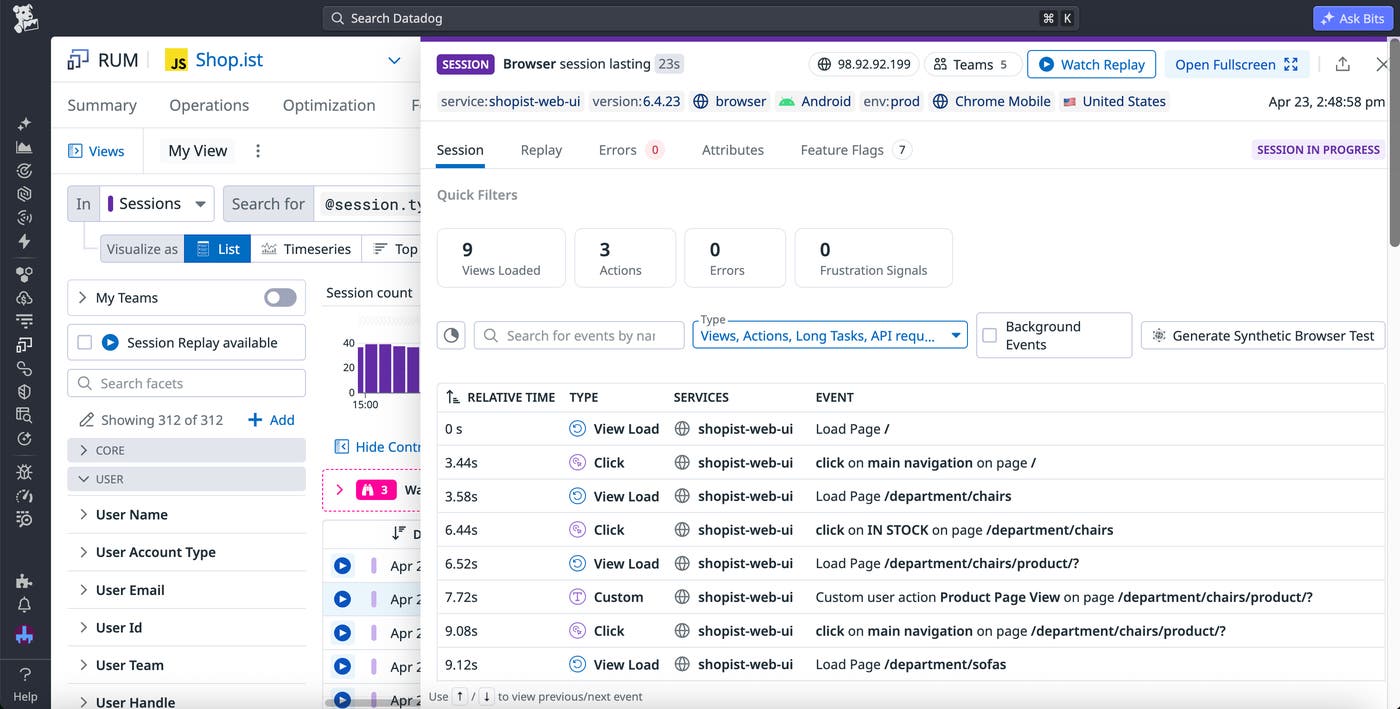
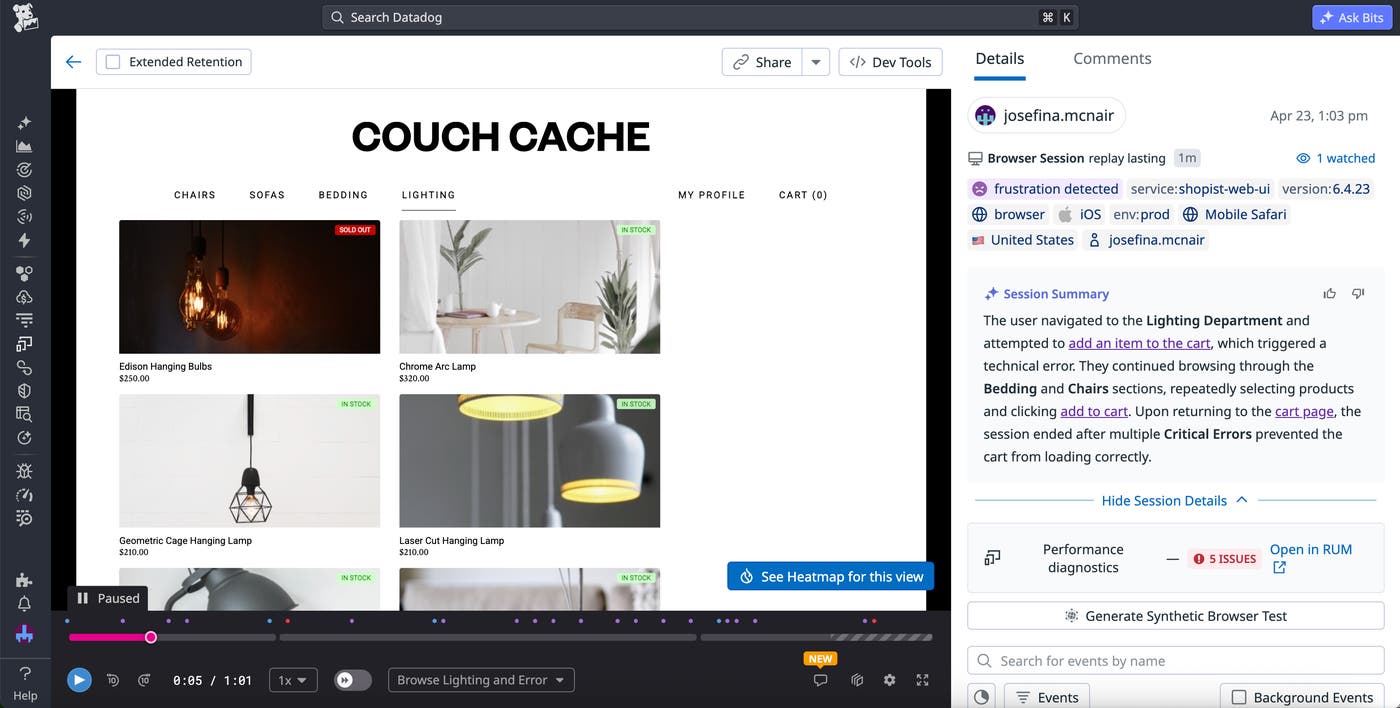
As you troubleshoot, you can view video-like reproductions of every user session within Session Replay to help you recreate the exact behaviors and steps that occurred. You can sort and filter session replays by facets like the views users accessed, the actions they took, and the number of errors or frustration signals they encountered. You can also pivot directly to a specific user’s session if, for example, you want to recreate a bug report. Once you open a replay, you can skip directly to key moments using the timeline.
Identify and prioritize performance issues for optimization
Knowing which parts of your app are performing poorly is the first step toward optimization, but without proper prioritization, you risk wasting time improving features that users barely interact with. RUM comes with several features that help you determine which areas of your app need your attention the most.
First, to understand which performance issues or errors are having the greatest impact on both your UX and business goals, you can use Operations Monitoring, currently in Preview. Operations represent critical steps within larger features or workflows, such as entering login information, starting a new social media post, or signing up for a newsletter. With RUM without Limits™, you can retain sessions that experienced failed operations for granular troubleshooting.
If a monitor alerts you to a breached SLO for one of your operations, you can jump straight to an overview page that lists troubleshooting information across all of the involved views.
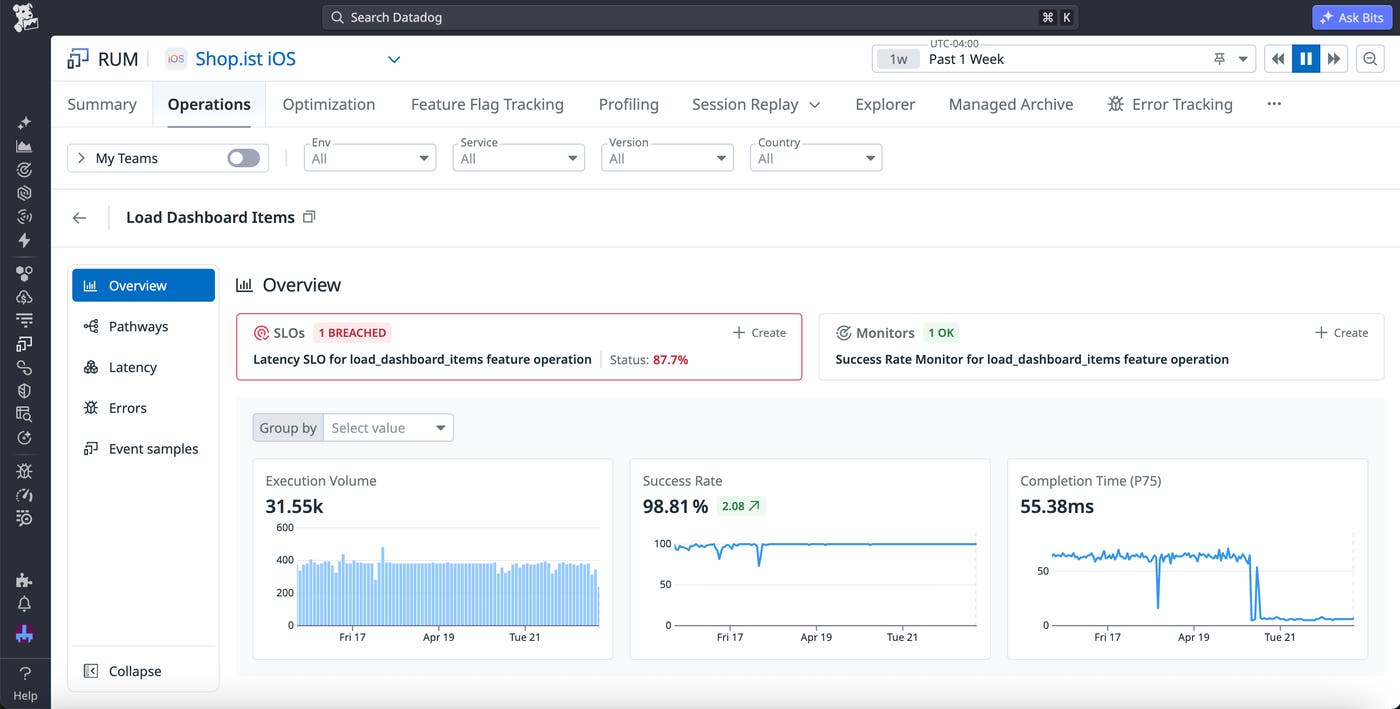
For each operation, you can access Pathways diagrams that clearly display success rates, lists of slow requests and assets, and collections of recent errors.
If you see a view with a high drop-off rate that you want to investigate, you can then navigate to the Optimization feature. For each view in your app, the Optimization page lists key metrics that help you quickly evaluate performance. For web apps, these include the CWVs, FCP, and the overall loading time, while mobile apps use TTID and TTFD across cold and warm starts. The Optimization page ranks views according to popularity by default, helping you quickly determine which of your poorly performing views have the greatest impact on UX. For deeper troubleshooting, you can select any metric to access a detailed overview of the factors that contributed to a view’s score. For example, the Optimization page includes elements that could present good opportunities for optimization—such as the largest rendered element for LCP—as well as an event waterfall that highlights long tasks that delayed requests in your app.
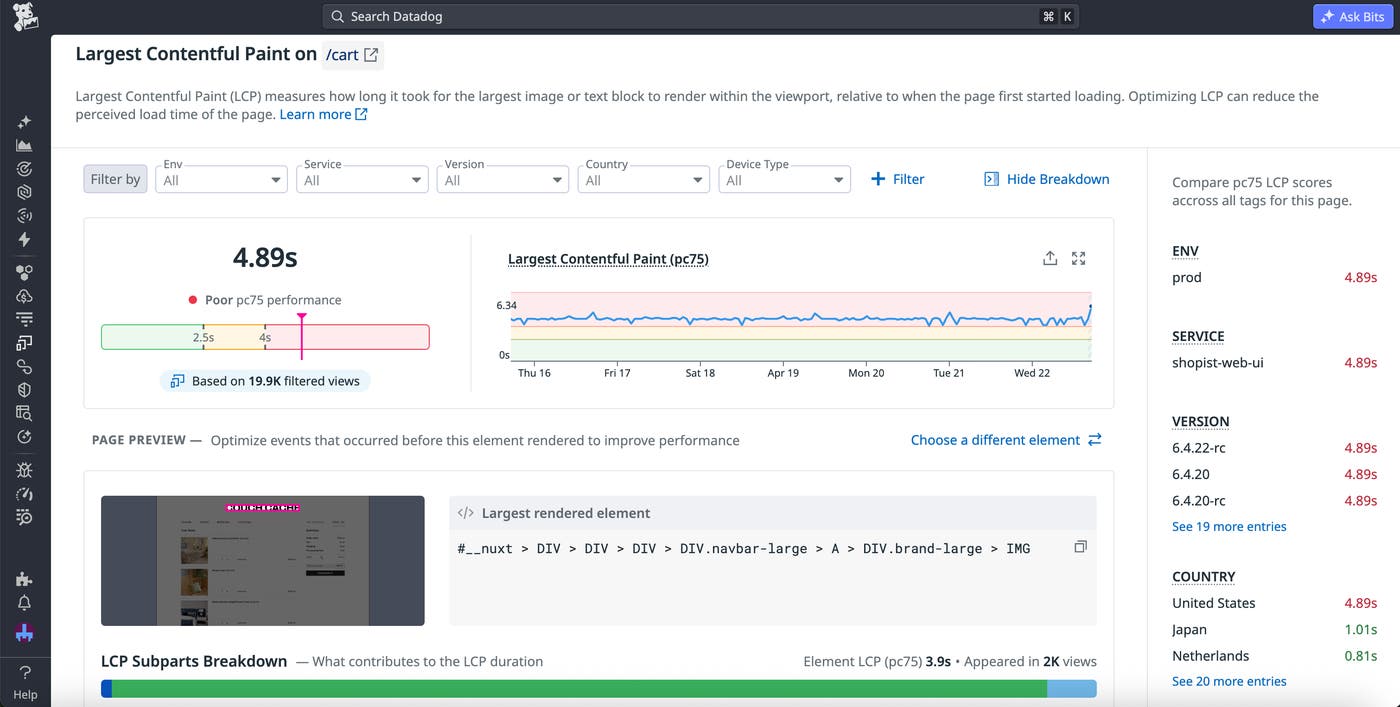
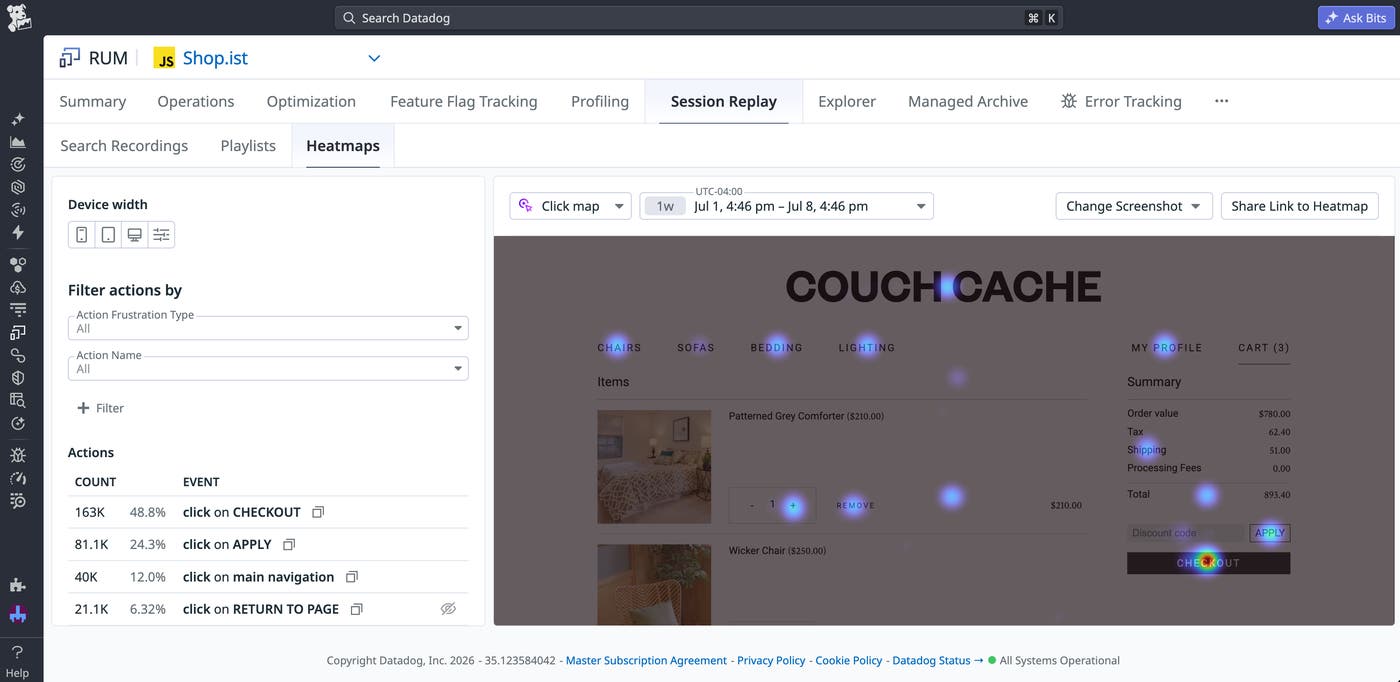
From the Optimization page, you can jump to a session replay or heatmap to see how technical issues are impacting user activity. Heatmaps organize all the sessions for a specific view into visualizations that show you where users’ attention was focused. You can easily determine which elements they interacted with the most via color-coded Click Maps or how far they scrolled down a page with Scroll Maps. As a result, heatmaps enable you to measure which areas of your app users may be avoiding due to technical performance issues.
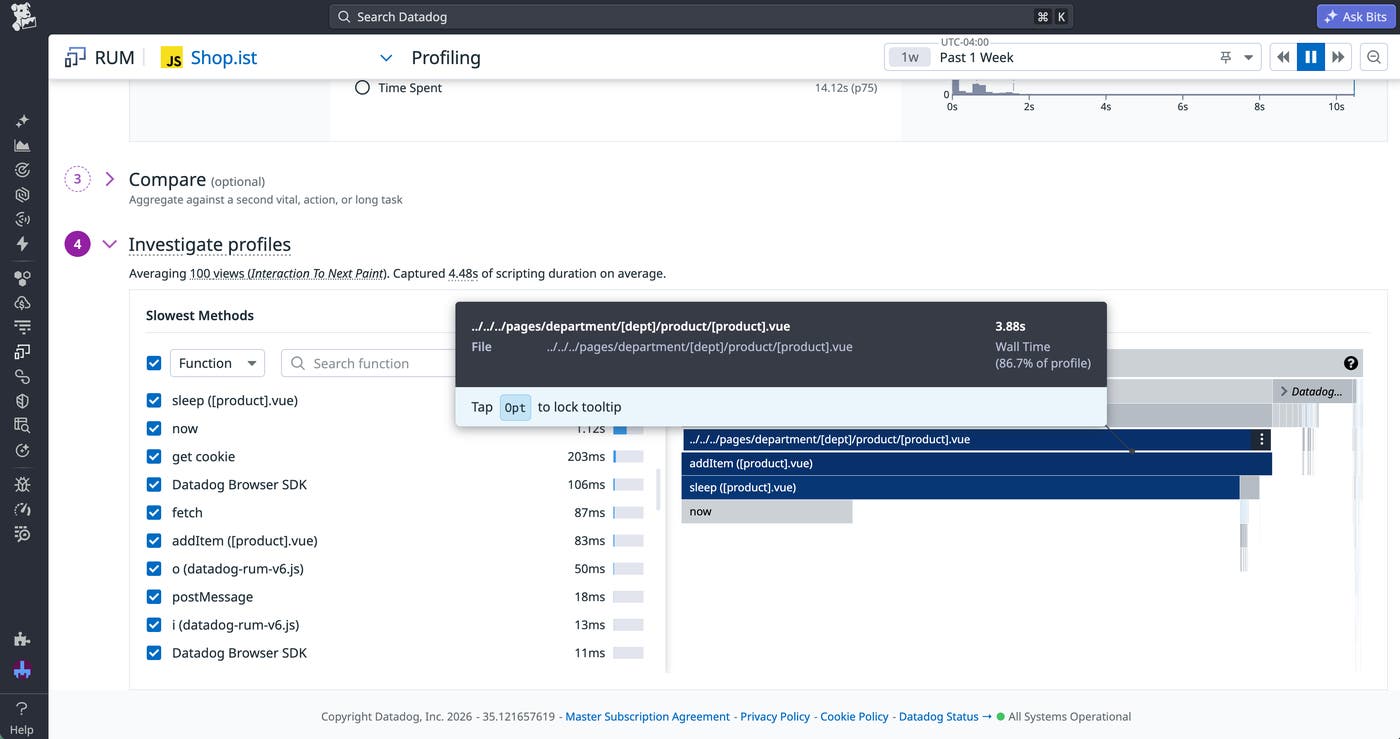
You can then start strategizing the exact changes that need to be made by accessing the Profiling page, now in Preview. The Profiling page displays a list of the slowest functions, either for your entire app or a specific view. You can select a specific metric, such as INP or long tasks, to analyze the functions that have the greatest impact on its score. By selecting a function, you can access a flame graph for an average script execution in your app as well as the exact lines of code behind each span. You can then navigate to the code within the developer platform of your choice to immediately start implementing a fix.
Measure the impact of code changes with Feature Flag Tracking
Once you push your fixes or optimizations, measuring their success presents its own challenge. Not every shift in performance metrics traces back to a code change. Seasonal events, network issues, and other factors can move the same numbers. Even well-tested code can fail when it encounters unpredictable variables like browser or device configuration.
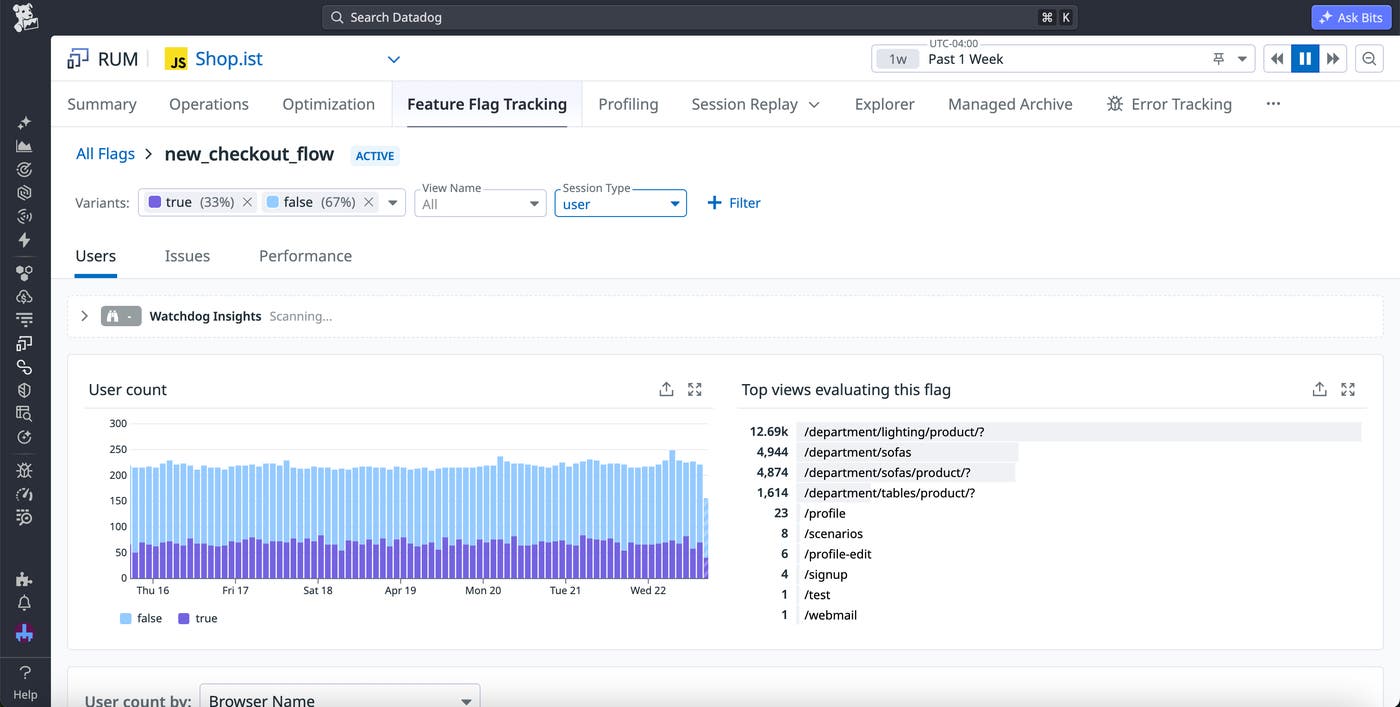
To help you measure the success of code changes and control the impact of potential issues, Datadog RUM enables you to easily run experiments with Feature Flag Tracking. By providing performance comparisons between selectively enabled feature flag variants, Feature Flag Tracking helps you ground technical decisions in concrete metrics and quickly roll back failed changes. For each feature flag variant, you can view user reach, key performance metrics such as CWVs or crash-free sessions, and any issues introduced.
Get started with Datadog Real User Monitoring
Datadog RUM provides real-time insights into user activity and code performance to help you ensure that your app delivers the best possible experience. For full, end-to-end visibility, you can enhance RUM with other features across the Datadog platform, including Product Analytics to answer business questions and conduct growth-oriented experiments, Synthetic Monitoring to proactively test updates, and Application Performance Monitoring (APM) for deeper code improvements.
You can use the Datadog RUM documentation to get started. Or, if you’re new to Datadog, you can sign up for a free 14-day trial today.
