


State of AI Engineering
See how engineering teams are moving from AI prototypes to production systems, where quality and reliability break down, and what high-performing teams do differently as they scale.
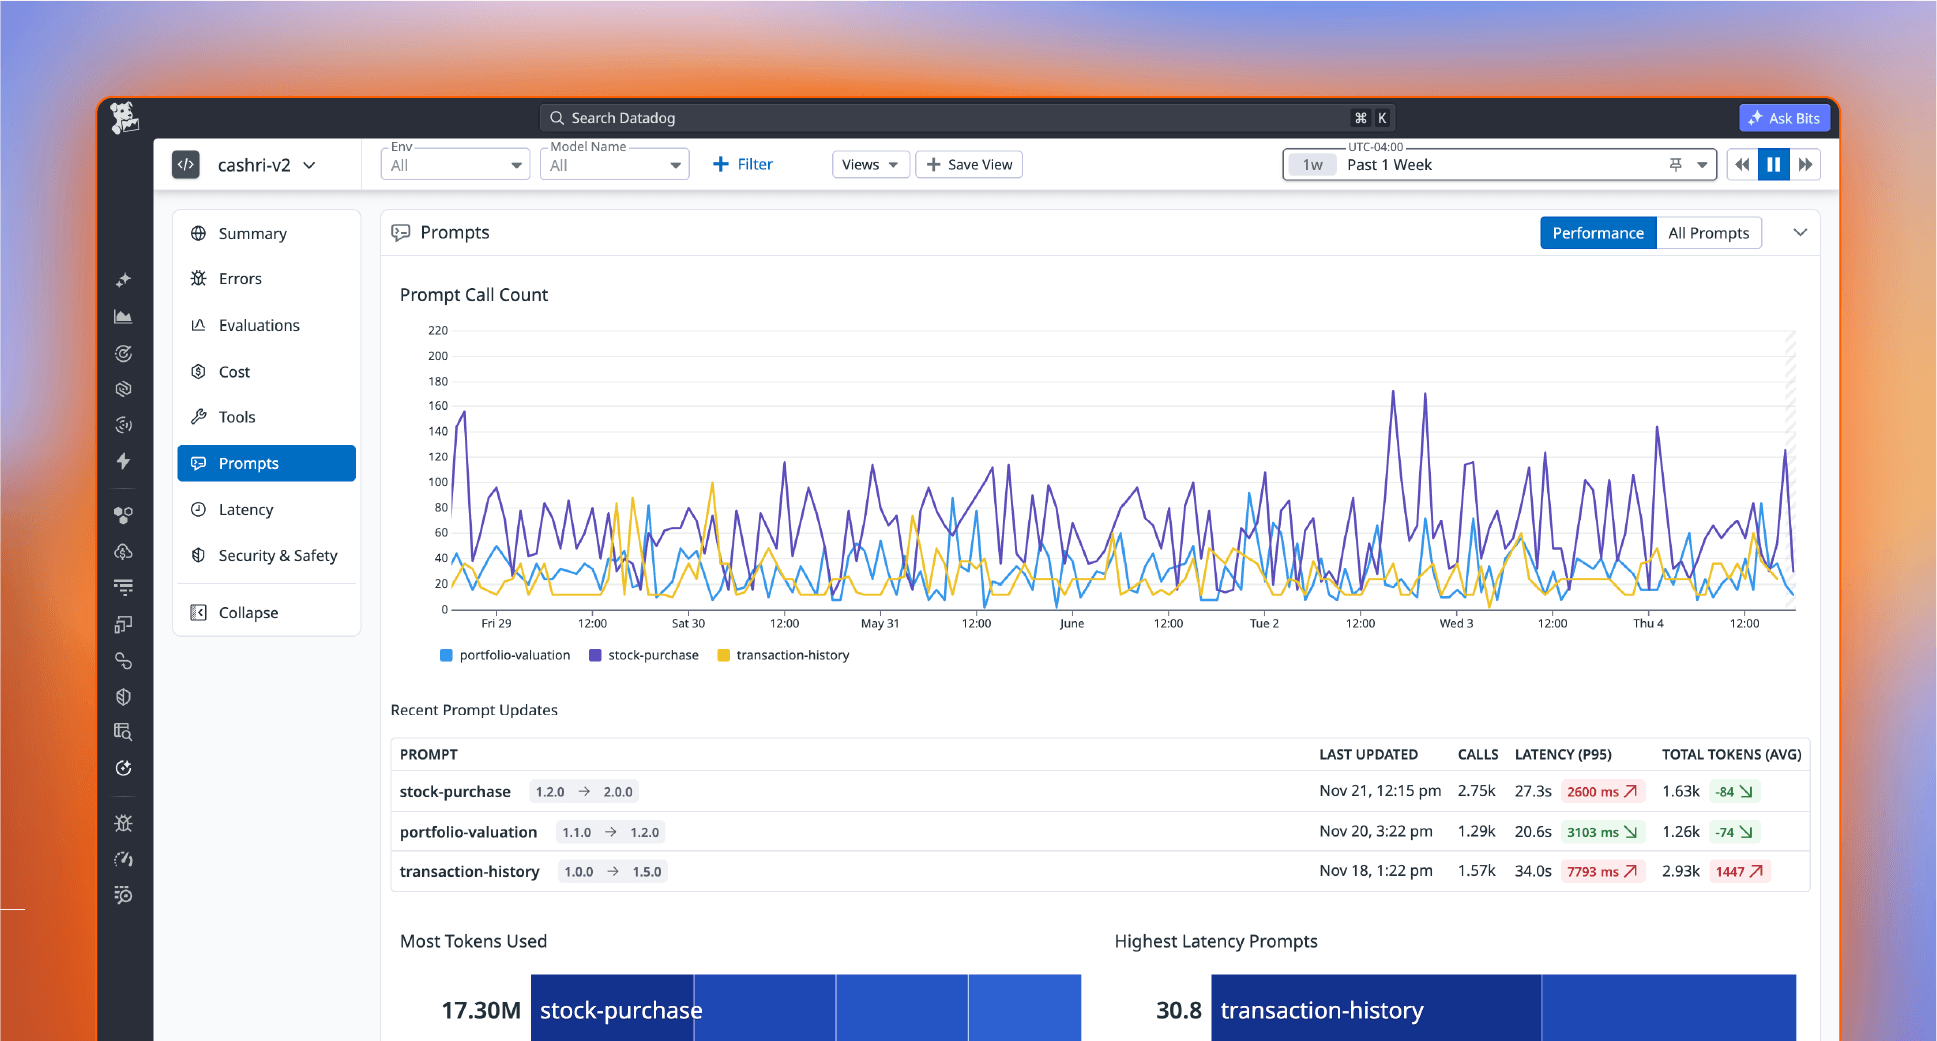
Ship AI agents faster, with confidence
Evaluate, improve, and trace your AI agents with offline experimentation and production observability in one platform.


Supports leading models, frameworks, and agent frameworks
Everything you need to monitor at scale
Move from prototype to production faster in one platform. Validate quality before release, operate with enterprise-grade tracing and security, and troubleshoot at every layer of the stack without switching tools.
Closed-Loop Development
Run the full develop, monitor, and iterate loop in one platform. Evaluate agents in production, build golden datasets from annotated traces, then test changes against those datasets before you ship. Improve quality and cost-efficiency with every deploy.
Battle-Tested Tracing
Instrument once and run the same Datadog tracer from development through production. Built on the same tracing technology trusted by 60% of the Fortune 500 and leading AI labs, AI teams get dependable tracing as agent usage scales.
Enterprise-Grade Controls
Confidently run AI in production with precise alerting, role-based access control, sensitive data protection, HIPAA compliance, and the governance teams need to reduce risk without slowing releases.
Complete Application Context
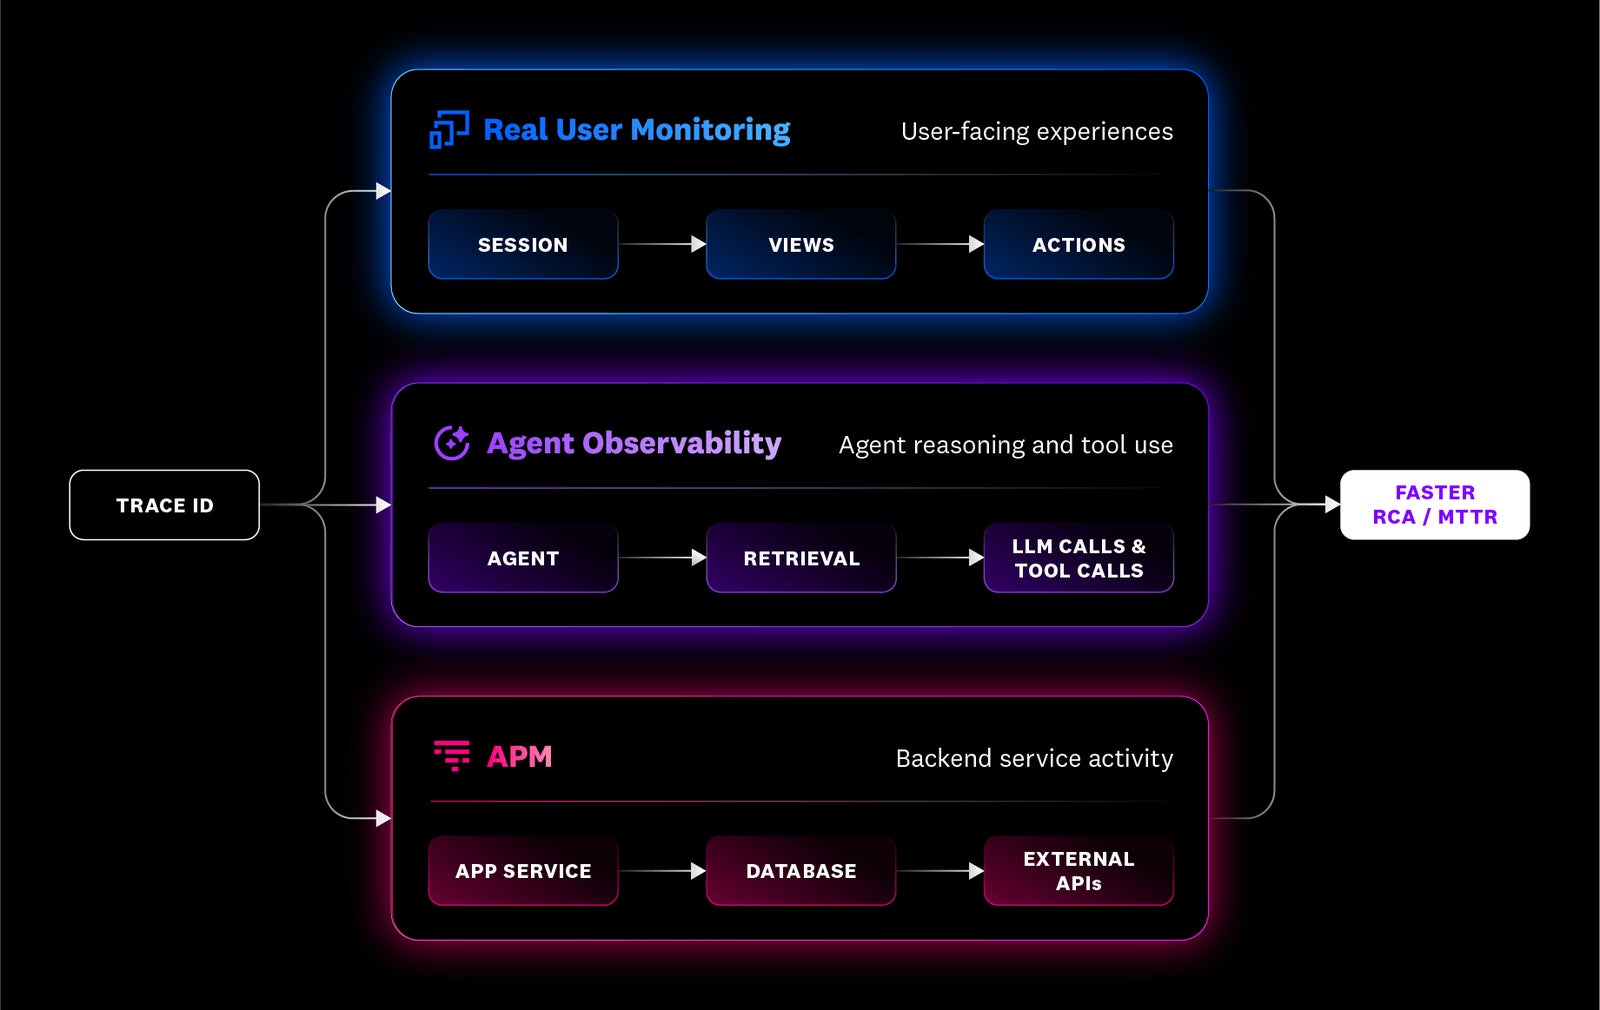
Iterate faster with visibility across requests, services, and upstream and downstream dependencies to pinpoint failures. Correlate agent behavior with backend performance and end-user impact in one shared platform.
Datadog brings application monitoring, agent observability, and digital experience into one continuous flow. When an issue occurs, teams can investigate the same request from service activity to agent reasoning to customer impact to quickly find the root cause and keep their AI systems running smoothly.
Bring every team together in one platform
Give every team involved in AI delivery the context they need to move faster, reduce risk, and operate reliably — from prompt iteration to production response.
Test prompt, model, and tool changes against real production data before rollout. Trace every agent step in production, compare configurations side by side, and debug failures without stitching together separate tools.

Move beyond ad hoc spot checks with structured datasets, automated evaluators, and human review. Measure model and agent quality over time, catch drift earlier, and make tradeoffs between accuracy, cost, and latency with more confidence.

Agent Observability brings AI builders into the same platform SRE and DevOps teams already use. That shared context makes it easier to correlate agent behavior with services, infrastructure, and user experience, so everyone can troubleshoot faster and operate the full stack more reliably.

Get the visibility leaders need across performance, quality, cost, and user impact in one place. Validate changes before rollout, monitor production health continuously, and scale AI programs with stronger governance and fewer surprises.

Your development toolkit for the AI agent era
Iterate fast
Datasets from production traces
Turn real production traces into versioned datasets you can test against. Capture the exact scenarios your system handles so changes get validated on real behavior.
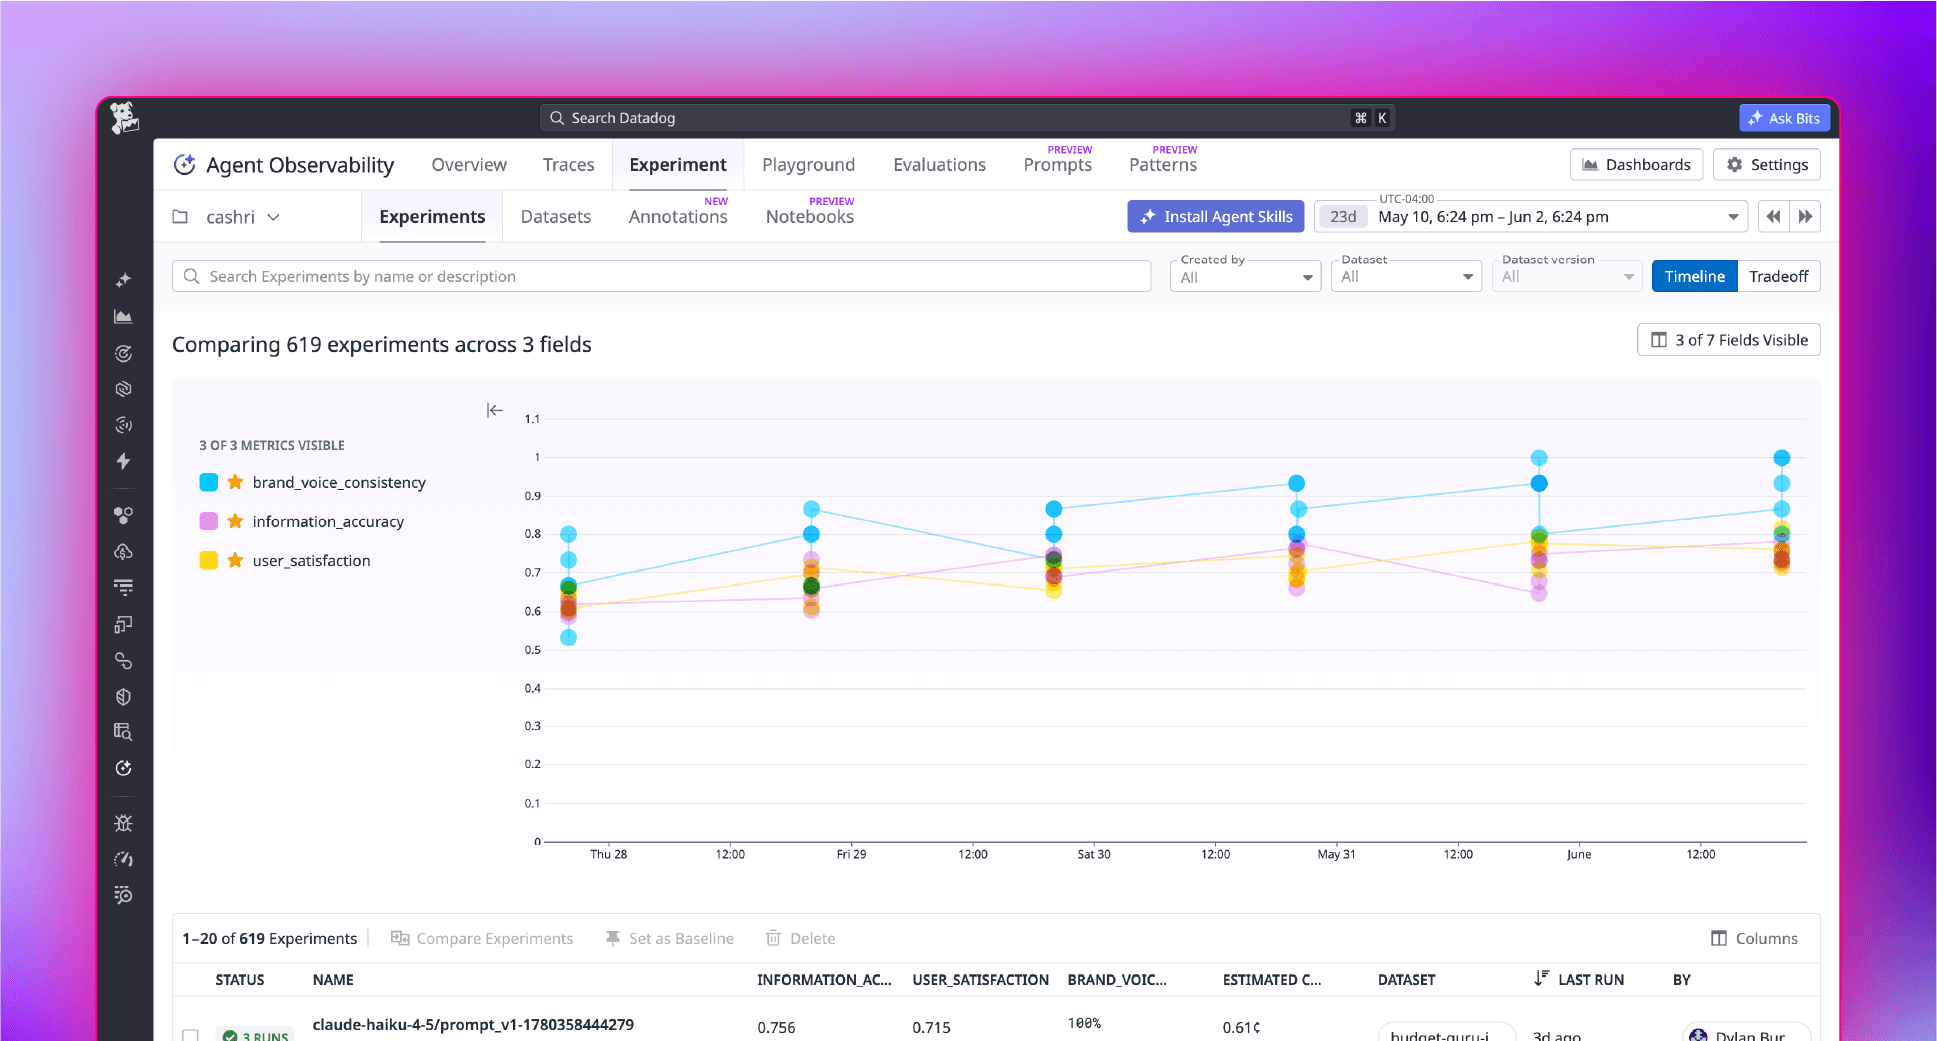
Compare prompts and models
Run experiments that compare prompts, models, and configurations against the same data. See which version performs best before anything reaches users.
Improve with human feedback
Fold real interactions and human feedback into every iteration. Refine system behavior before you ship, not after users hit the gaps.
Evaluate quality
Built-in and custom evaluators
Start with built-in evaluators or define custom ones tied to your KPIs. Measure what matters to your team instead of generic scores.
Annotate and review outputs
Label and grade outputs with annotations and human review. Bring expert judgment into evaluation where automated checks fall short.
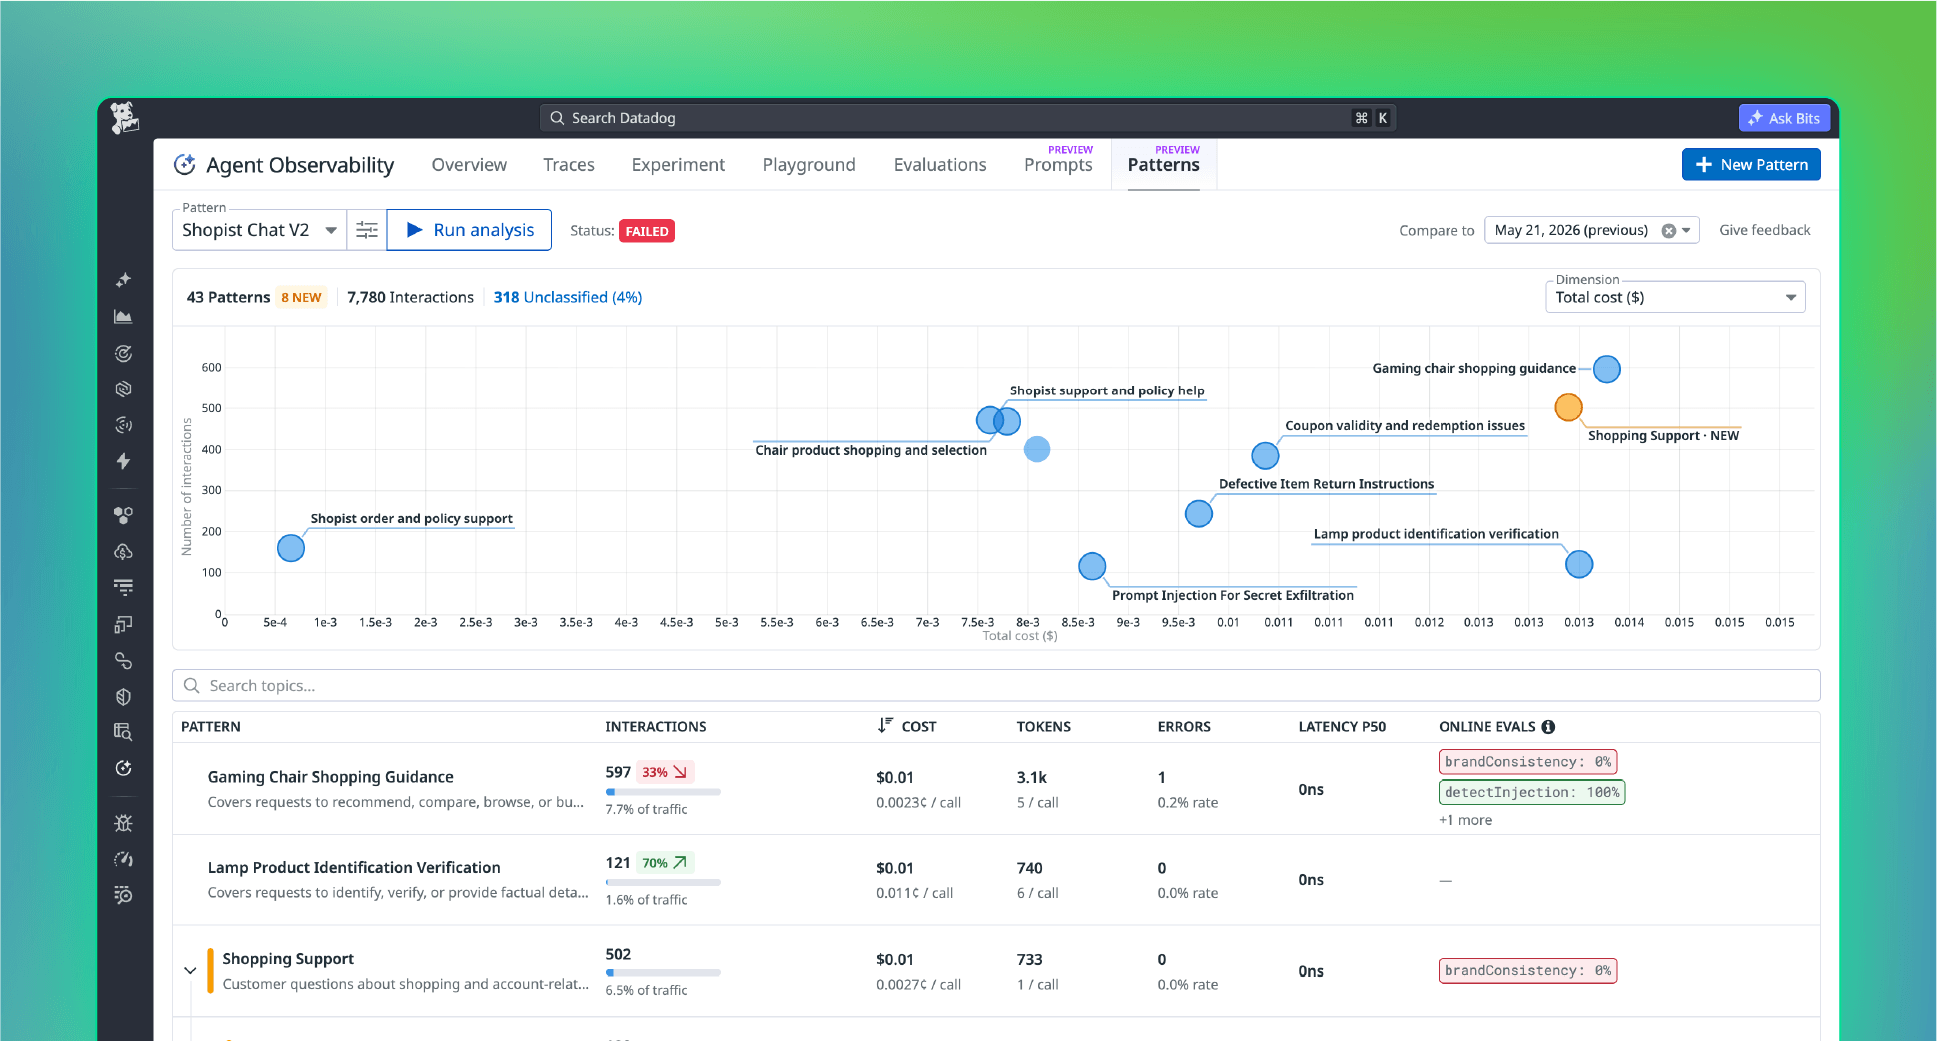
Catch unsafe outputs
Catch hallucinations, prompt injection attempts, and PII exposure as they happen. Track quality trends across releases so regressions never slip through.
Monitor behavior
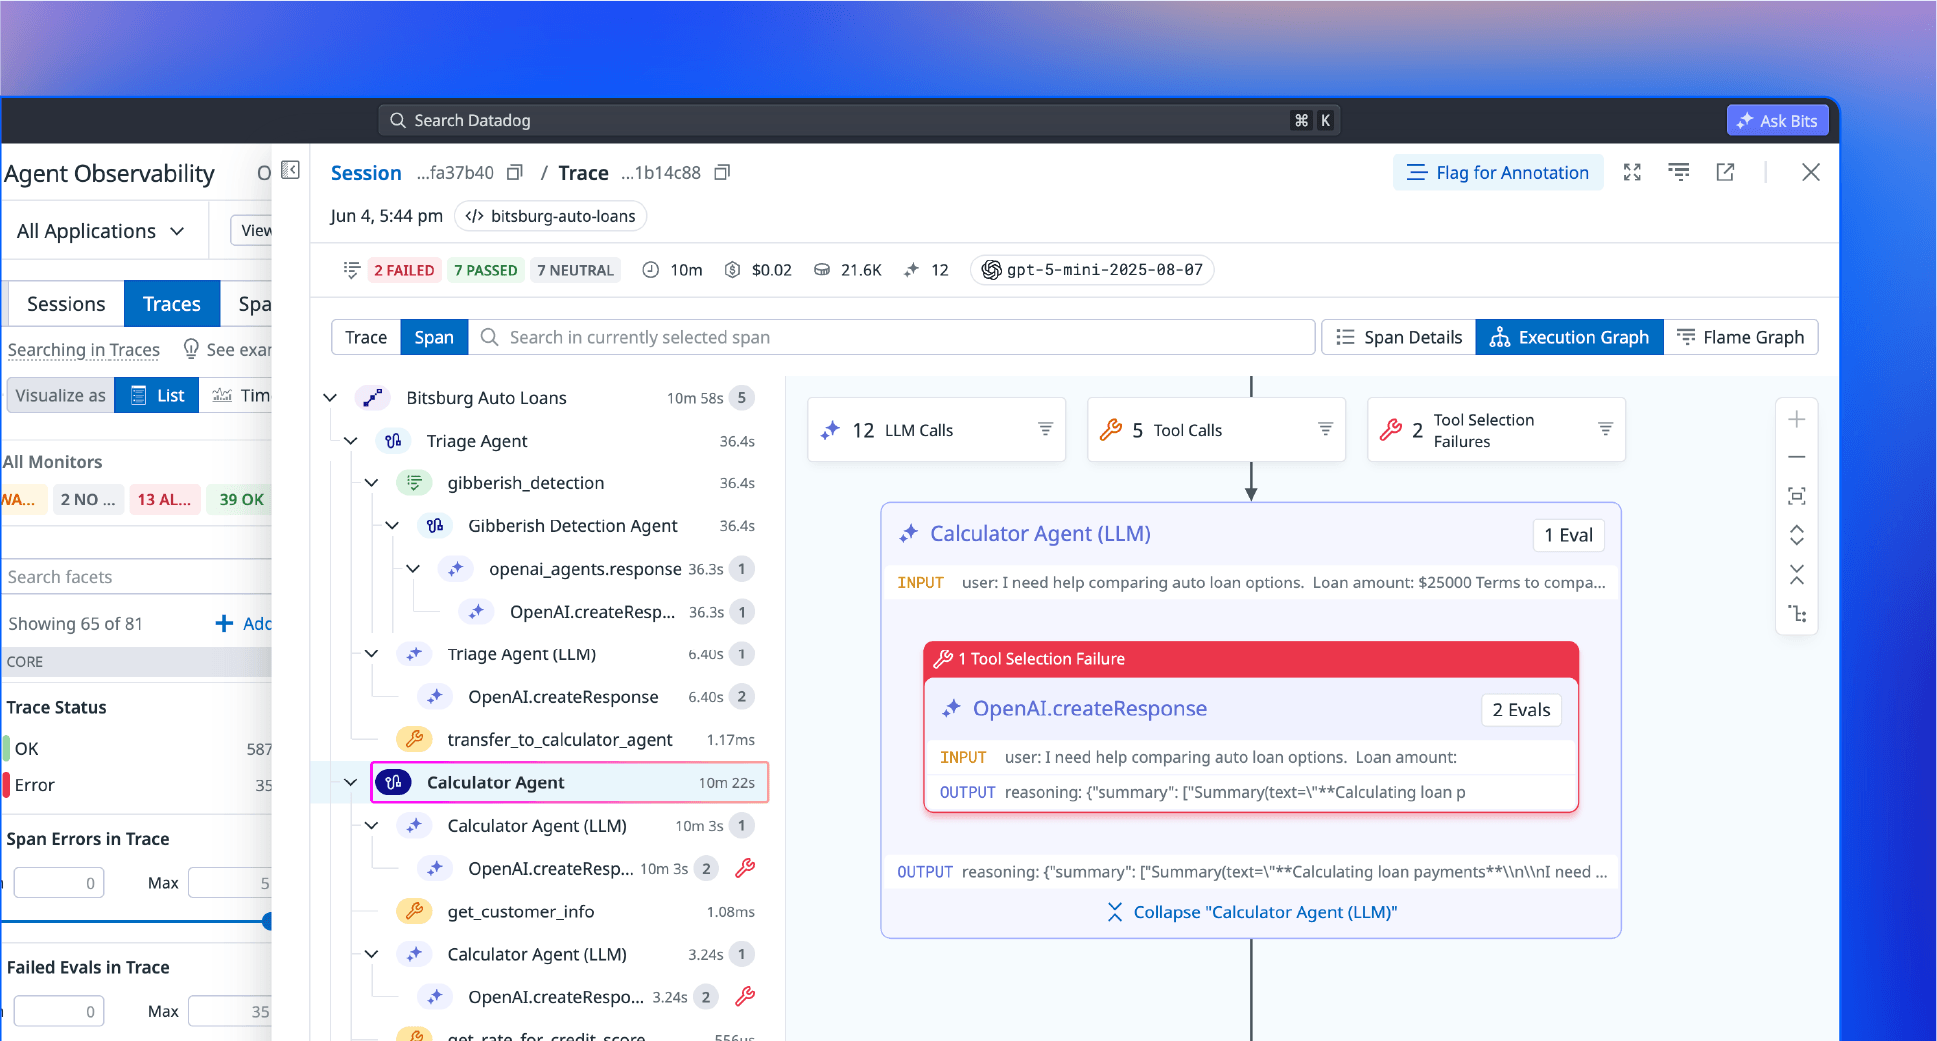
Trace every step
Follow every request across prompts, retrieval steps, tool calls, and agent decisions. See exactly how your system reached each response.
Track latency and usage
Monitor latency, token usage, retries, and errors at every step. Spot the slow or heavy calls without guessing where they hide.
Pinpoint failures fast
Find bottlenecks, failures, and surprise costs with full execution context. Move from a symptom to the exact step that caused it.
Unify context
Correlate with your stack
Connect agent performance to the services and infrastructure underneath. See when a slow database or starved GPU is really the problem.
Link to user sessions
Tie response time and quality back to real user sessions. Know how agent behavior actually lands for the people using it.
One platform, no switching
Keep tracing, experiments, and evaluations in one place. Debug faster when you're not jumping between four different tools.
Try Agent Observability in your browser
Trace your AI apps and coding agents on your machine, free and no signup needed.
Priced for startups, built for enterprise
Scale production-grade AI agents with enterprise-grade controls — starting for free.
How we price
Per LLM spans
An LLM span is a single call to an LLM provider. It's the only span we bill on. Tool, workflow, agent, embedding, and retrieval spans are all free.
Why it matters
Pay for actual AI work
Unlimited context means unlimited ambition. Only pay for the actual AI work, not every surrounding step in the workflow. You're billed on one thing, the calls your app makes to an LLM, so your cost doesn't climb just because context grows or reasoning gets heavier.
Every package includes our full agent engineering platform, so teams at every growth stage get what they need to compete. Ship faster with end-to-end tracing, datasets, experiments, prompt workflows, evaluations, annotations, production monitoring, custom dashboarding, CLI and MCP access – all available to you from day one.
Additional on-demand usage is billed after the first 100K LLM spans
Retention add-ons extend traces to 30, 60, or 90 days and experiments to 6, 9, or 12 months
Sensitive Data Scanner is included and scales with LLM usage
Fast-growing teams ship production-ready AI with Datadog
Teams who improve quality, move faster, and deploy AI safely at scale. Join 33,000+ organizations that trust Datadog to keep their infrastructure running
400%
faster MTTR
40%
lower token usage per task
15%
faster deployment
AI Cybersecurity
Datadog LLM Observability gives us complete visibility into our agents' reasoning so we can reduce cost, improve reliability, and ship with confidence.
Get Started In Minutes
Install MCP
Install the MCP (Model Context Protocol) server in your terminal
Run Prompt header
Copy this prompt into your terminal
Run Prompt
Install MCP
Install the MCP (Model Context Protocol) server in Cursor
Run Prompt
Install the SDK
Prefix your Python start command with ddtrace-run
Install the SDK
Prefix your Node start command with ddtrace-run
Install the SDK
Prefix your Java start command with ddtrace-run
Datadog Agent Observability helps teams evaluate, improve, and trace AI agents across development and production in one platform. It connects experimentation, evaluations, and production observability so teams can ship faster with more confidence.
An LLM span is one call to an LLM provider such as OpenAI or Anthropic. One agent workflow can create multiple LLM spans, and Datadog bills only on those LLM spans rather than every surrounding span in the workflow.
It includes end-to-end LLM tracing, datasets, experiments, a testing playground, offline and online evaluations, prompt workflows, human review and annotation, and production monitoring. Every package includes the full workflow rather than gating core capabilities by plan.
Agent Observability supports leading models, frameworks, and agent frameworks including OpenAI, Anthropic, Gemini, Vertex AI, LangChain, CrewAI, Pydantic, Bedrock, LiteLLM, and Strands Agents. Teams can instrument applications in Python, Node.js, or Java, and use OpenTelemetry or the HTTP API for other environments.
Most teams can get started in minutes using SDK instrumentation or AI-assisted setup. Auto-instrumentation can capture traces for common LLM providers and orchestration frameworks, which reduces manual setup.
On-demand Free and Pro plans have a 15-day trace, span and experiment data retention. When committing to M2M or Annual contracts, trace and span data are retained for 15 days. Experiment results are retained for 90 days.
Retention add-ons extend traces and spans to 30, 60, or 90 days and extend experiments to 6, 9, or 12 months.
Datasets have a separate 3-year retention and are versioned so you can rerun experiments against the same baseline and compare results over time.
Yes. If your application can emit spans through OpenTelemetry or the HTTP API, you can instrument custom frameworks and other languages beyond the standard SDKs. That gives teams a path to bring nonstandard AI stacks into the same workflow.
Free includes up to 40K LLM spans per month. Pro starts at $160 per month and includes 100K LLM spans.
Additional on demand usage is billed after the first 100K LLM spans. Retention add ons are billed per 10K LLM spans. M2M and annual commitments are discounted.
There is no separate product fee for offline or online evaluations. Every plan includes the full evaluation workflow.
If an eval run makes LLM calls, those calls count as LLM spans. You are not charged a separate eval fee on top of that.
Teams can build datasets from traces, run experiments and evaluators before release, then monitor quality, latency, cost, and failures in production using the same system. That closes the loop between pre-production improvement and live production response.
Agent Observability includes sensitive data scanning and redaction, role-based access control, precise alerting, and enterprise-grade controls designed to help teams operate AI safely in production. Sensitive Data Scanner is built in and scales with usage.
Datadog connects development and production in one workflow, so teams can experiment with real production data, validate changes before rollout, and trace issues across the full application stack. It also unifies AI agent behavior with backend services and user experience, which reduces tool switching and speeds root cause analysis.
Resources & Learning
Guides, research, and technical content to help teams build, evaluate, and operate AI agents with confidence.