Mary Jac Heuman
Without unified visibility across your entire stack, it can be difficult to investigate backend dependencies when troubleshooting frontend issues or track the source of database failures that originate from bad browser requests. Full-stack visibility gives you the data you need to pinpoint and resolve incidents quickly.
Datadog Real User Monitoring (RUM) provides you with real-time insight into how users are experiencing your application. At the same time, on the backend, distributed tracing provides visibility into the lifespan of individual requests, as well as key performance metrics including request throughput, latency, and error rates. Now, you can connect your RUM data with corresponding traces, giving you unified, end-to-end visibility into requests as they move across layers of your stack. This provides rich context around problems, helping you more easily locate backend issues that resulted in user-facing errors or identify the full user impact of an issue within your stack.
In this post, we’ll look at how you can use Datadog APM and RUM to more easily investigate application errors and track their impact. We will walk through:
- finding the backend root cause of a rise in frontend errors
- analyzing frontend metrics to gauge user impact from a backend slowdown
Use frontend data to locate a backend root cause
Datadog RUM can help alert you to problems with your application that are affecting end-user experiences. For example, Error Tracking automatically aggregates similar frontend errors into issues so you can triage them and investigate the most urgent ones.
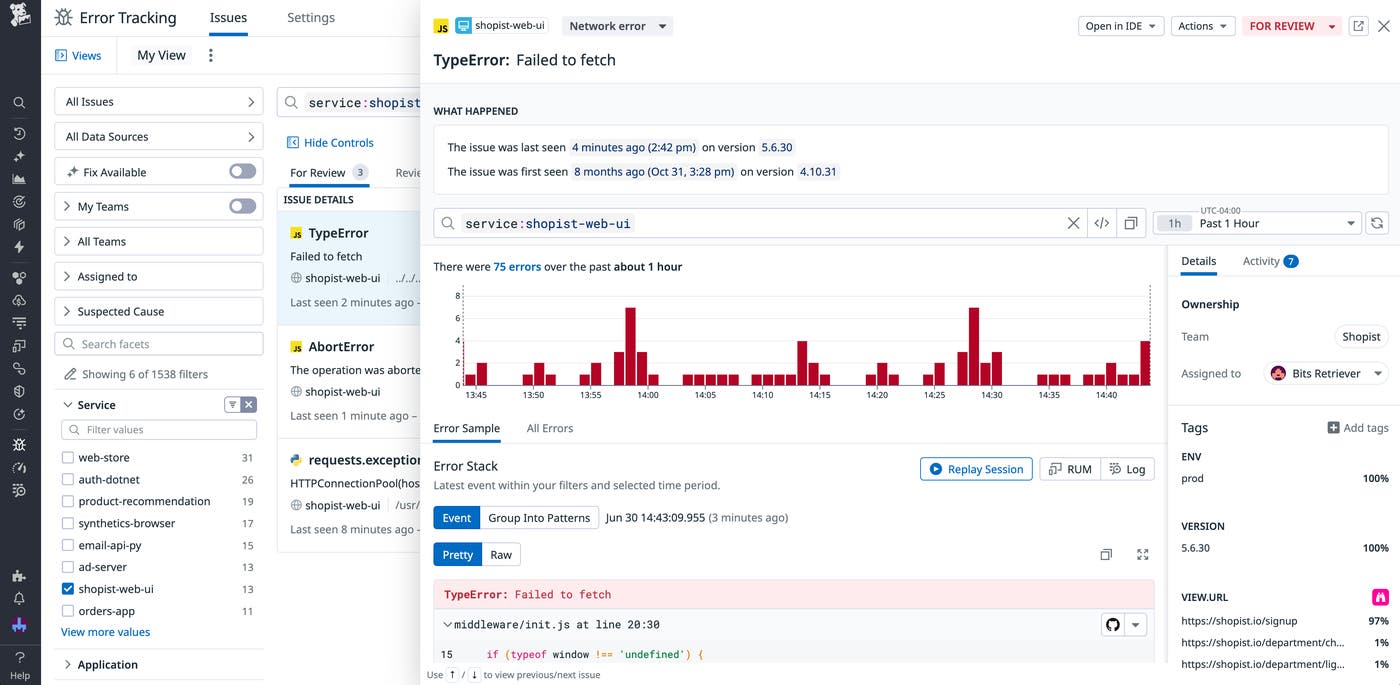
In addition to key details about the error, Error Tracking captures information from the user session—like the user’s location, device type, and browser (in the case of web apps and mobile webviews)—and data about the page or mobile view that experienced the problem, such as the view path group and web app URL. This helps you determine the scope of the issue, including where exactly in your application it is manifesting and who it is affecting.
But if the root cause of the problem is located somewhere in one of your backend services or dependencies, it can be difficult to find it with frontend data alone. For that, we can pivot to APM.
Dive into the backend trace
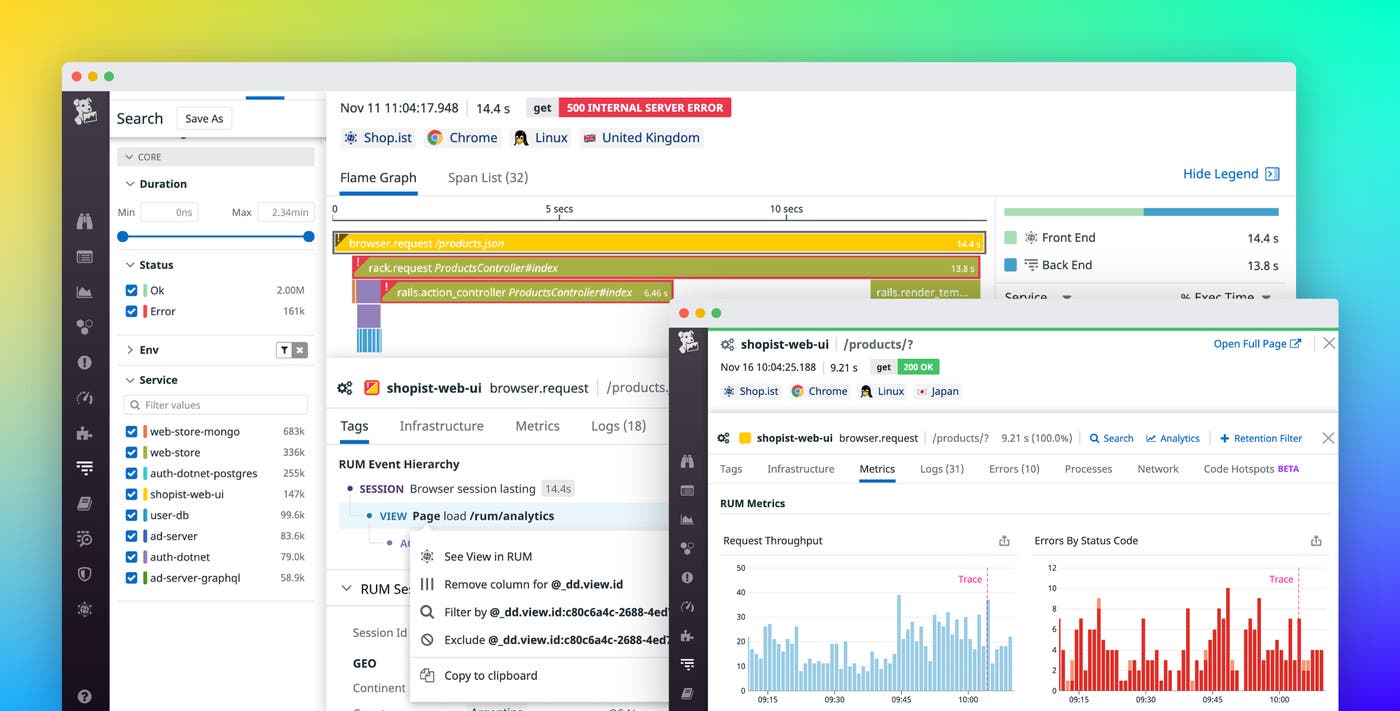
Because Datadog RUM and APM are fully integrated, traces are tagged with frontend data, including the session ID, view ID, and view path group of the user that initiated the request. This enables you to easily jump from errors to relevant trace data. Let’s say you receive an alert about a frontend error. You can pivot directly to APM from the error and view a flame graph visualizing the full associated trace. Within this graph, you can filter the traces listed based on which services returned errors to identify the downstream services involved in the issue. This helps you understand whether the problem actually comes from your frontend application or one of your backend services.
In addition to helping you identify the backend service that is causing your frontend problem, visualizing the trace allows you to debug the issue by providing full visibility into metrics, logs, network performance data, and code hotspots, all from within a single pane of glass.
Measure end-user impact of a backend problem
So far, we’ve seen how Datadog’s integration between RUM and APM data enables you to pivot from frontend data to backend traces, helping you locate and troubleshoot the root causes of problems. Next, we’ll see how RUM can provide deep context around an incident by analyzing who the problem affected.
Let’s say you receive an alert indicating an increased error rate for requests to your checkout service. To investigate, you could start by looking at related traces to localize the error and determine where the service is experiencing problems. Drilling down into the map for one of these traces, you can see that several downstream services are seeing availability impacts. Viewing the logs associated with the trace reveals your lower-level payment service reached its rate limit and returned a 403 status code, propagating the error back to the surface and likely causing the problem.
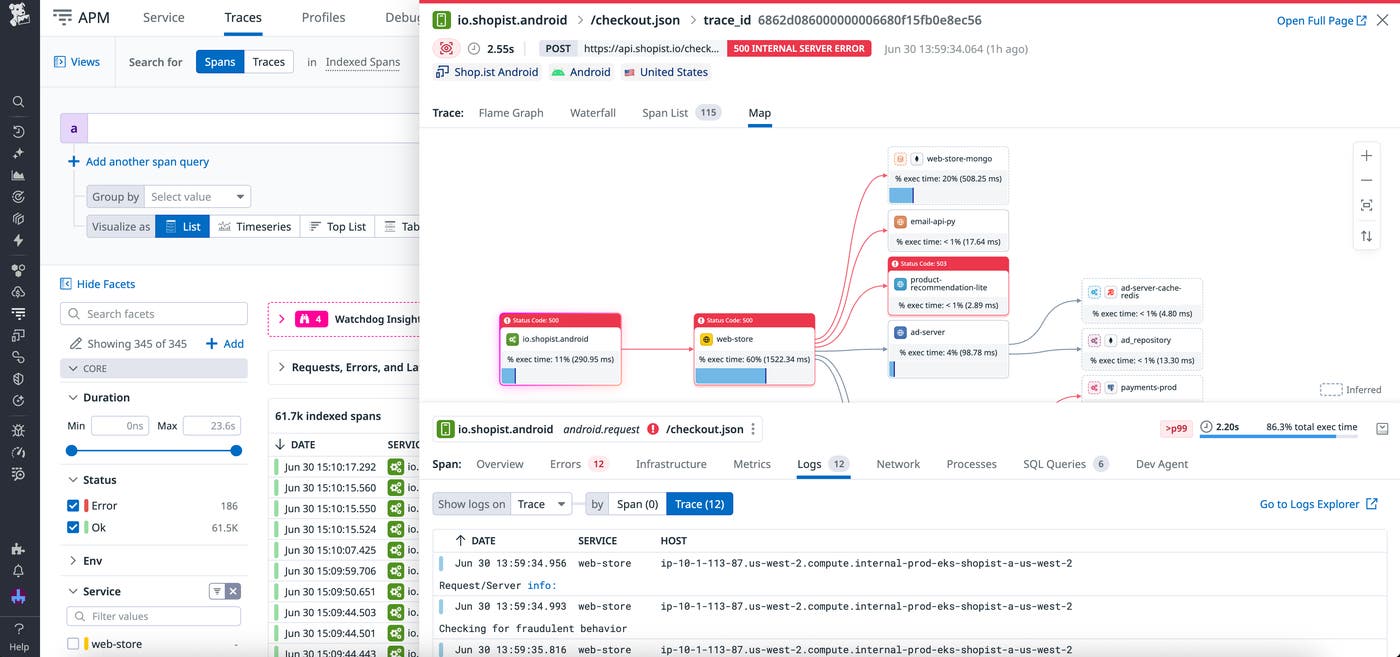
You’ve used APM to identify the cause of the errors, enabling you to notify the relevant team and deploy a fix. Next, you can use RUM to find out which users were actually affected and how widespread the incident was.
Your trace includes a top-level span named /checkout.json that tracks the request’s full life cycle. By selecting that span, you can see frontend metadata, including the session ID and view path group. With this data, you can see that the span represents the real user interaction that initiated the problematic backend request.
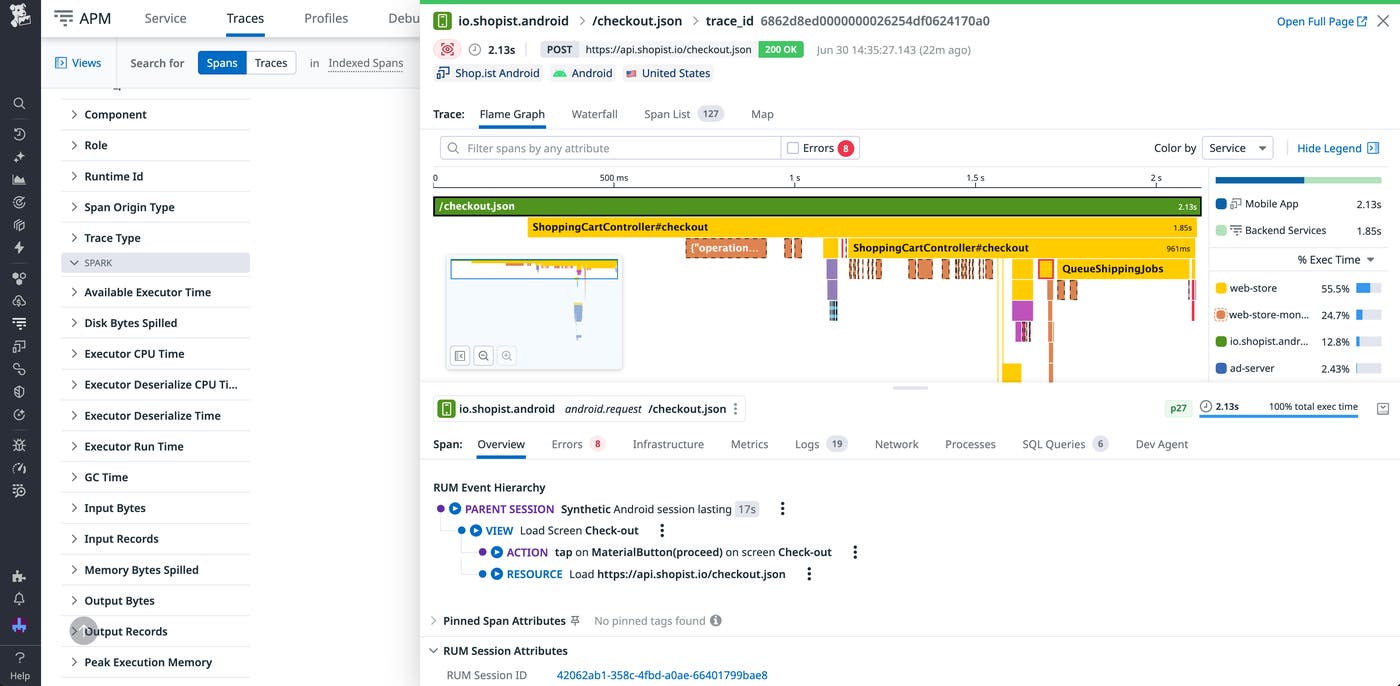
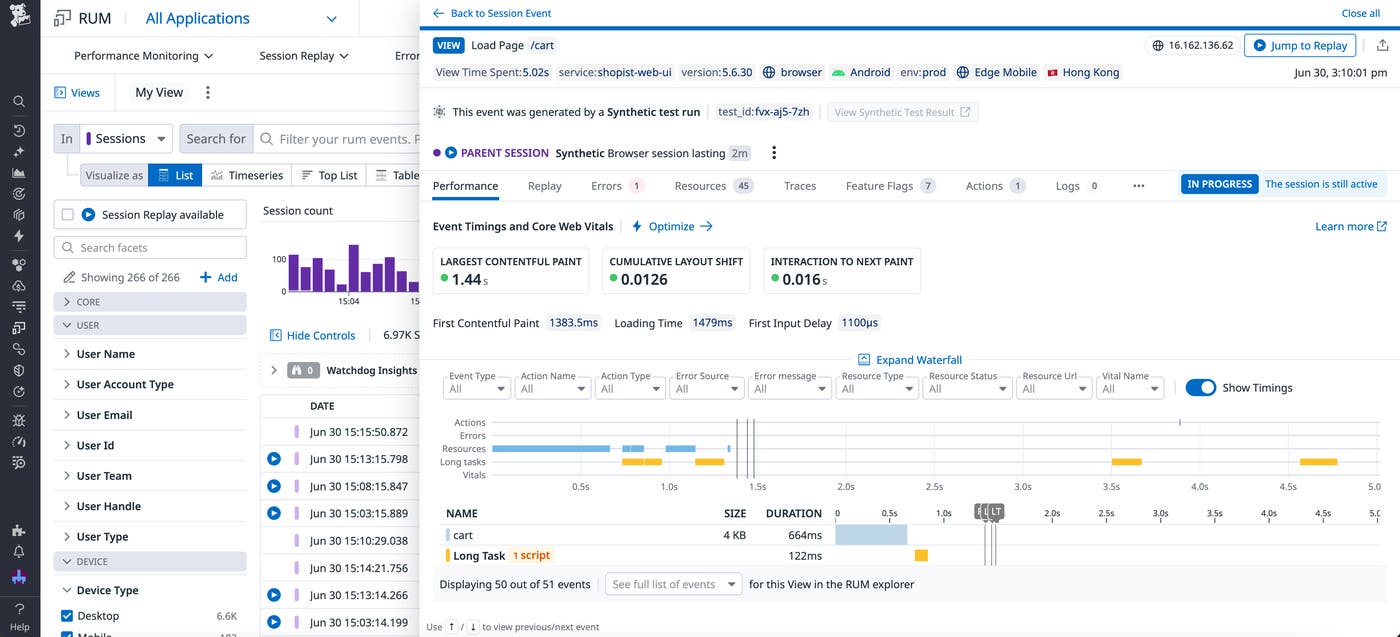
Because Datadog connects traces with associated RUM data, you can also see that the trace resulted in a view of the /cart/checkout path group. You can select the path group to view it in the RUM Explorer. This enables you to see, for example, where incoming requests to that path group are coming from and their loading time. Or, you can use the view ID to see the exact page or mobile view that was rendered for even more context on how the error impacted the user session.
From here, you can view a waterfall breakdown of all resources called during the exact view load that resulted in the backend error and pinpoint where there was a slowdown.
End-to-end visibility with Datadog APM and RUM
Datadog makes full-stack troubleshooting seamless by bringing together real-user analytics with real-time backend traces. You can easily visualize and correlate frontend data alongside a full breakdown of backend activity from a single view. So, with one pane of glass, you can trace a request timeout to a database operation, or link an API failure to a typo in a web component.
You can start using Datadog APM and RUM to get complete visibility into your stack today. Or, if you’re new to Datadog, get started with our 14-day free trial.
