

Aaron Kaplan
Technical Content Writer

Ryan Warrier
Senior Product Manager
Earlier in this series, we covered key metrics for monitoring performance in Databricks and discussed Databricks’ native resources for accessing those metrics and other key observability data, such as logs and data lineage.
In this post, we’ll cover using the Databricks integration to bring that data into Datadog and monitor your Databricks analytics and AI/ML workloads alongside the rest of your end-to-end data pipelines and distributed infrastructure. We’ll show you how to:
Monitor and optimize your Databricks jobs and clusters
Datadog’s integration with Databricks uses three complementary data collection paths to provide low-latency, end-to-end visibility into your analytics, data engineering, and Model Serving workloads:
On classic compute Databricks clusters, the Datadog Agent captures real-time Spark metrics, host resource utilization, and driver and executor logs.
Databricks API polling captures near real-time execution data for job and task runs, such as durations, statuses, error messages, and tagging metadata.
System table queries on a dedicated Databricks SQL warehouse capture cost and lineage data.
The integration uses Data Observability: Jobs Monitoring to help you monitor the health, performance, infrastructure, and costs of your data processing jobs. In addition to Databricks and Spark, Jobs Monitoring integrates with Azure Data Factory and dbt, so you can simultaneously monitor orchestration and processing jobs upstream and downstream of your Databricks workspaces.
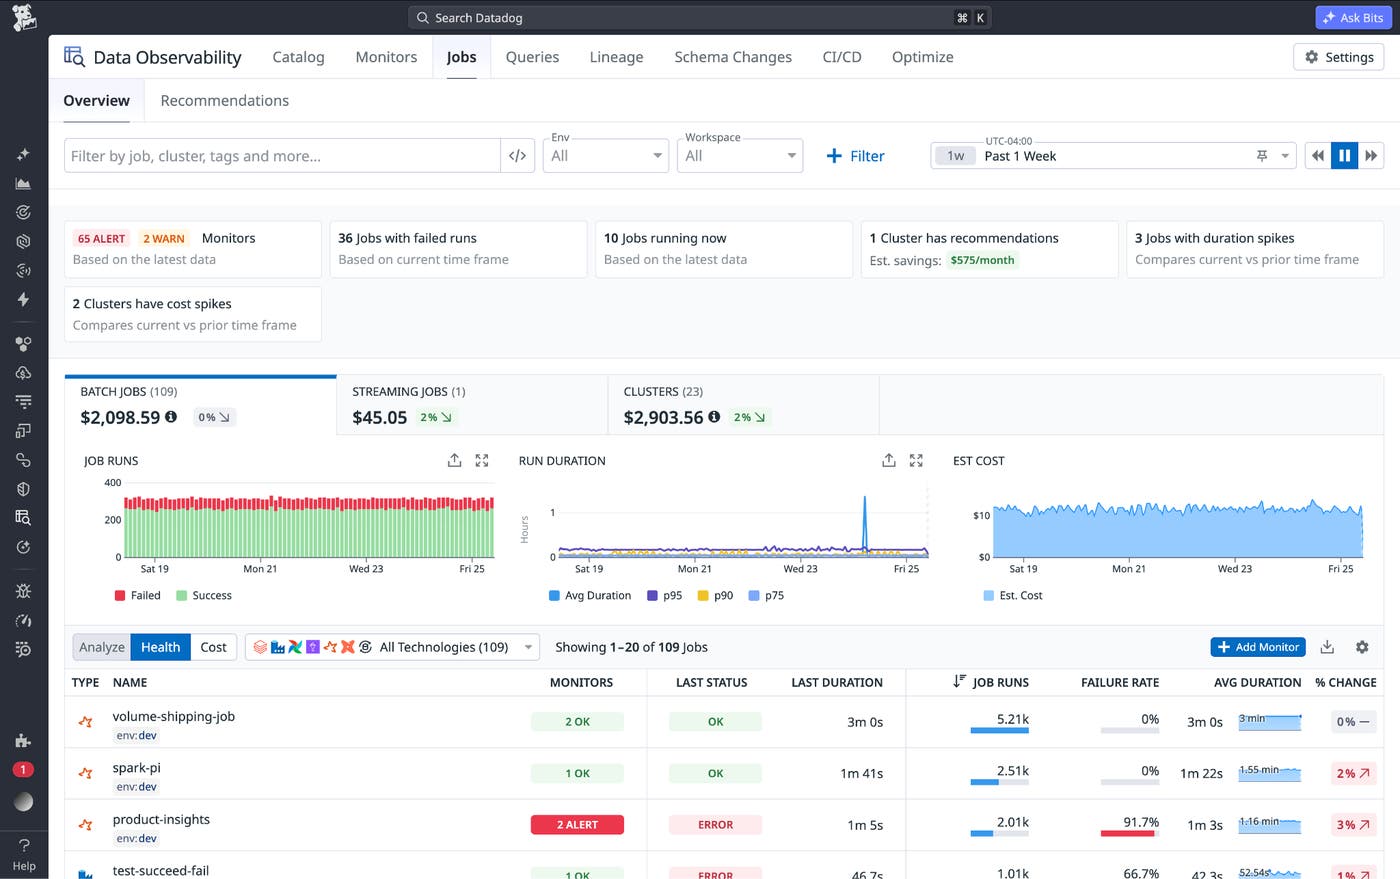
From the Batch Jobs and Streaming Jobs tabs, you can monitor aggregate cost and performance metrics and toggle between Health and Cost views of the job list, enabling you to quickly survey key profiling data.
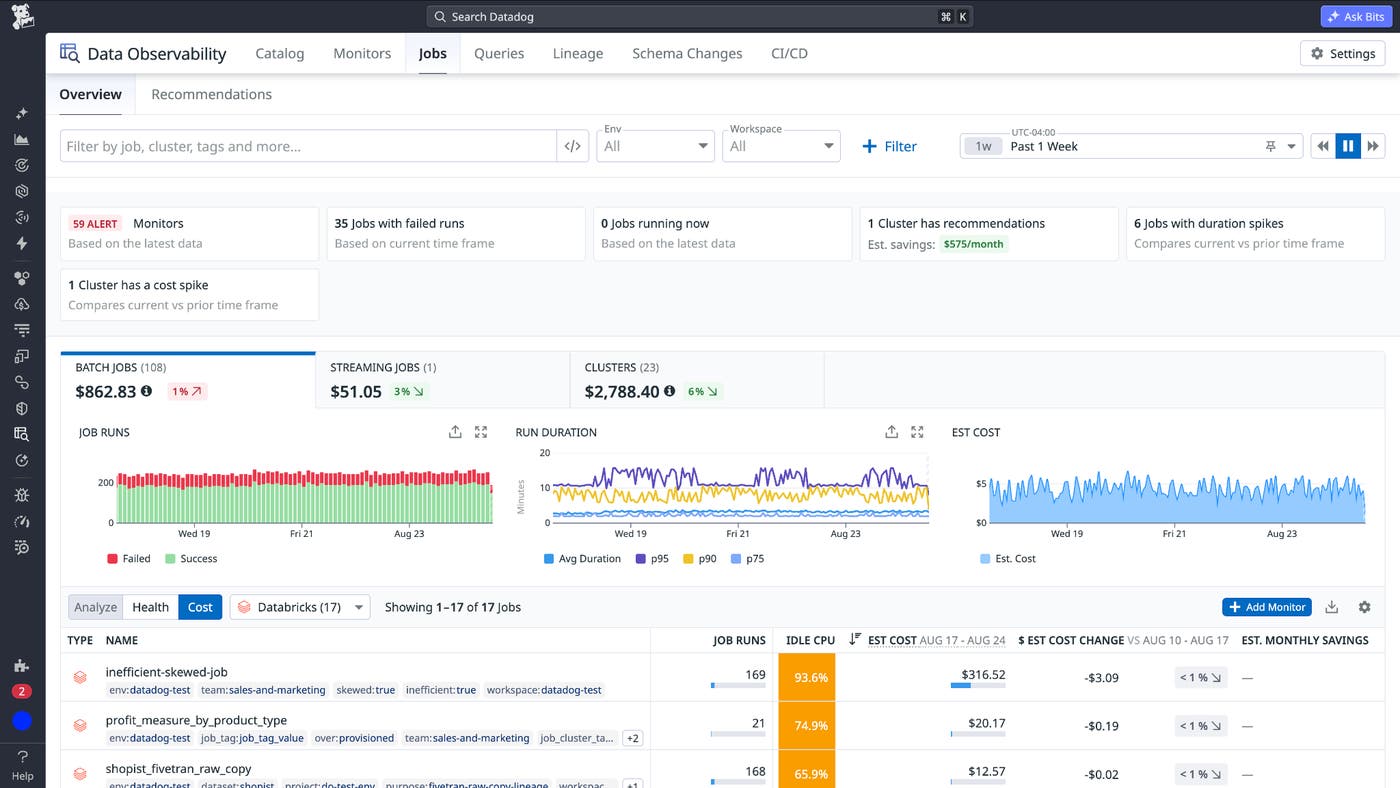
Alongside the job list, the Jobs Monitoring UI automatically surfaces job failures as well as cost and performance trends, anomalies, and recommendations, optionally incorporating data from Datadog Cloud Cost Management (CCM) so you can view Databricks Unit (DBU) costs alongside the associated cloud spend. You can also use Jobs Monitoring to alert on job failures or delays, track and analyze the performance of both classic and serverless compute jobs and SQL warehouses, and collect Spark driver and executor logs from your Databricks clusters for debugging.
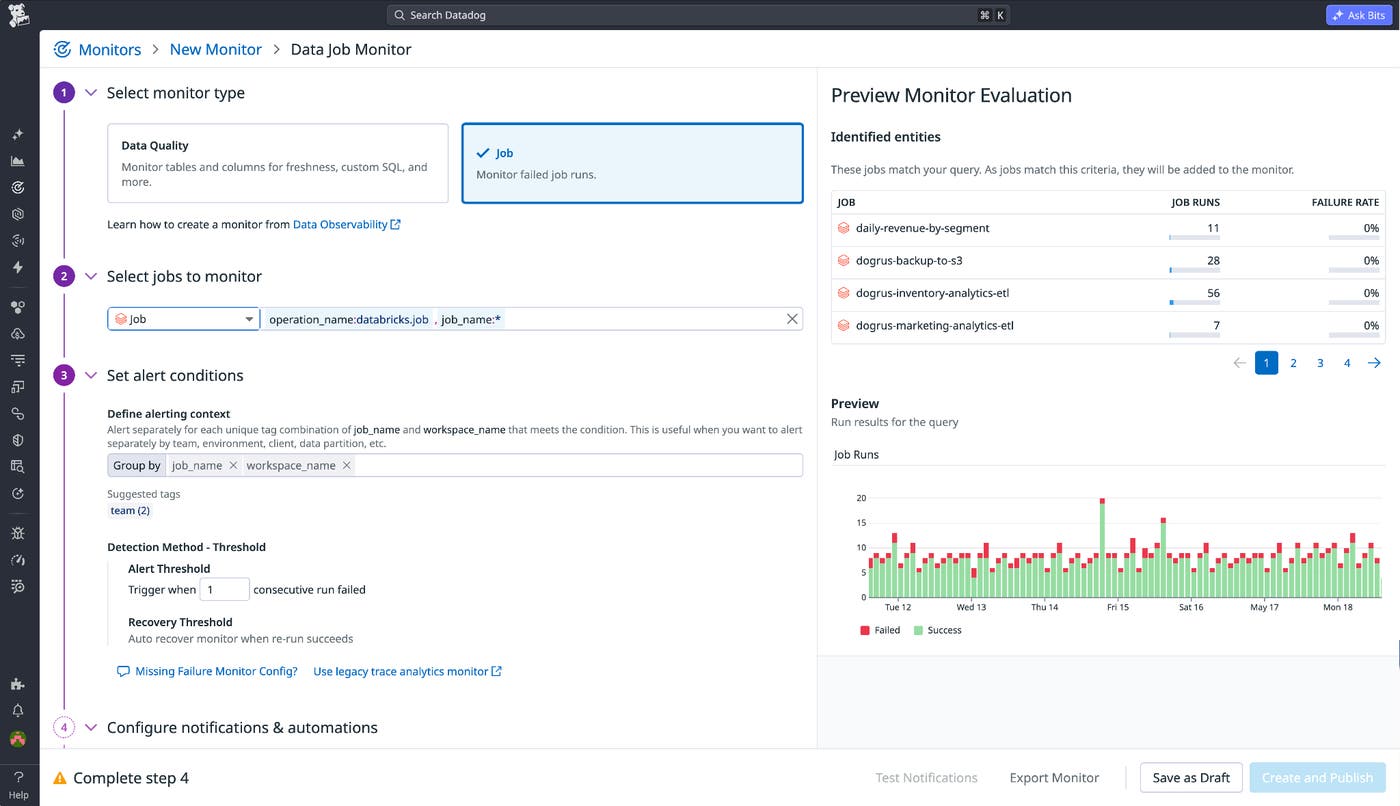
For example, you can use Data Observability job monitors, which handle retries gracefully to minimize false alerts, to alert on failures. Alerting on job, cluster, and infrastructure performance helps ensure a quick response to data processing issues and preempts impact on downstream consumers.
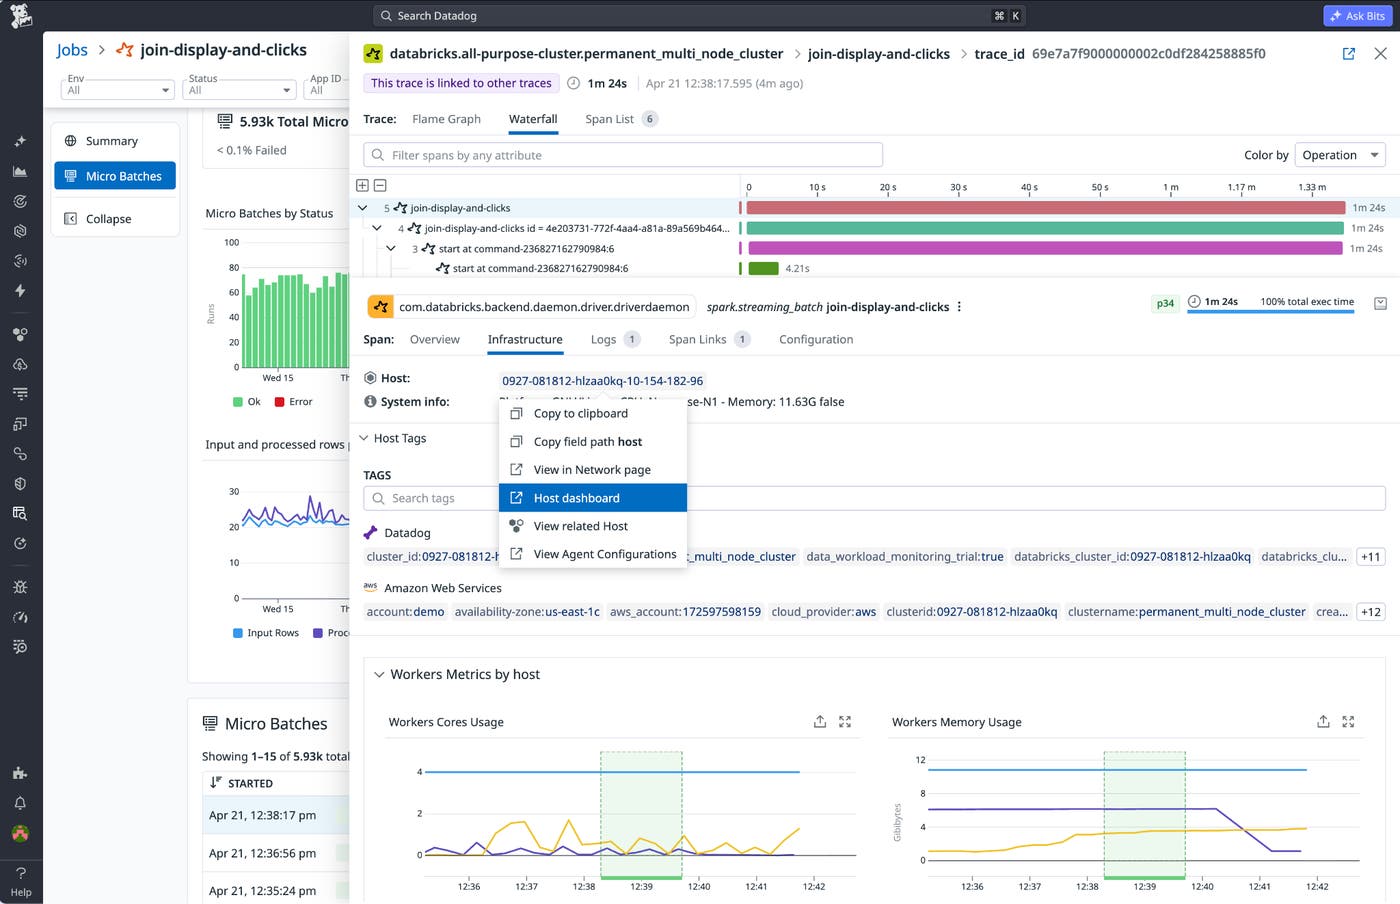
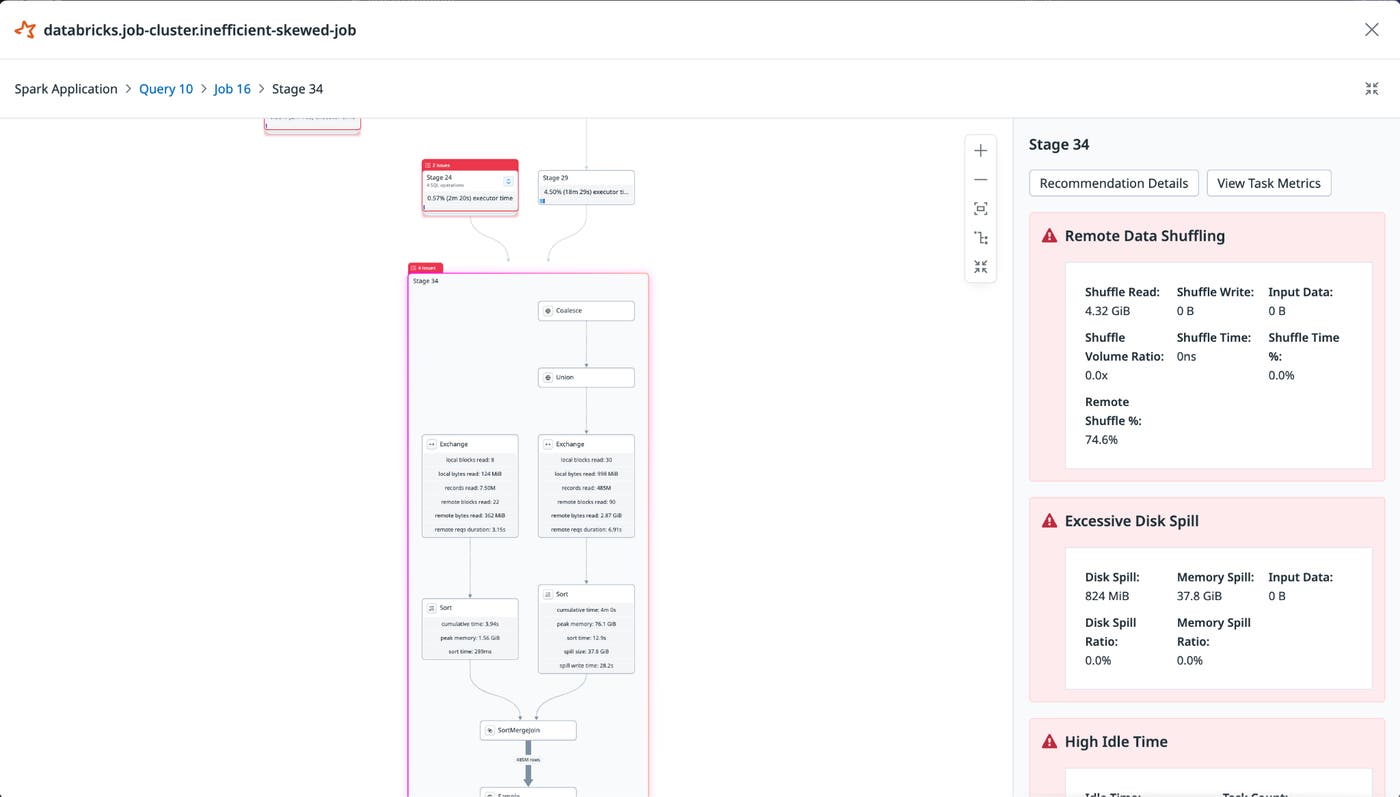
You can troubleshoot jobs by selecting them from the Jobs Monitoring list to access their historical performance and cost data and inspect Spark job-, stage-, and task-level traces for individual runs. You can also debug failing or underperforming jobs, view related errors, logs, and infrastructure data, and quickly pivot to Error Tracking, Log Management, and dedicated host dashboards for closer analysis.
For underperforming jobs, you can drill into Spark SQL query plans to pinpoint bottlenecks, as shown in the following screenshot:
When the root cause of an issue lies below Databricks, Datadog’s integrations with AWS, Azure, and Google Cloud can help you dig deeper into the health of your infrastructure. You can use these integrations to inspect relevant VM, storage, and networking telemetry, as well as to send audit logs collected in Amazon S3, Azure Data Lake Storage, and Google Cloud Storage (GCS) to Datadog for correlation with the rest of your telemetry.
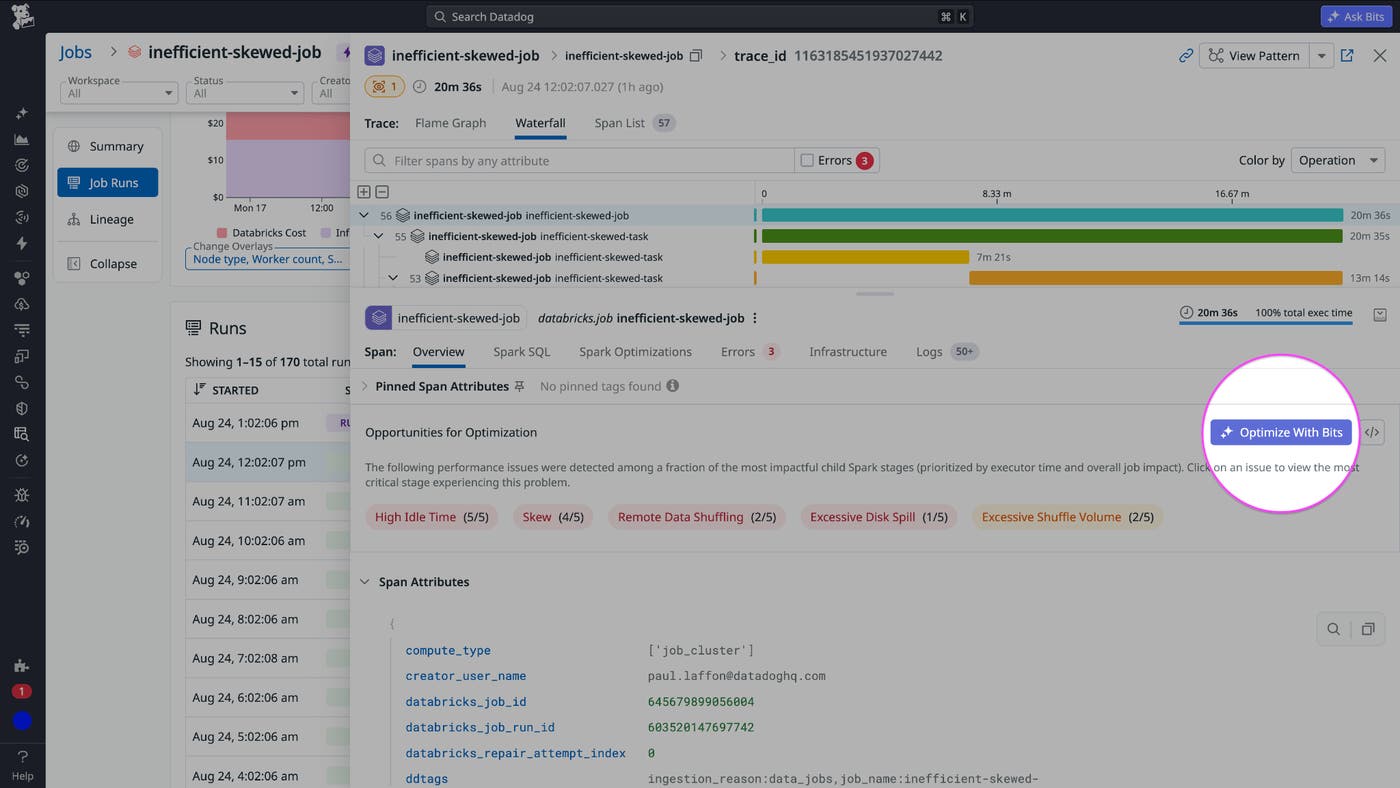
Meanwhile, when your jobs are running smoothly, Jobs Monitoring can help you control their costs. For example, you can select any job from the job list to ask Bits AI how to optimize its performance:
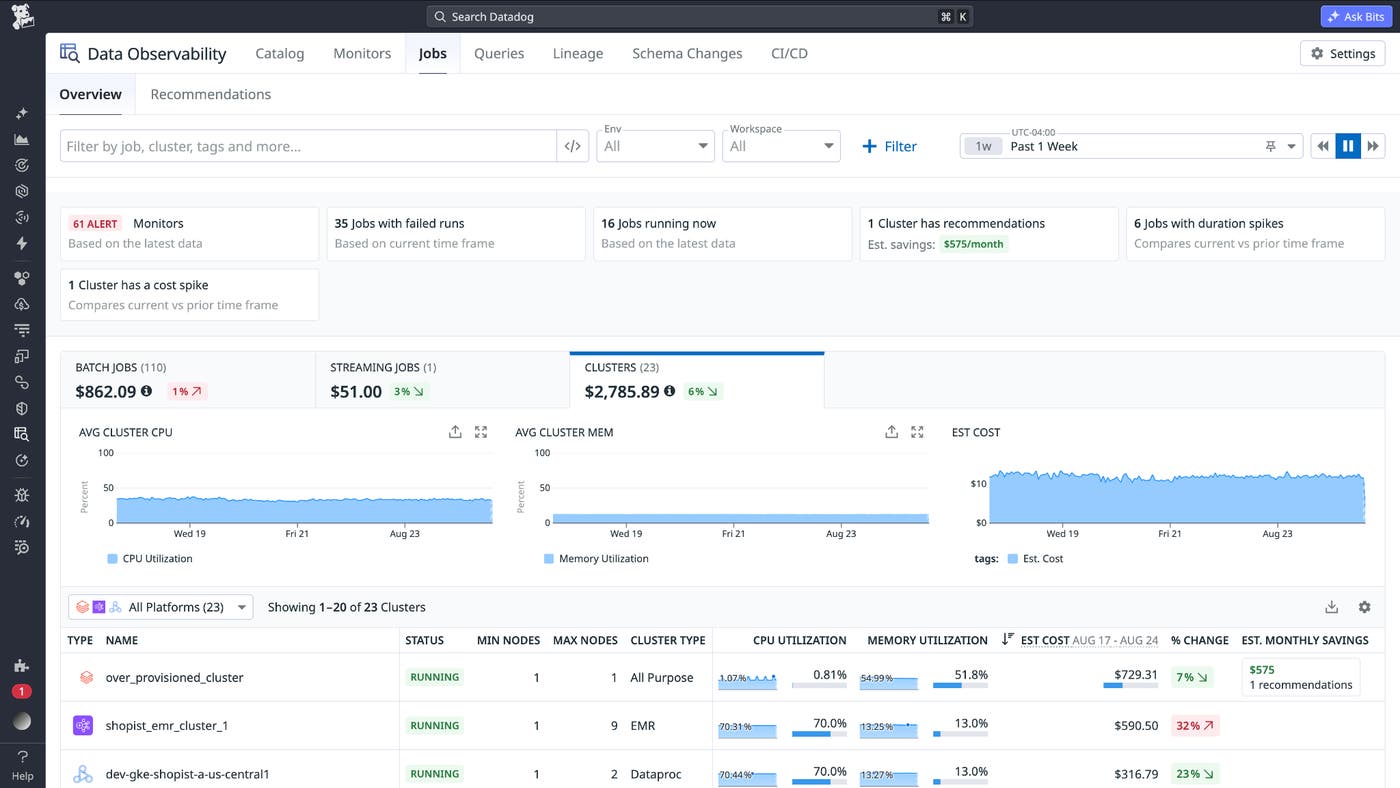
From the Clusters tab, you can monitor the resource usage and costs of each of your Databricks clusters, enabling you to optimize performance and rein in spend by quickly spotting resource contention or overprovisioning.
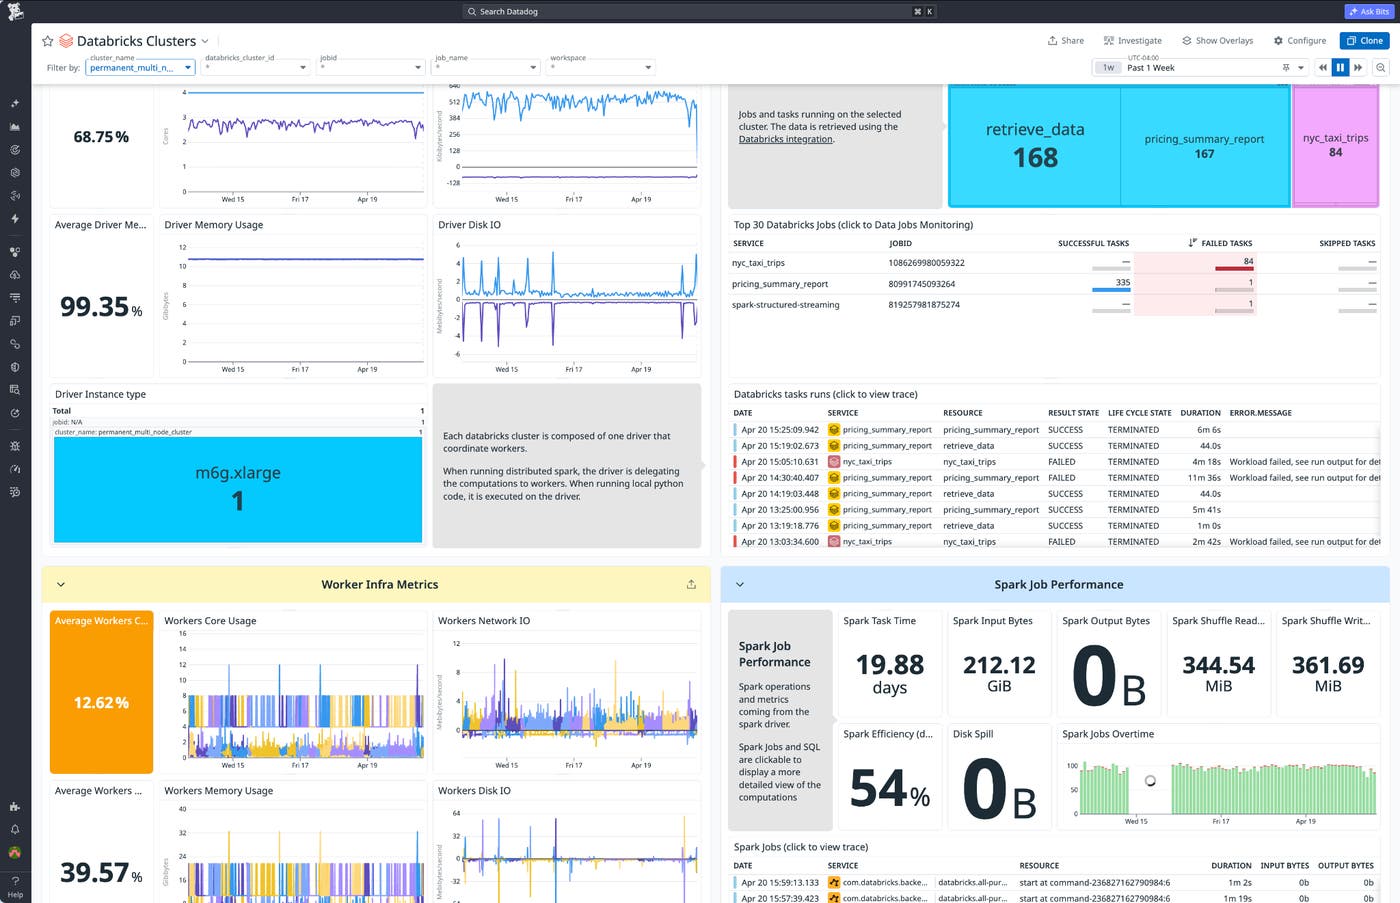
You can also drill deeper into any cluster from the list by selecting it and accessing its ready-made dashboard, which includes a wide range of metrics on Databricks and Spark job performance and resource usage.
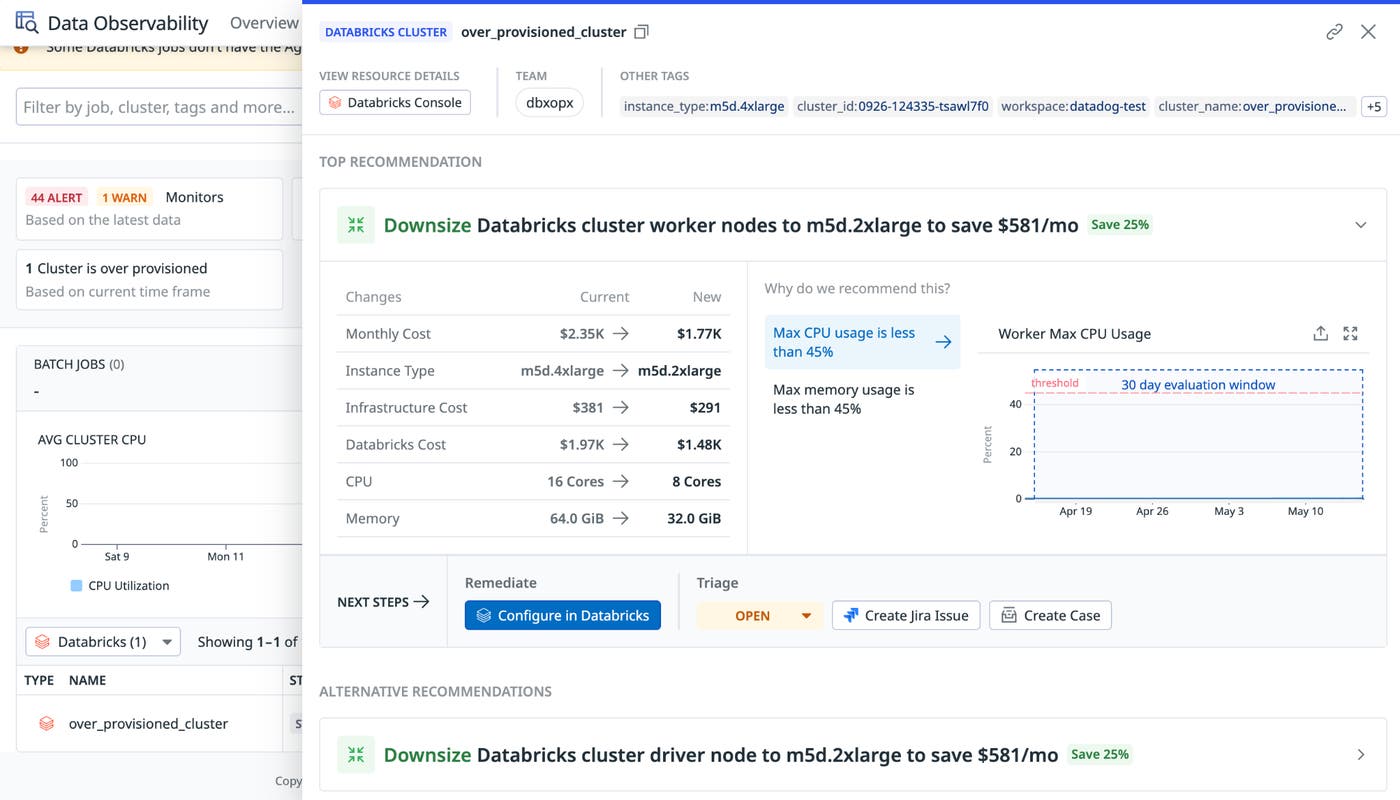
Jobs Monitoring surfaces actionable, per-cluster rightsizing recommendations—such as projected monthly savings, specific instance-type changes to make, and the compute utilization evidence behind these calls—and lets you turn them directly into Jira issues or remediate them in the Databricks console.
Catch and fix data quality issues with Data Observability
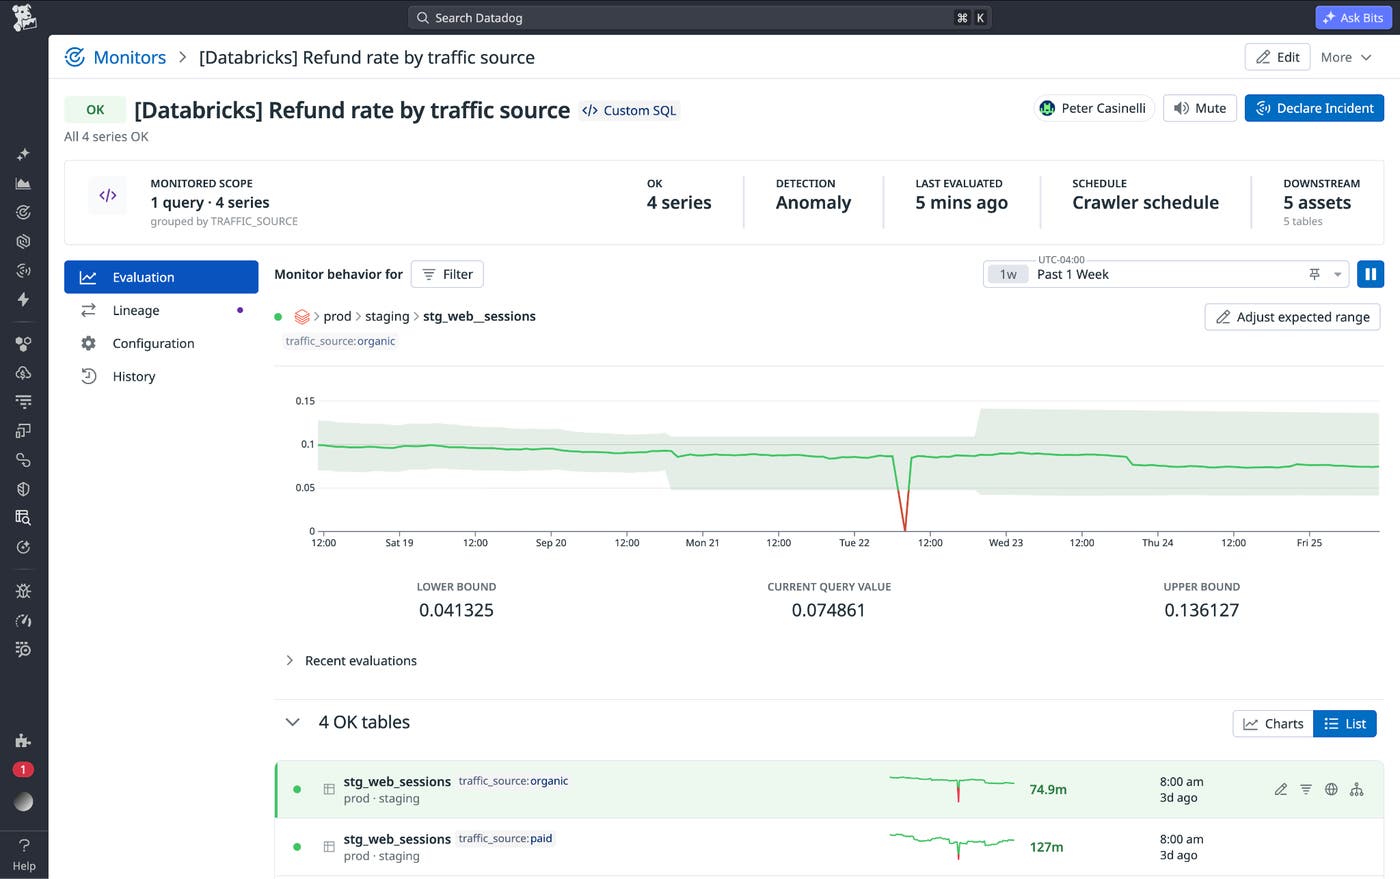
Alongside Jobs Monitoring, Datadog Quality Monitoring can help you track data quality and lineage in your Delta and Unity Catalog tables to detect and troubleshoot changes in data patterns that job- or cluster-level signals may not surface. With this monitoring in place, you can prevent these changes from impacting your ML models, dashboards, and other downstream systems. Quality Monitoring provides Data Observability monitors for continuous, end-to-end tracking of data freshness, volume, column metrics, and custom rule violations. These monitors use anomaly detection as well as threshold-based rules.
Quality Monitoring also collects Databricks lineage via the system.query.history table. The OpenLineage Spark integration, installed on your Databricks classic compute clusters, adds Spark-level lineage via Jobs Monitoring, so you can trace quality alerts back to the responsible Spark jobs and transformations.
For streaming data pipelines, you can use Datadog Data Streams Monitoring (DSM). DSM automatically maps the services and queues in your streaming pipelines and tracks end-to-end performance, so you can quickly gauge latency between any two points, pinpoint faulty consumers, producers, and queues, and troubleshoot bottlenecks.
The DSM map also surfaces failing Spark jobs, so when upstream Kafka lag or schema changes cascade into Databricks job failures, you can correlate the two immediately, without context switching.
Monitor Databricks Model Serving endpoints
Model Serving endpoints answer real-time inference requests and must scale elastically with demand. Degraded endpoints can directly affect the applications that depend on them.
The Databricks integration surfaces Model Serving endpoint health through metrics such as endpoint latency, throughput, 4xx and 5xx error counts, CPU and memory utilization, and GPU utilization and memory. These metrics flow into the prebuilt Model Serving dashboard.
You can alert on these signals to track server-side (5xx) errors indicating model crashes or infrastructure failures, tail (p99) latency pointing to autoscaling lag or endpoint pressure, and GPU memory saturation that may lead to out-of-memory crashes. Because the metrics live alongside your job and cluster data, you can correlate endpoint issues with the runs behind them. For example, you can trace latency spikes back to model-refresh jobs or GPU memory ceilings reached during traffic surges without leaving Datadog. The integration also includes Model Serving monitor templates, so you can start alerting on endpoint health issues without building monitors from scratch.
Finally, you can instrument the apps calling your Model Serving endpoints with Datadog Agent Observability to capture prompts and responses, token usage, and latency.
Track and attribute Databricks costs with Cloud Cost Management
Databricks enables cost tracking via system tables, but it can be easy to lose track of what’s driving DBU consumption at scale.
Earlier in this post, we touched on how you can use Jobs Monitoring to monitor the cost efficiency of your Databricks resource usage. Datadog CCM complements this visibility by contextualizing your Databricks spend within your total cloud and SaaS costs. It factors in your discount rates so that DBU consumption reflects what you actually pay rather than list price, attributes your spend to teams based on your tags, spotlights cost anomalies, and provides cost-optimization recommendations, including those from Jobs Monitoring.
You can use custom metrics to track the costs of each ML training run or ETL query, easily determining what’s driving costs. For example, you might use a custom metric for the number of inferences returned by a specific Model Serving endpoint, then calculate the cost of each inference by dividing that endpoint’s DBU and underlying infrastructure costs by that metric on a dashboard. By breaking the cost down by model version, you can immediately spot when a new model version drives up inference costs. You can also use CCM to stay ahead of unexpected costs: Use Cloud Cost monitors to detect drift and CCM Forecasting to project costs as workloads scale.
Contextualize your telemetry data with Reference Tables
Datadog Reference Tables allow you to enrich your telemetry data by importing metadata from your Databricks workspaces and mapping business data (such as team, customer, checkout_id, or business_unit) or operational identifiers (cluster and job IDs) onto your logs, metrics, and events. You can also join Reference Tables with metrics and query them in Sheets, the DDSQL Editor, and Notebooks.
Reference Tables enhance otherwise opaque signals with detailed context you can filter, group, and route on. You can use that context to determine who to contact in the event of an incident, attribute costs, scope dashboards and alerts to the relevant teams, and detect permissions drift and misconfigurations.
Comprehensively monitor your data and AI/ML workloads with Datadog
In this post, we’ve shown how you can use Datadog to comprehensively monitor Databricks performance, costs, and infrastructure. With the Databricks integration, Data Observability, and Cloud Cost Management, you can monitor your jobs, clusters, pipelines, and Model Serving endpoints alongside telemetry from upstream and downstream data pipelines and the rest of your distributed systems. To get started, check out the documentation for the Databricks integration. If you’re brand new to Datadog, you can sign up for a 14-day free trial.
