

Aaron Kaplan
Technical Content Writer

Ryan Warrier
Senior Product Manager
Databricks is a platform for analytics, AI, and data intelligence that has pioneered the lakehouse paradigm in modern data systems. Lakehouses combine the main virtues of data lakes and warehouses: They support ACID transactions and strong, dynamic governance and integrity controls for vast collections of arbitrary (structured, semi-structured, and unstructured) data; are open-format, providing direct, flexible data access by a wide range of tooling (with built-in support for BI tools and SQL); and use cost-efficient object storage decoupled from compute for robust scalability.
Databricks builds on these strengths to provide managed data infrastructure for diverse analytics, data management, and AI workloads. It enables entire organizations to orient their work around a single source of truth, harmonizing the efforts of data and ML engineers, data scientists, business analysts, and application developers. It also enables enterprise-scale management of end-to-end pipelines, governance, warehousing, BI, and agent/model development and deployment through a shared hub.
Monitoring is essential to optimizing the health and performance of your Databricks workloads and preventing runaway costs. In this series of blog posts, we’ll guide you through monitoring the health, performance, and costs of Databricks data engineering, analytics, and Model Serving workloads. (We’ll cover the broader range of Mosaic AI capabilities in a separate series of posts on monitoring AI in Databricks.) This post will cover:
How Databricks works
We’ll start by surveying the fundamentals of Databricks health and performance and the scope of its observability.
Platform architecture
Teams access their resources in Databricks through collaborative environments called workspaces. The main divisions of the workspace are the control and compute planes.
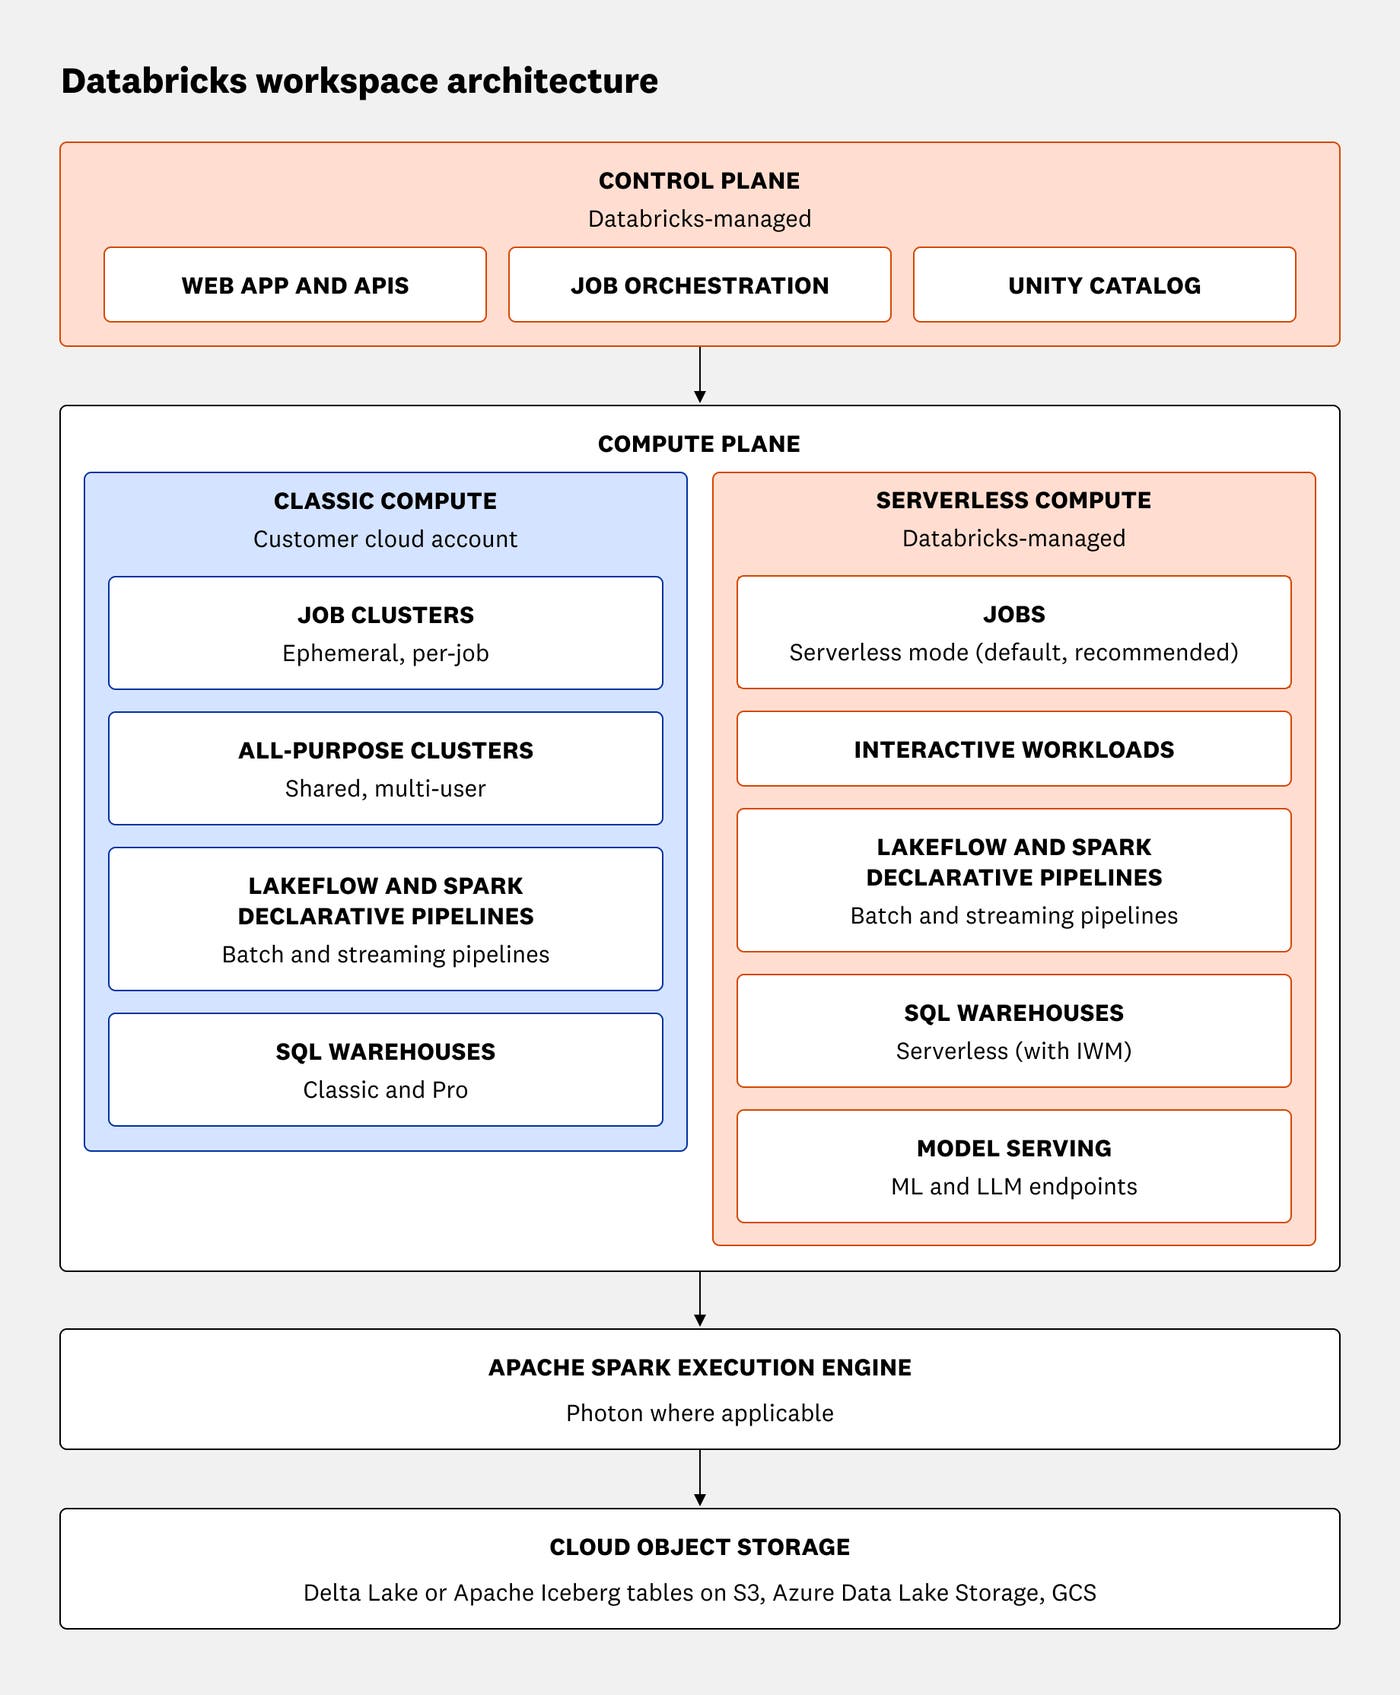
The control plane spans the Databricks web application, APIs, backend services responsible for orchestration, and Unity Catalog, a data governance solution. The control plane is a source of important visibility, including data lineage and operational telemetry (e.g., query history and cost records).
The compute plane is where data processing happens: all reading from and writing to the underlying storage, typically cloud object storage, in which data is persisted in Delta Lake or Apache Iceberg tables.
Databricks provides two options for compute. Classic compute runs in customer cloud accounts, enabling access to host-level compute and network metrics, direct collection of execution logs, and installation of monitoring agents. Serverless compute is Databricks-managed: There is no host access and no monitoring agent installation, so monitoring relies on system tables for query-level telemetry and warehouse events.
The compute plane runs four primary types of workloads: jobs, Spark Declarative Pipelines, SQL warehouses, and Model Serving. Classic compute workloads run on user-managed all-purpose (collaborative) and job-specific (ephemeral) clusters, while serverless compute uses Databricks-managed clusters.
In Databricks, jobs are units of data processing work that can be scheduled or conditionally triggered, and each job comprises an arbitrary number of tasks, such as running SQL queries, Python scripts, or dbt projects, implementing some conditional logic, or refreshing dashboards. Spark Declarative Pipelines (SDP) is a framework for batch and streaming pipelines; Databricks offers Lakeflow SDP, which extends Apache Spark Declarative Pipelines, facilitates data quality checks, and uses a performance-optimized Databricks Runtime. SQL warehouses serve interactive queries for data exploration and BI via Databricks SQL; Databricks offers several types of SQL warehouses optimized for different use cases and generally recommends running them via serverless compute. Model Serving is the provision of managed endpoints for AI/ML model deployment, governance, and querying; Databricks Model Serving supports autoscaling and exposes performance metrics.
Under the hood, Databricks jobs, SDP, and SQL warehouses use Apache Spark as an execution engine. Spark applications divide work into jobs, stages, and tasks. In Spark, as in Databricks, tasks are the smallest unit of processing work and jobs are larger units, but Spark also has the stage as an intermediary unit: jobs are composed of stages, and stages consist of one or more tasks based on shuffles, which are redistributions of data across partitions as required by various processing operations.
Key Databricks metrics to monitor
The performance and costs of Databricks analytics and AI/ML workloads are affected by a wide range of variables. In this section, we’ll cover the metrics that are essential to maintaining performant, high-availability Databricks processing jobs, pipelines, SQL warehouses, and Model Serving endpoints, as well as to tracking costs.
Job and pipeline metrics
The impact of failed or slow jobs and pipelines can propagate and compromise downstream data freshness and integrity. Use the following metrics to track whether your job and SDP workloads are completing successfully and on time.
| Metric | Description | Metric type |
|---|---|---|
Job run results (system.lakeflow.job_run_timeline.result_state) | Whether a job run succeeded, failed, timed out, or was blocked or skipped. | Work: Errors |
Job run durations (system.lakeflow.job_run_timeline.period_start_time, period_end_time) | Time from job start to completion. | Work: Performance |
Task failure count (system.lakeflow.job_task_run_timeline.result_state) | Number of failed tasks within a job run. | Work: Errors |
Pipeline event errors (system.lakeflow_pipeline_events_preview.pipeline_events) | Errors and data quality check failures from SDP event logs. Note: this table is in Beta at time of publication. | Work: Errors |
Metric to alert on:
system.lakeflow.job_run_timeline.result_state. Failed jobs can have cascading downstream impact—stale dashboards, broken pipelines, and missed SLAs—so set alert conditions based on job result state values (for failed, timed-out, skipped, and blocked jobs, as well as those completed with errors).Metrics to alert on:
system.lakeflow.job_run_timeline.period_start_timeandperiod_end_time. Track job durations (end times minus start times) against historical baselines to catch regressions from code changes, data growth, or resource saturation and to ensure data freshness.Metric to watch: pipeline event errors. SDP event logs surface errors, quality check failures, and more; generate metrics from these logs and alert on them to catch upstream issues such as schema drift.
Spark execution metrics
Use the following metrics to troubleshoot degraded job or query performance by analyzing execution. For classic compute, these metrics are available through the Spark metrics system; with serverless compute, these signals surface in query insights and traces.
| Metric | Description | Metric type |
|---|---|---|
Stage/task duration (spark.stage.executor_run_time) | Time spent executing individual stages and tasks. | Work: Performance |
Failed task count (spark.stage.num_failed_tasks) | Number of tasks that fail within a stage. | Work: Errors |
Shuffle read/write (spark.stage.shuffle_read_bytes, spark.stage.shuffle_write_bytes) | Volume of data read and written during shuffle operations. | Resource: Utilization |
Shuffle spill (memory and disk) (spark.stage.memory_bytes_spilled, spark.stage.disk_bytes_spilled) | Data that couldn’t fit in memory during shuffle and was written to disk. | Resource: Saturation |
GC time (spark.executor.peak_mem.major_gc_time, spark.executor.peak_mem.minor_gc_time) as a % of task time (spark.stage.executor_run_time) | Fraction of task time spent in JVM garbage collection. | Resource: Saturation |
Executor memory utilization (spark.executor.memory_used out of spark.executor.max_memory) | Memory used vs. memory available across executors. | Resource: Utilization |
Metric to alert on: (spark.executor.peak_mem.major_gc_time+ minor_gc_time) per spark.stage.executor_run_time. Sustained high GC is the primary indicator that executor memory is under pressure, which can ultimately lead to task failure; alert when the percentage of GC time per task time exceeds expected thresholds (e.g., 10% of task time).
Metric to alert on:
spark.stage.disk_bytes_spilled. When Spark can’t fit shuffle data in memory, it spills to disk, compromising performance. This may signal the need to resize executors, repartition data, or retool transformations.
SQL warehouse metrics
Slow warehouse queries have an immediate impact on users. These metrics provide visibility into the full query life cycle and the corresponding warehouse autoscaling behavior; use them to rightsize your warehouses and optimize query patterns.
| Metric | Description | Metric type |
|---|---|---|
Queue wait time (system.query.history.waiting_at_capacity_duration_ms) | Time a query spends waiting before execution begins. | Work: Performance |
Query latency (p50/p90/p99) (system.query.history.total_duration_ms) | Distribution of query execution times. | Work: Performance |
Scaling events (system.compute.warehouse_events.event_type = SCALED_UP or SCALED_DOWN) | Autoscaling-driven cluster additions/removals. | Resource: Utilization |
Bytes scanned (system.query.history.read_bytes) | Volume of data processed per query. | Work: Throughput |
Metric to alert on:
system.query.history.waiting_at_capacity_duration_ms. Queue pressure is a leading signal of resource exhaustion; for serverless compute, sustained rises in wait time indicate that autoscaling cannot keep up with demand and potentially the need to increase warehouse sizes.Metrics to alert on:
system.query.history.total_duration_ms, since high-latency queries may result from plan and schema changes or data growth, andsystem.query.history.read_bytes, a strong measure of SQL efficiency—per-query spikes may indicate missing partitioning, dropped filters, or schema changes.
Streaming metrics
Use the following metrics to track the performance of Spark Structured Streaming jobs running on Databricks (using either classic or serverless compute) and ensure that your pipelines are keeping up with incoming data.
| Metric | Description | Metric type |
|---|---|---|
Input rate (spark.structured_streaming.input_rate) vs. processing rate (spark.structured_streaming.processing_rate) | Rows ingested vs. rows processed per micro-batch. | Work: Throughput |
Trigger/batch duration (spark.structured_streaming.latency) | Time to process each micro-batch. | Work: Performance |
| Consumer offset lag (source-dependent) | Distance between the latest available offset and the last committed offset. | Work: Throughput |
Auto Loader backlog (sources.metrics.numFilesOutstanding, sources.metrics.numBytesOutstanding) | Pending files or bytes for Auto Loader or file-based ingestion. | Resource: Saturation |
Metrics to alert on:
spark.structured_streaming.input_rateandspark.structured_streaming.processing_rate. Increases in input rate over processing rate are the primary indicator of backpressure: when processing falls behind ingestion, lag accumulates and downstream data becomes stale, so alert when the gap persists across multiple trigger intervals.Metrics to alert on (for file-based ingestion):
sources.metrics.numFilesOutstandingandsources.metrics.numBytesOutstanding. Track pipeline performance falling behind data arrival and preempt impact on downstream consumers.Metric to alert on:
spark.structured_streaming.latency. When this metric exceeds the trigger interval, it may signal degradation due to data growth, schema changes, or source-side throttling.
Classic compute infrastructure metrics
These metrics apply to all classic compute. They are available via the system.compute.node_timeline (minute-granularity utilization data) and system.compute.instance_events (state-transition events) system tables for all-purpose, jobs, and SDP compute. For classic SQL warehouses, disk I/O throughput and latency, or higher-resolution data, monitor via agents installed on your infrastructure or via cloud-provider host metrics. Use these metrics to track compute health and performance and to identify failure modes that Spark- and Databricks-level signals don’t expose, such as network throttling and Spot Instance interruptions.
| Metric | Description | Metric type |
|---|---|---|
CPU utilization (system.compute.node_timeline.cpu_user_percent, cpu_system_percent, cpu_wait_percent) | Processor load by mode (user, system, I/O wait). | Resource: Utilization |
Memory used (%) (system.compute.node_timeline.mem_used_percent) | Physical memory in use across nodes. | Resource: Utilization |
Network throughput (system.compute.node_timeline.network_sent_bytes, network_received_bytes) | Bytes sent/received per node. | Resource: Utilization |
Cluster/instance state transitions (system.compute.instance_events.event_type, state) | Starts, scaling events, terminations, and interruptions. | Resource: Availability |
| Disk I/O throughput and latency (via hosts) | Read/write volume and response time for local storage. | Resource: Utilization |
Metric to alert on: CPU utilization (
system.compute.node_timeline.cpu_wait_percent). High iowait points to compute bottlenecks; on Spark executor nodes, it often accompanies shuffle spill or heavy reads from cloud storage.
Model Serving metrics
Model Serving endpoints answer real-time inference requests and must scale elastically with demand. Use these metrics to track endpoint health and performance.
| Metric | Description | Metric type |
|---|---|---|
Request count (databricks.model_serving.request_count_total) | Total requests per minute to the endpoint. | Work: Throughput |
Request latency (databricks.model_serving.request_latency_ms.XXpercentile) | Latency distribution in milliseconds. | Work: Performance |
4xx error count (databricks.model_serving.request_4xx_count_total) | Client-side errors per minute. | Work: Errors |
5xx error count (databricks.model_serving.request_5xx_count_total) | Server-side errors per minute. | Work: Errors |
CPU usage (%) (databricks.model_serving.cpu_usage_percentage) | Average CPU utilization across all replicas. | Resource: Utilization |
Memory usage (%) (databricks.model_serving.mem_usage_percentage) | Average memory utilization across all replicas. | Resource: Utilization |
GPU utilization (avg/min/max) (databricks.model_serving.gpu_usage_percentage.avg, .min, .max) | Compute utilization across all GPUs. | Resource: Utilization |
GPU memory usage (avg/min/max) (databricks.model_serving.gpu_mem_usage_percentage.avg, .min, .max) | Memory utilization across all GPUs. | Resource: Utilization |
Provisioned concurrent requests (databricks.model_serving.provisioned_concurrent_requests_total) | Number of provisioned concurrency slots. | Resource: Utilization |
Metric to alert on:
databricks.model_serving.request_5xx_count_total. Server-side errors indicate endpoint health failures such as model crashes, out-of-memory errors, or infrastructure failures.Metric to alert on:
databricks.model_serving.request_latency_ms.99percentile. Tail latency spikes indicate autoscaling lag or endpoint pressure, so correlate them with CPU and GPU utilization to distinguish resource-level issues from model-level ones.Metric to watch:
databricks.model_serving.gpu_mem_usage_percentage.max. GPU memory exhaustion can lead to model crashes and 5xx errors. If it approaches 100%, you may need larger instances or updated request batching.Metrics to watch:
databricks.model_serving.request_count_totalanddatabricks.model_serving.provisioned_concurrent_requests_total. If request volume approaches or exceeds provisioned concurrency, you may need to scale up endpoints or adjust concurrency configuration.
Cost metrics
Databricks compute is elastic, billed per second in Databricks Units (DBUs), and supports various workload types, each with its own pricing and scaling behaviors—which can make it easy to lose track of costs. Use these metrics to monitor costs and preempt overruns.
| Metric | Description | Metric type |
|---|---|---|
DBU consumption (system.billing.usage.usage_quantity) | DBUs consumed. | Resource: Utilization |
Estimated cost (system.billing.usage joined to system.billing.list_prices) | DBU consumption converted to spend using current SKU prices. | Resource: Utilization |
Metric to alert on: cost anomalies (from
system.billing.usageandsystem.billing.list_prices). Use threshold- or trend-based alerts to preempt runaway costs from misconfigured clusters, excessive retries, or unoptimized jobs.
Gain visibility into your analytics and AI infrastructure
In this post, we surveyed the conceptual foundations and key metrics for monitoring the health and performance of Databricks data engineering, analytics, and Model Serving workloads. Next, we’ll discuss Databricks’ native monitoring resources.
