


Get started with Datadog Synthetic Monitoring
Explore and register for Foundation Enablement sessions. Learn how Datadog Synthetic Monitoring is a proactive monitoring solution that enables you to create code-free...
Catch broken journeys before your customers do
Automatically discover, verify, and debug the user journeys that drive your business, all in one platform.


End-to-end testing across every layer
Protect the experiences your revenue depends on. Generate coverage automatically, verify outcomes rather than endpoints, and go from alert to root cause in minutes.
Automate your test coverage
Close coverage gaps, including the ones you didn’t know you had. Automatically cover the workflows that matter across browser, API, and network, so coverage expands with every release.
Jump from alert to root cause
Trust your alerts again. Know whether a failure is real, flaky, or a misconfiguration the moment a test completes, then get an evidence-backed root cause in minutes.
Prove business impact
Connect what you test to what the business measures. Get uptime SLOs on the workflows your business runs on, with no setup and historical trends from day one, so reliability reporting stops being something you assemble by hand.
Datadog automatically brings frontend, API, and network testing into one view for each user workflow. Every result connects to the traces, logs, and infrastructure metrics behind it, so a failing test points straight at what caused it.

From test creation to resolution
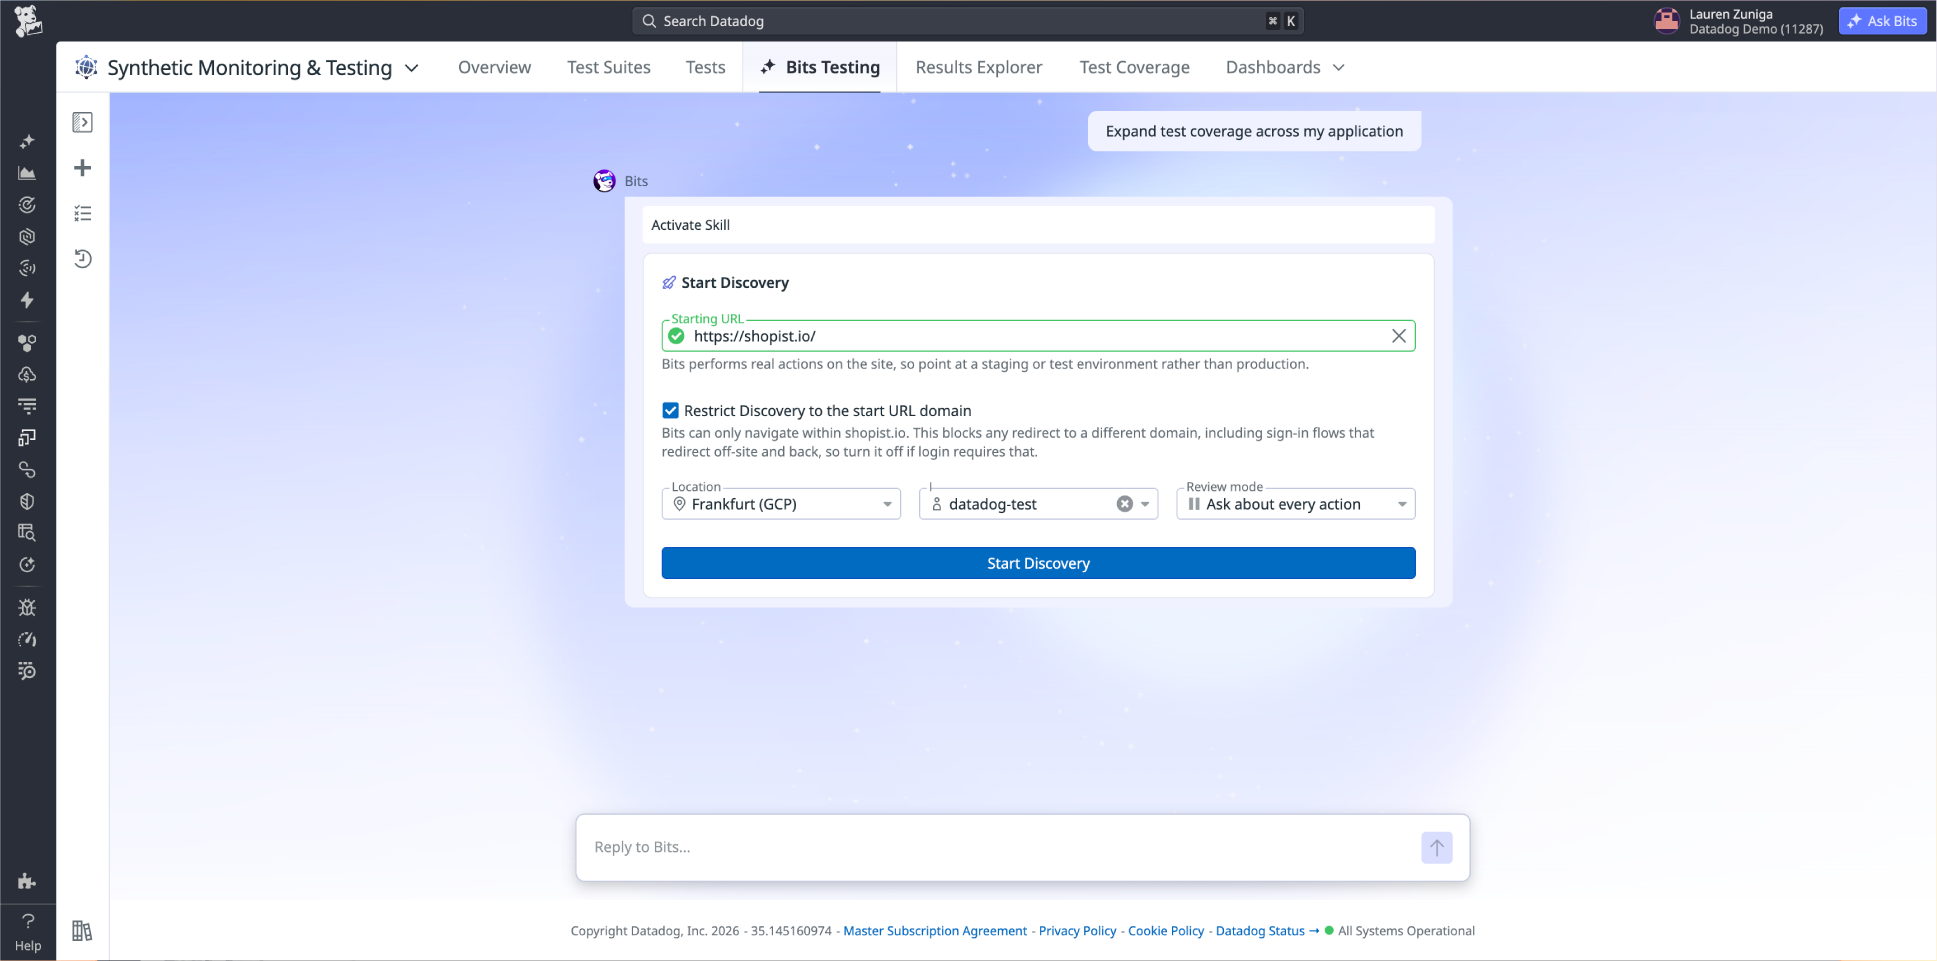
Build coverage
Measure uptime against the workflows that drive revenue
SLOs generate automatically against your critical user workflows, with no manual setup, no custom queries, and no ongoing maintenance. Reliability is measured the way customers experience it.
Move from pass/fail to error budgets
When your error budget tracks workflow availability, teams prioritize what actually affects customers instead of chasing system-level metrics that don't reflect real user experience.
Give every stakeholder a shared view of reliability
Unified dashboards surface test health, workflow availability, and AI-driven coverage insights in one place, tailored to any audience from on-call engineers to executive leadership.
Test every layer
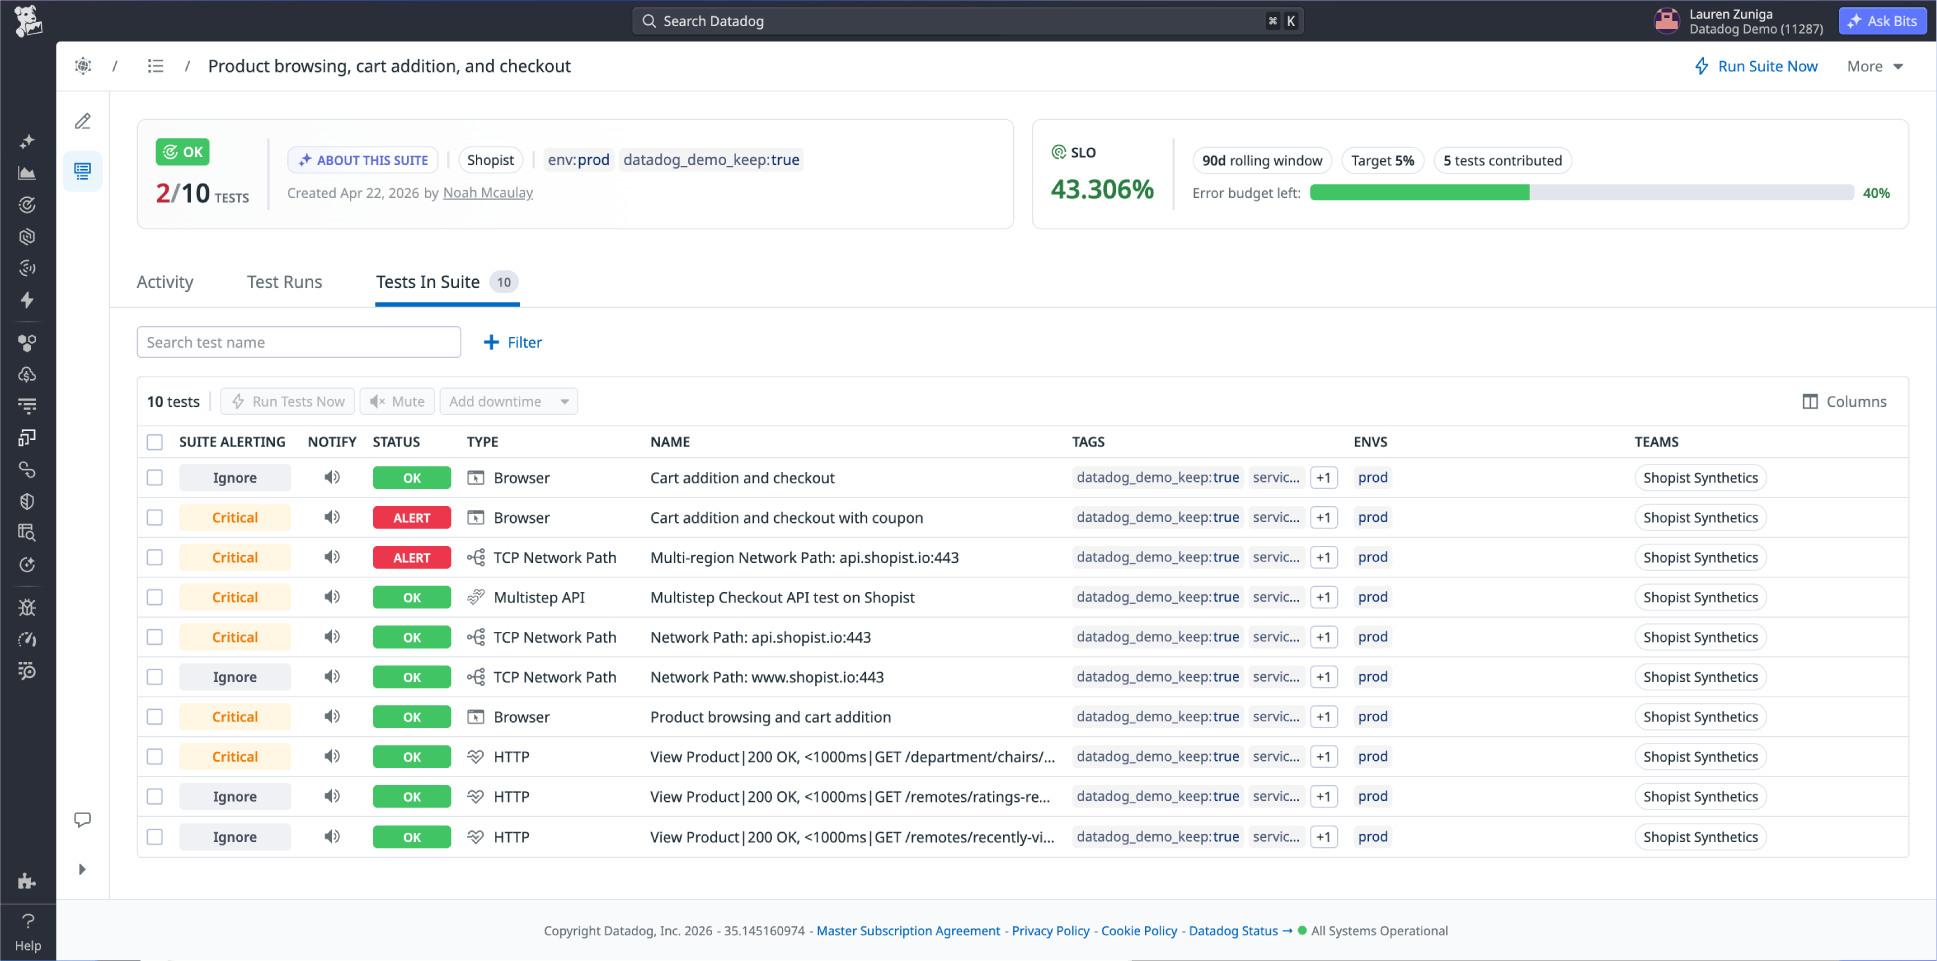
Catch failures that hide across layers
Test Suites aggregate browser, API, and network tests into a single unit per workflow, so failures get caught before customers feel them.
Validate what users need to accomplish
Define the outcome you need users to achieve, like completing a checkout or finishing onboarding and Bits Testing discovers the relevant paths to test.
Alert on workflow failures
Suite-level alerting fires when a meaningful portion of critical tests fail, replacing a flood of disconnected notifications with one clear, actionable signal.
Diagnose failures
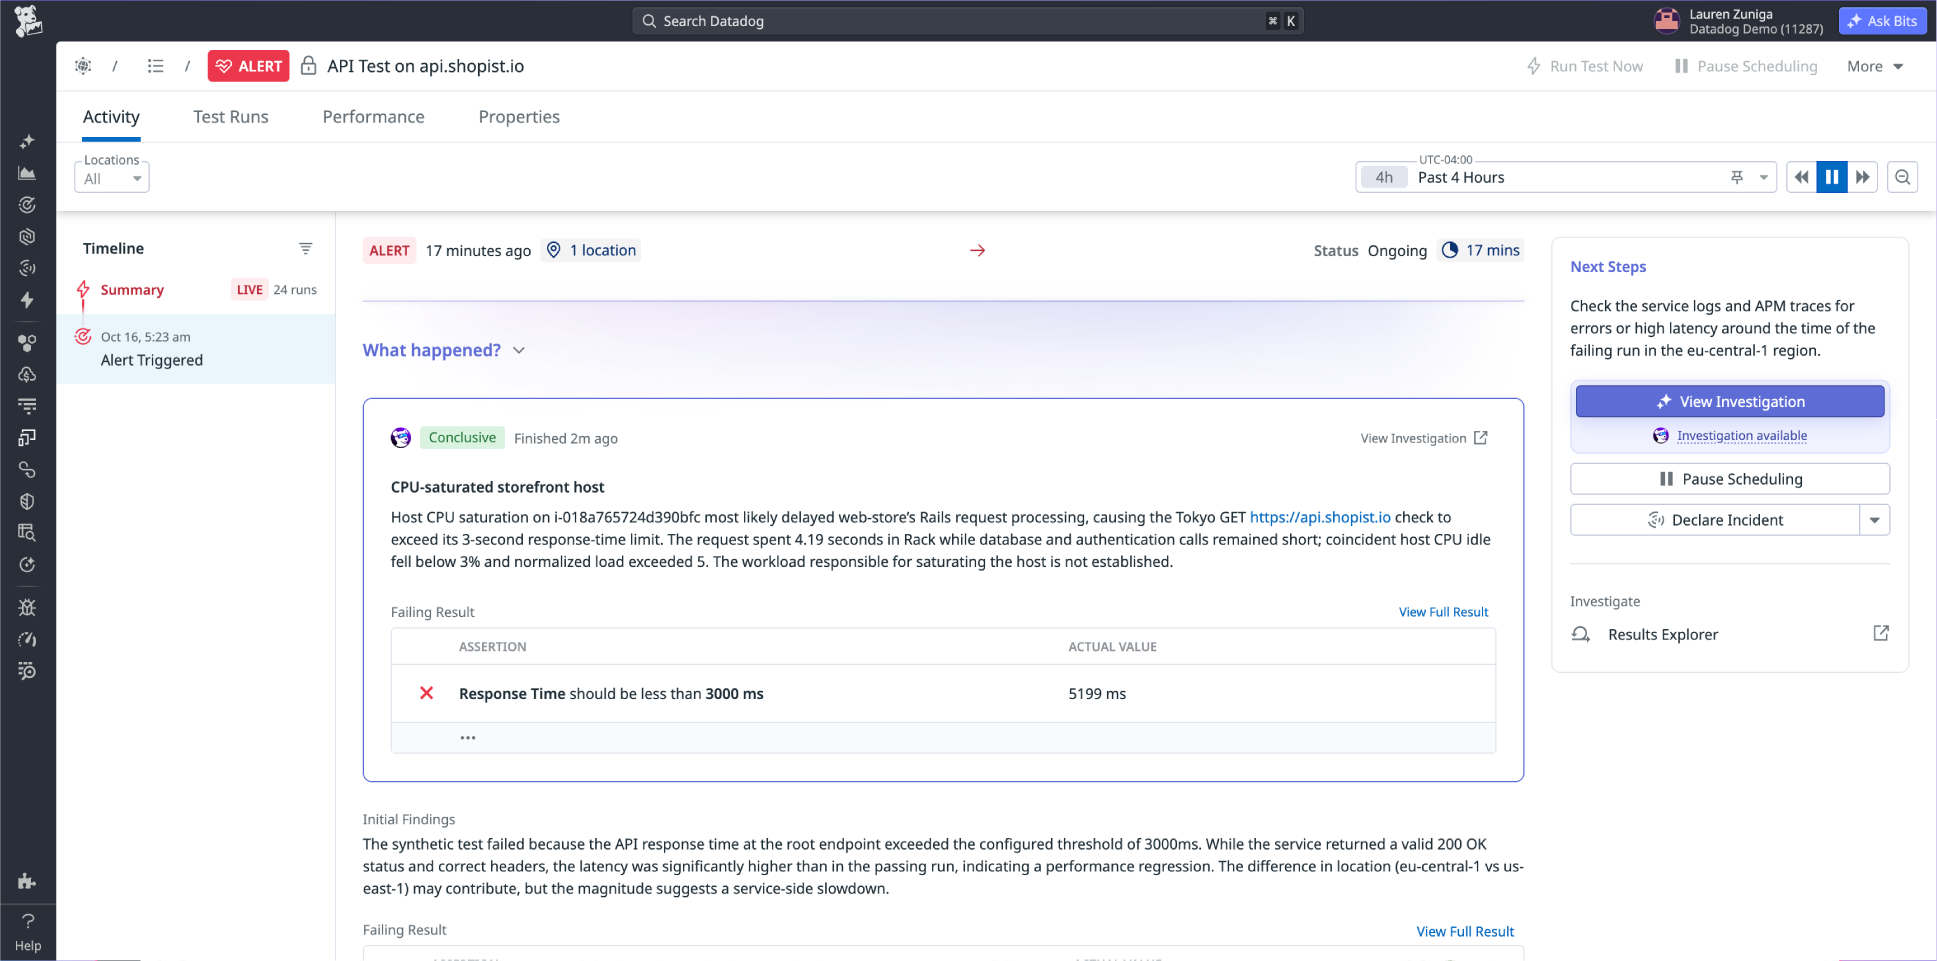
Know immediately whether a failure is real
AI-powered rich test results classify every failure the moment a test completes as a real regression, a flaky test, or a misconfiguration, so your team only investigates what matters.
Drill into test failures
Open a failed test to see the APM trace, RUM session, error logs, and infrastructure metrics for the exact request it fired, alongside step-level screenshots and video replay.
Get to root cause in minutes
Bits Investigation autonomously correlates test results, APM traces, logs, and infrastructure data, surfacing a root cause with tested hypotheses and recommended next steps.
Measure availability
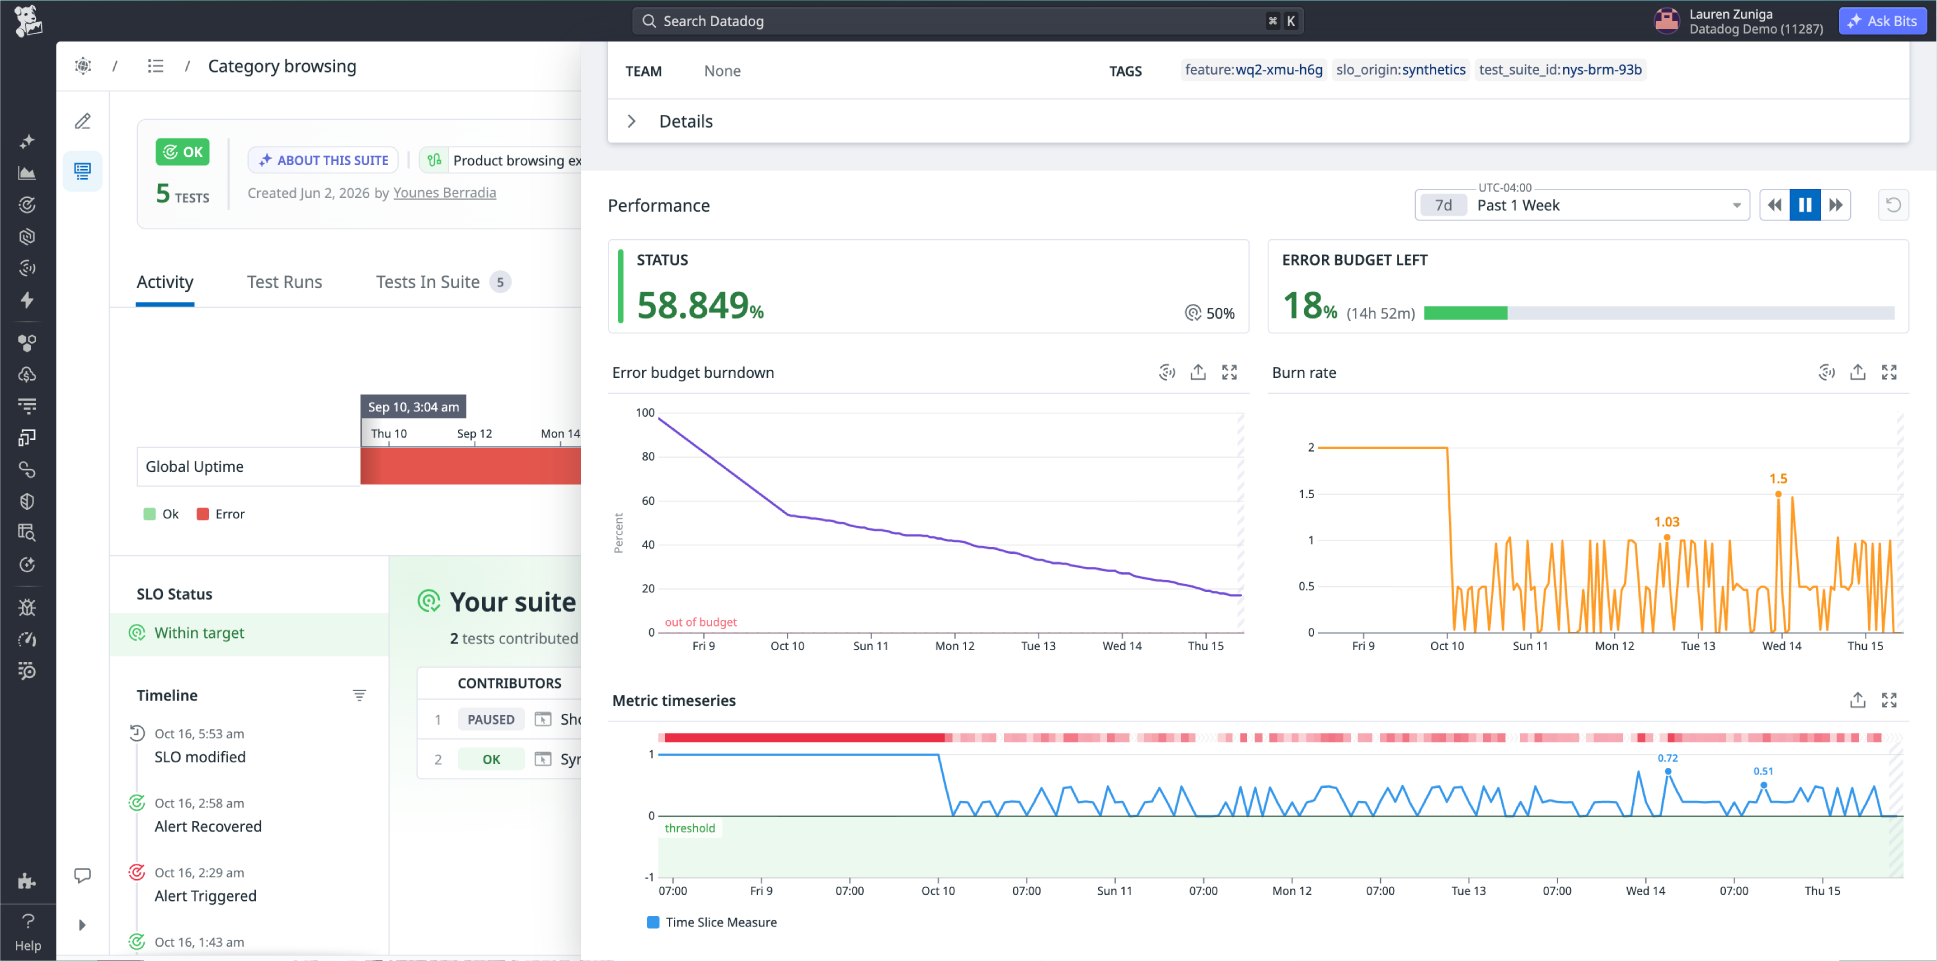
Measure uptime against the workflows that drive revenue
SLOs generated automatically against your critical user workflows, with no manual setup, no custom queries, and no ongoing maintenance. Reliability is measured the way customers experience it.
Move from pass/fail to error budgets
When your error budget tracks workflow availability, teams prioritize what actually affects customers instead of chasing system-level metrics that don't reflect real user experience.
Give stakeholders a clear view of reliability over time
A unified report tracks SLO performance over time across test health and workflow availability, filtered by team, service, environment, or workflow.
Test configuration, locations, CI/CD integration, and the full API reference
Built for every team behind the user experience
Give every team the context they need to expand coverage, resolve failures faster, and prove that the workflows your business runs on are working.


Usage-based pricing per test run, with no per-user fees
Resources
Start testing the flows your customers depend on