Data Observability Overview
Learn how Data Observability (DO) helps data teams improve the reliability of data for analytics and AI applications and optimize the performance and costs of data pipelines.
Ensure trust in your data from pipelines to prompts
Detect, resolve, and optimize data quality and pipeline issues before they undermine AI models and impact business decisions — all in one place.

End-to-end observability across the full data lifecycle
Safeguard the data your business depends on. Catch data issues early, resolve them faster, and optimize pipeline cost and performance.

Detect Data Quality & Pipeline Issues Early
Catch data quality issues and pipeline failures before they reach stakeholders, undermine AI models and impact business decisions.

Pinpoint Root Causes With End-to-End Lineage
Resolve data incidents faster with full visibility into upstream services and downstream AI models and BI tools.

Control Costs With Optimization Recommendations
Eliminate wasted spend and improve pipeline efficiency with actionable recommendations for jobs, clusters, and queries.

Break Down Silos Across Data & DevOps
Connect data health, pipeline execution, application traces, and infrastructure metrics so Data and DevOps teams resolve incidents together, not in parallel.
Datadog doesn't just monitor your data stack. It connects data health to job execution, infrastructure metrics, and application performance in context — so you're not just finding where data broke, you're understanding why.

Built for every team that touches data
From pipelines to prompts, get the visibility your team needs to detect issues early, resolve them faster, and ensure trust in the data your stakeholders depend on.


Highlighted in Gartner’s 2026 Data Observability Market Guide
Everything you need to deliver reliable data
Detect silent data issues
Intelligent anomaly detection
Detect data quality issues before stakeholders do with anomaly detection that learns from the data in your stack – adapting to seasonality, trends, and user annotations
Schema change tracking
Eliminate silent failures with automatic schema change detection across your most critical tables and warehouses.
Real-time pipeline monitoring
Catch pipeline failures first with real-time monitoring of failed, delayed, and long-running jobs.
Accelerate remediation
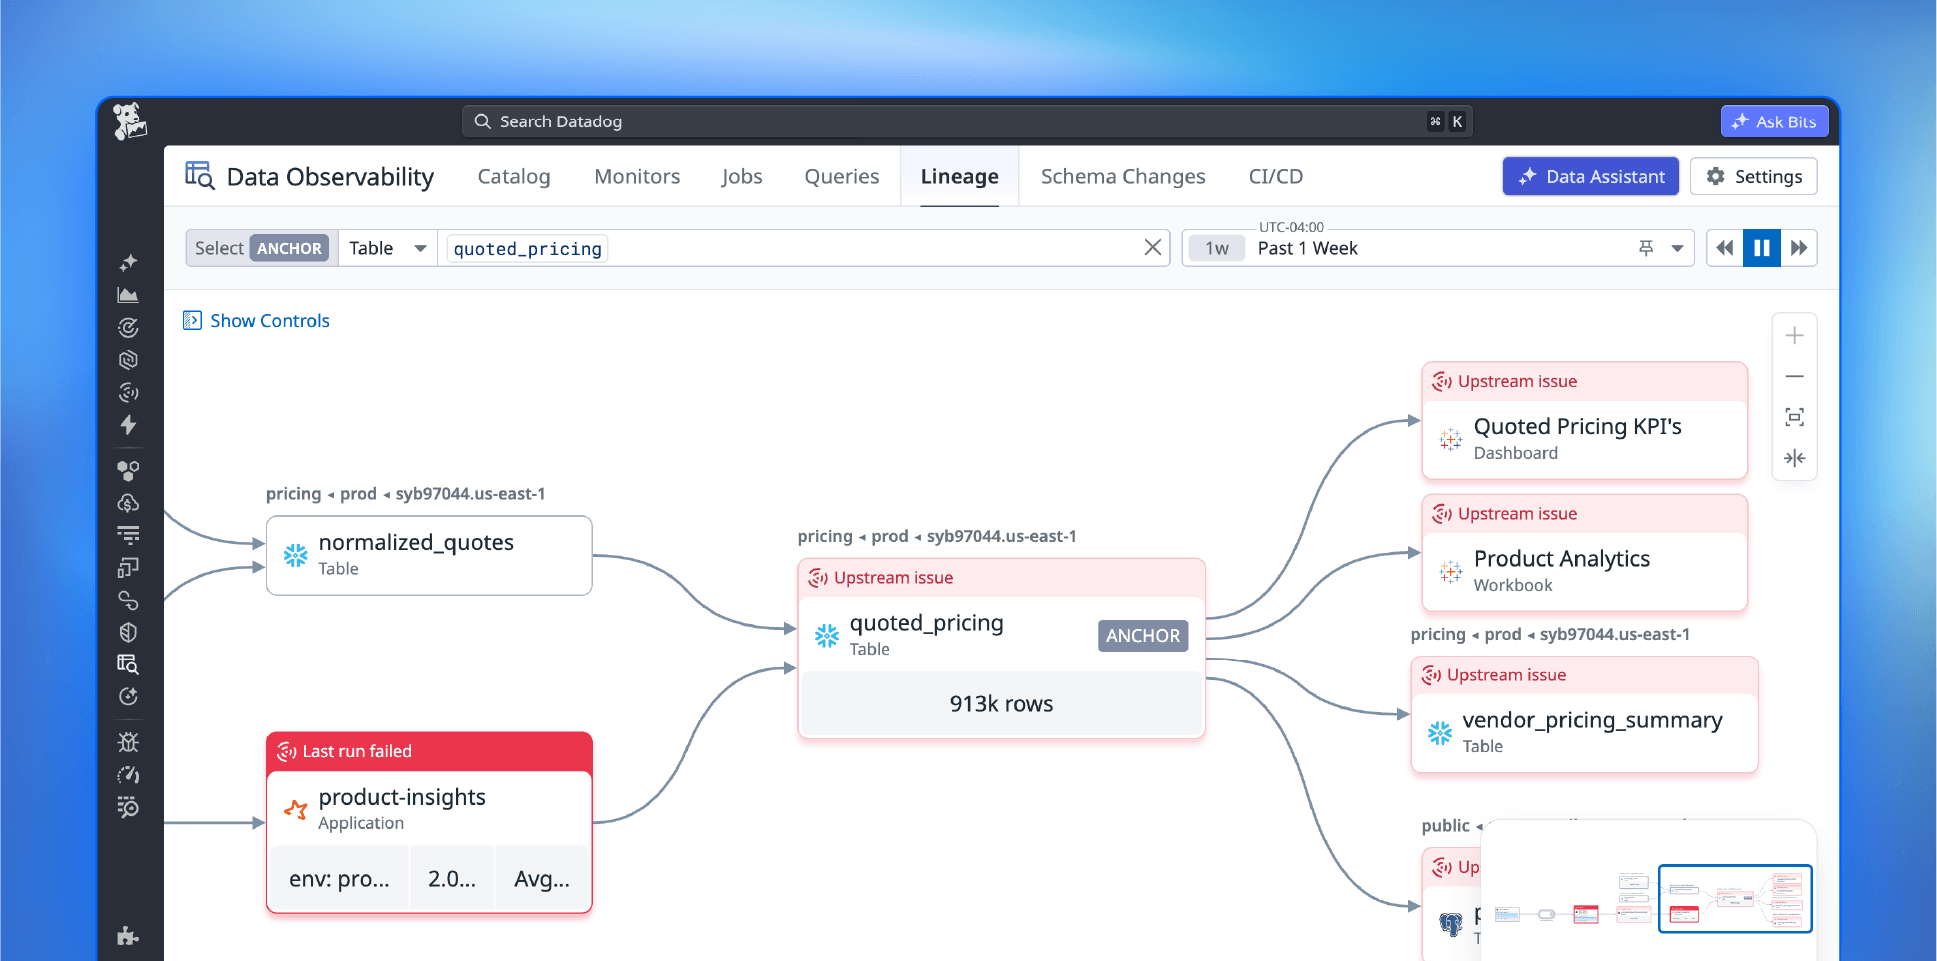
End-to-end lineage
Trace and resolve issues across the data lifecycle — from upstream applications and pipelines through warehouses to BI dashboards and AI.
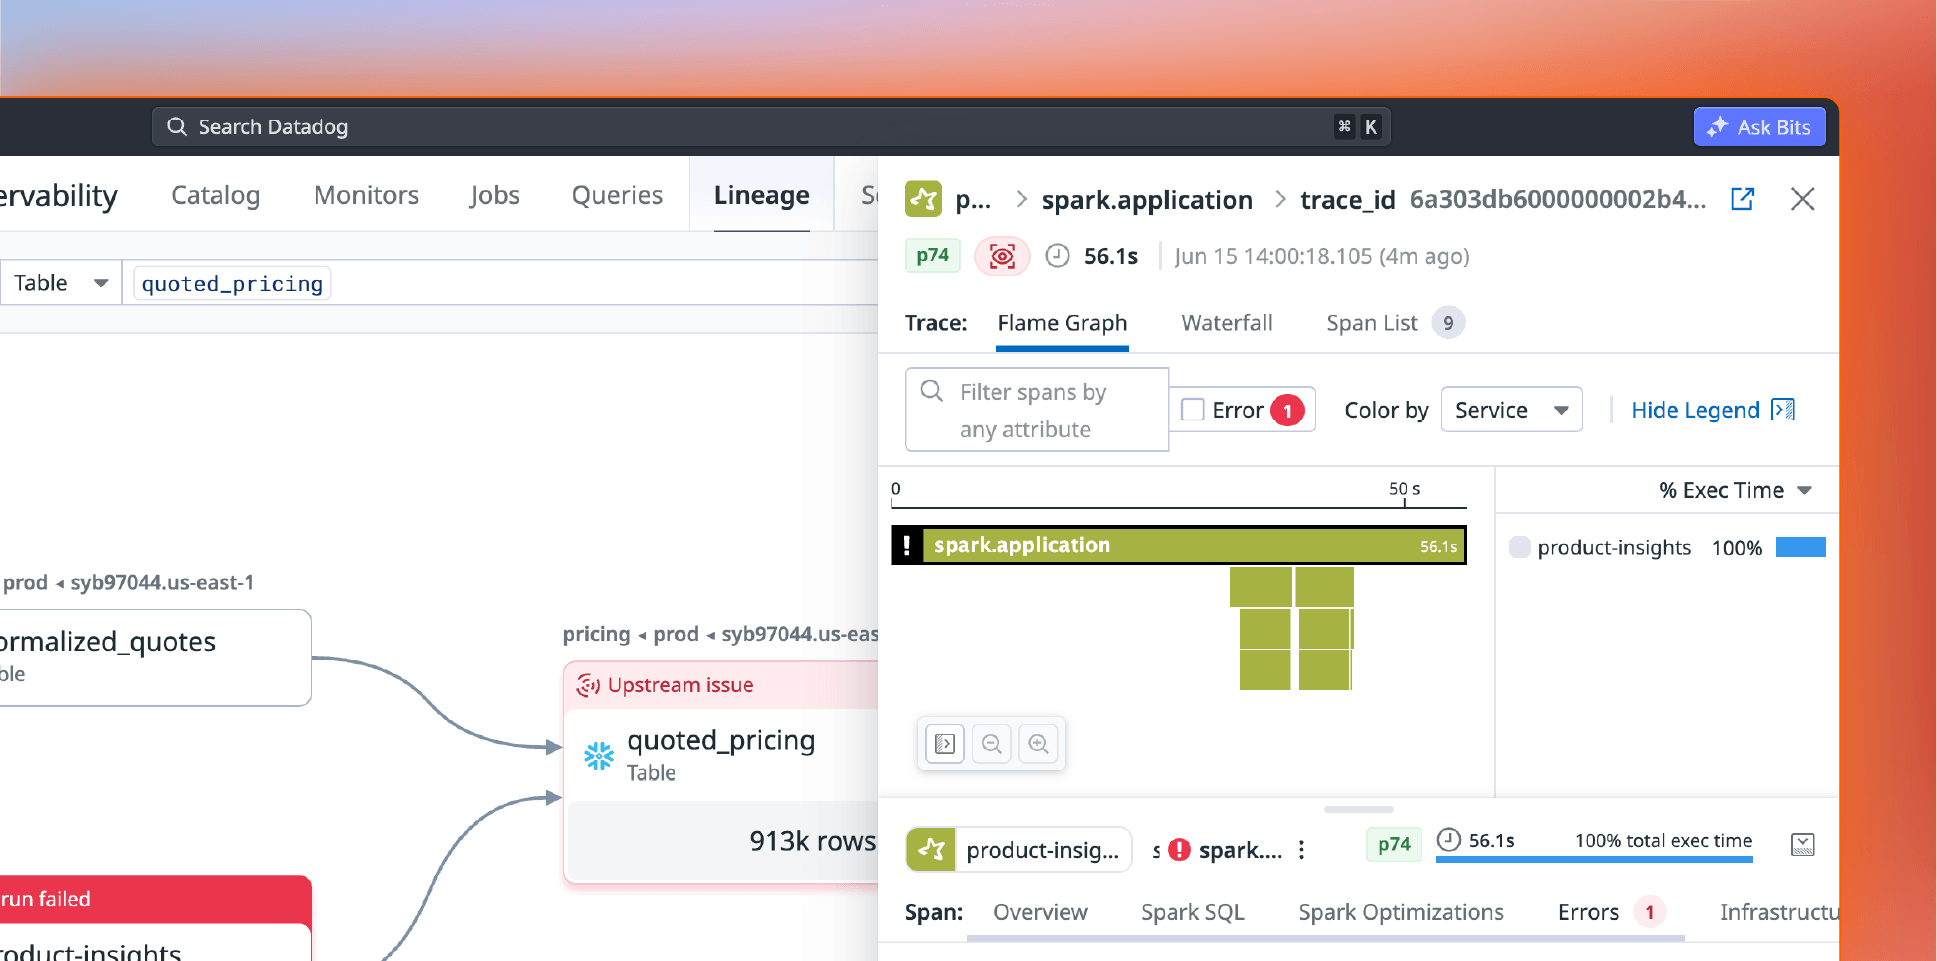
Job execution traces
Reduce mean time to resolution by correlating job execution traces, logs, and run history with data anomalies
Control costs & improve performance
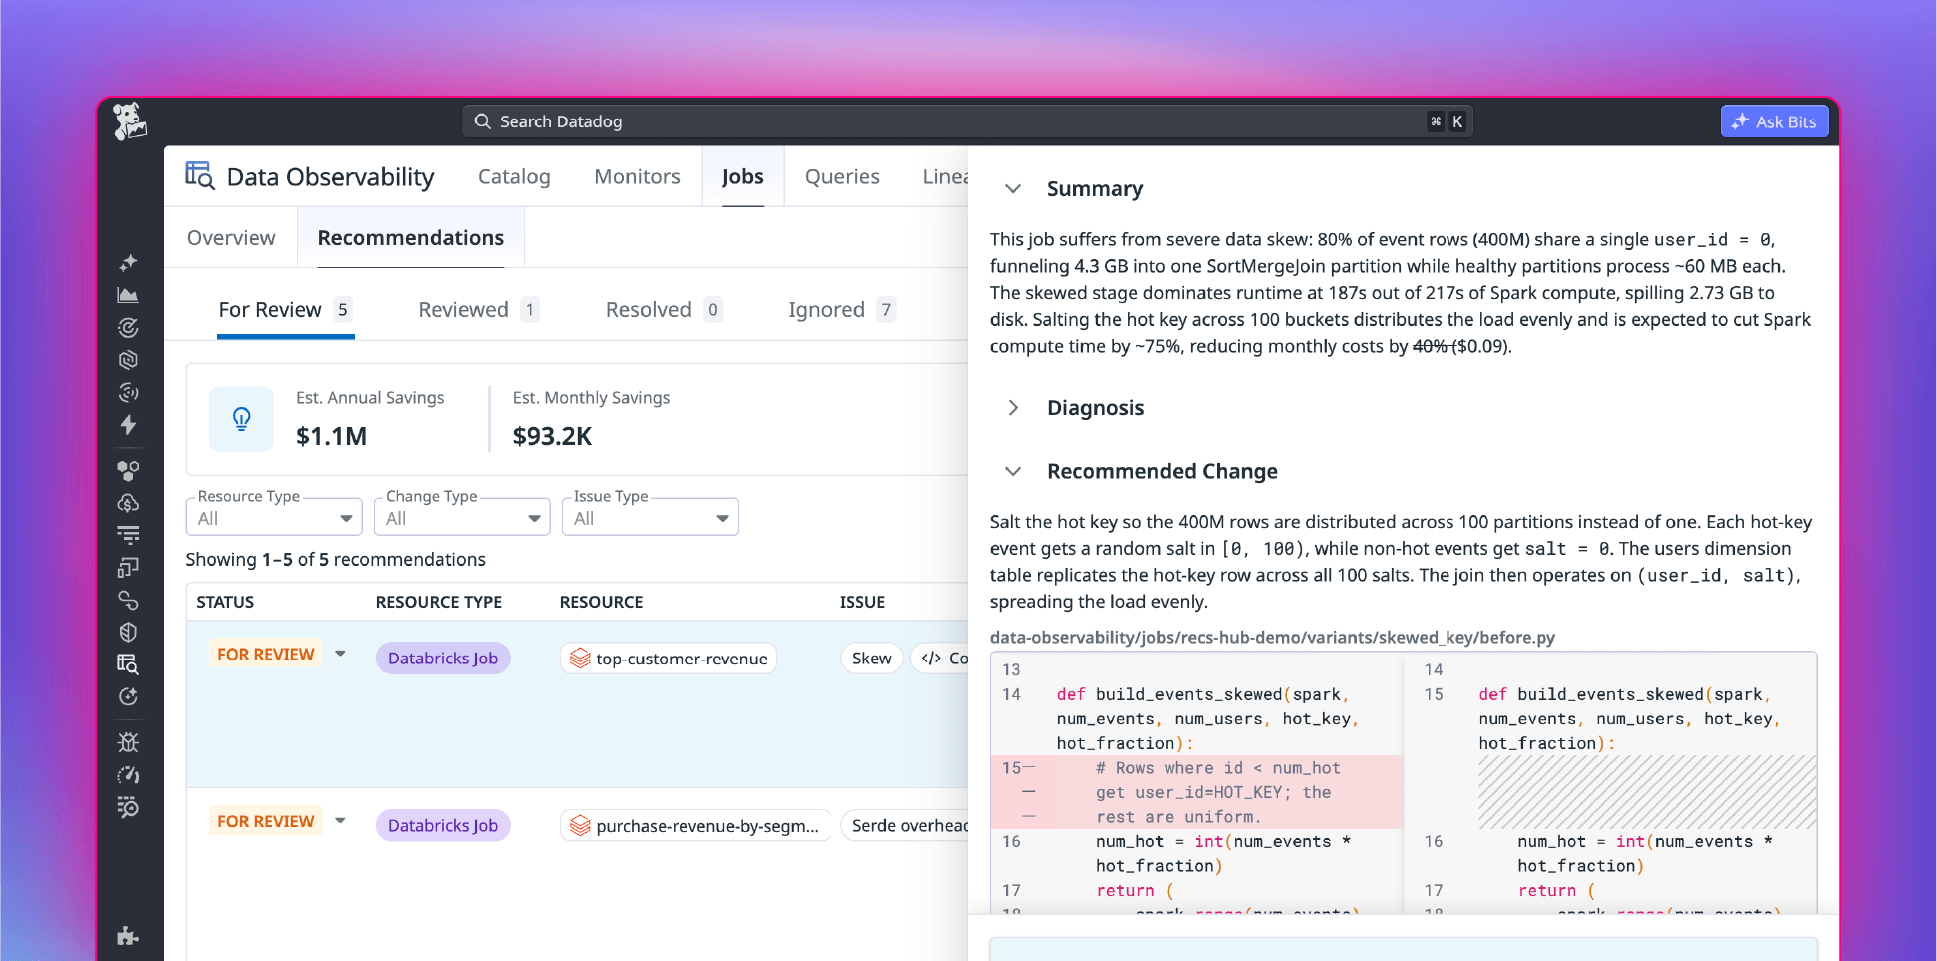
Cost insights & savings recommendations
Reduce platform spend with job and cluster cost-level visibility
Performance optimization recommendations
Improve pipeline performance to meet every SLA with actionable recommendations for queries, code, and cluster configuration
Bring data & DevOps together
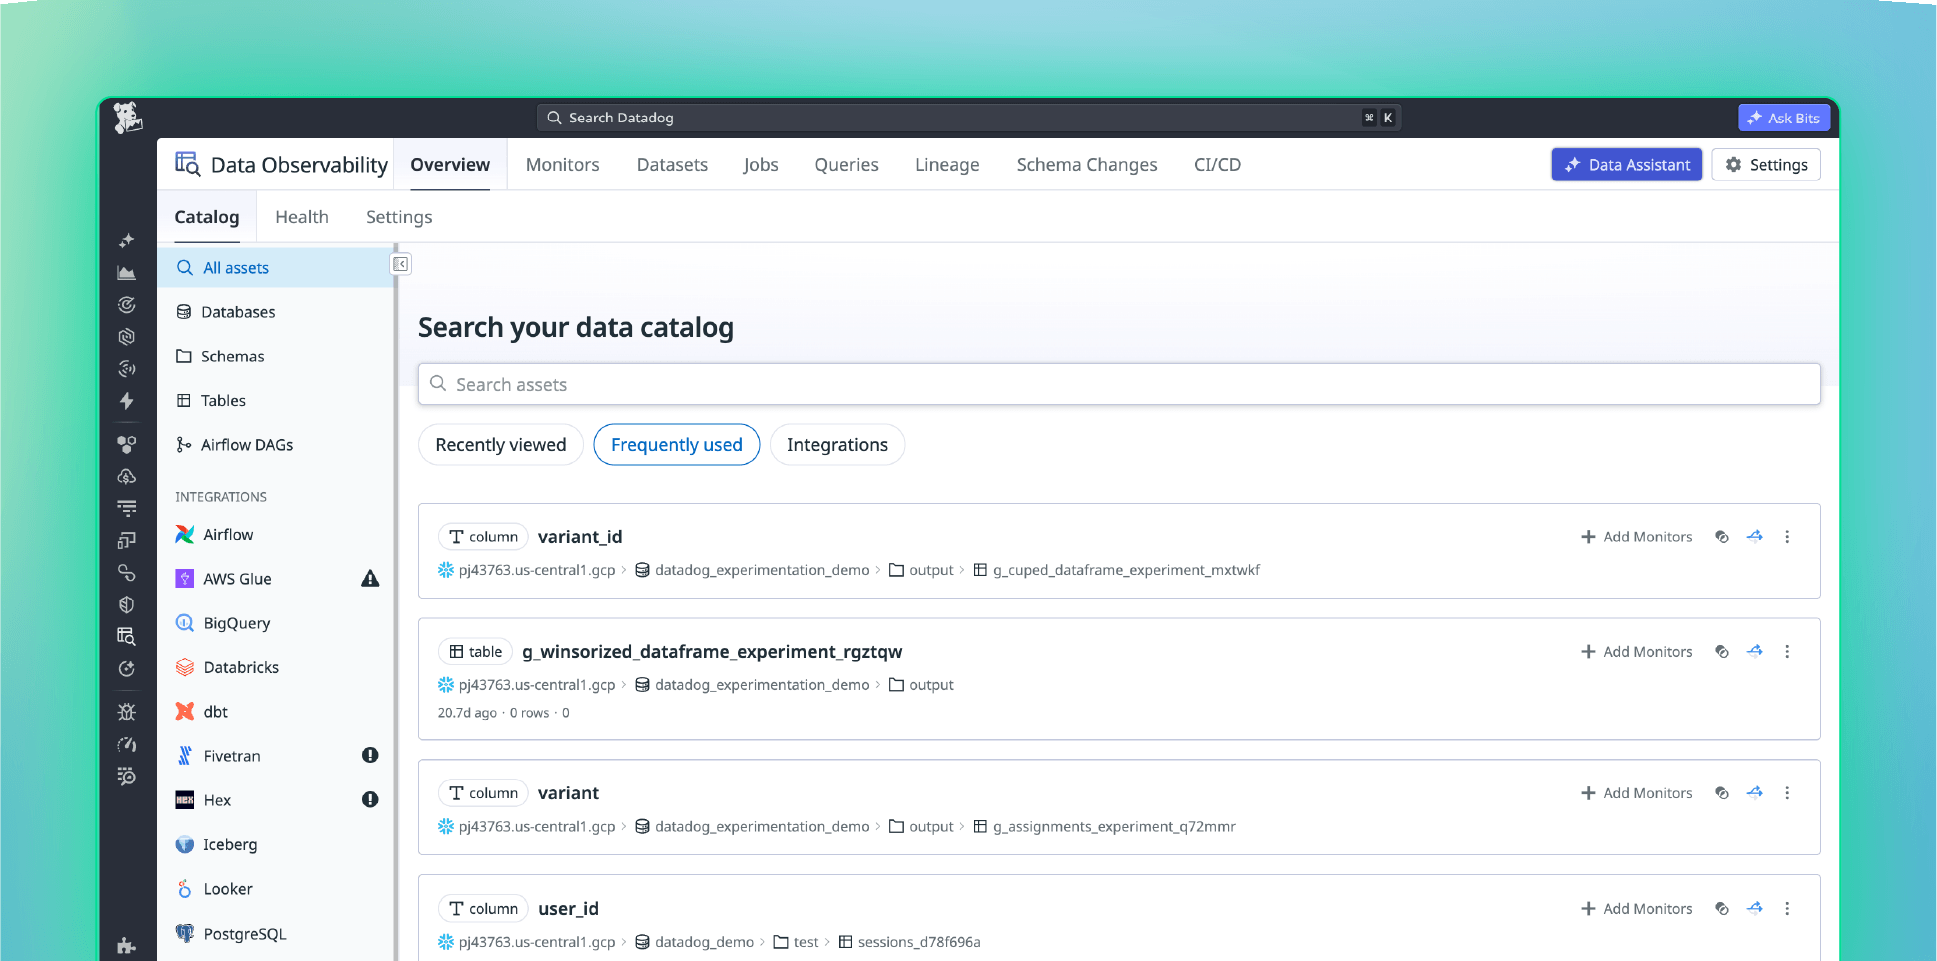
Correlated telemetry
Distinguish data failures from platform bottlenecks by correlating data health and job runs with infrastructure, logs, and application telemetry.
Centralized view for data & DevOps
Break down Data and DevOps silos with shared dashboards, alerts, and workflows all in one place.
1000+ integrations
Eliminate blind spots by connecting 1,000+ integrations across applications, services, and infrastructure and integrating with OpenLineage for custom, open-source workloads.
Priced for only what you monitor
Detect data quality and pipeline issues across your most critical technologies with a modular, usage-based plan.
From basic plans to bespoke offerings, Datadog offers the right level of support & services for any organization.
¹ Billed annually or $0.072 on-demand ² Billed annually or $0.072 on-demand ³ Billed annually or $24 on-demand
about Datadog Data Observability
Data Observability is Datadog's solution for ensuring the reliability of your data while optimizing the performance and cost of data pipelines. It unifies Quality Monitoring and Jobs Monitoring in one place, so data and DevOps teams can detect, investigate, and resolve data issues together.
Data Observability is available in all AP, EU, and US data centers.
No. Quality Monitoring and Jobs Monitoring are standalone products and do not require an Infrastructure Monitoring subscription.
Data Observability integrates with including Snowflake, Databricks, BigQuery, Redshift, Apache Spark, Airflow, dbt, and more. OpenLineage support extends visibility to custom and open-source workloads.
Yes. Each product is flexible and can be purchased independently or together depending on your needs.
Yes. You can try Data Observability free for 14 days with no commitment required.
Quality Monitoring tracks the health of data across your data lakes and warehouses. It automatically detects data quality issues — like freshness, volume, and nullness — before bad data cascades into downstream AI, applications, and analytics.
Quality Monitoring supports Snowflake, Databricks, BigQuery, Redshift, and Iceberg Tables (AWS Glue). OpenLineage support extends coverage to custom and open-source data sources.
Datadog lets you sync as many tables as you want from your warehouse or database without counting them as monitored tables. A table only becomes a monitored table once you add a monitor — a quality check like freshness, nullness, or row count — to a table, view, materialized view, or column.
Standard monitors: All standard monitors — freshness, row count, nullness, uniqueness — on a given table count as just one monitored table, no matter how many you add or whether they're applied to the table or to individual columns within it.
Custom SQL monitors: Each unique custom SQL monitor adds one additional monitored table, on top of any standard monitor count.
Example: A table with a freshness monitor and a row count monitor (1 monitored table, since both are standard) and three custom SQL monitors (3 more) results in 4 monitored tables.
Quality Monitoring is billed per monitored table, per month at $16, billed annually or $24 on-demand. You only pay for the tables you actively monitor.
Quality Monitoring includes out-of-the-box monitors for row count, freshness, uniqueness, and nullness. You can also create custom SQL monitors, set manual thresholds, and use GROUP BY monitors to monitor data at a granular level.
Yes. With end-to-end lineage, Quality Monitoring traces data issues from upstream warehouse tables through to downstream BI dashboards and AI models — so you can catch data quality problems before they degrade AI outputs or business decisions.
Jobs Monitoring tracks the performance and reliability of your data pipelines. It automatically detects failures, slowdowns, and cost anomalies before they impact downstream workflows.
Jobs Monitoring supports Databricks (AWS, Azure, and Google Cloud), Apache Spark on Kubernetes, Amazon EMR, Google Dataproc, Apache Airflow, and dbt.
Jobs Monitoring uses usage-based pricing. Clusters are billed per host, per hour. Serverless and Orchestrators are billed per job, per hour. Annual and on-demand rates are available.
Clusters covers Databricks and Spark jobs running on infrastructure like Kubernetes, Amazon EMR, and Google Dataproc. Serverless covers Databricks serverless jobs that run without dedicated infrastructure. Orchestrators covers workflow tools like Airflow DAGs and tasks, and dbt jobs and models.
Jobs Monitoring surfaces cost insights and optimization recommendations at the job and cluster level, helping teams identify overprovisioned clusters and inefficient queries before they drive up spend or cause SLA breaches.
Yes. Jobs Monitoring correlates job execution traces and logs with infrastructure metrics and data quality signals in one place — so data and DevOps teams can distinguish code issues from platform bottlenecks and resolve them faster, together.
Resources & Learning
Guides, research, and technical content to help teams build, evaluate, and operate AI agents with confidence.