- Product
Infrastructure
Applications
Data
Logs
Security
- Overview
- Code Security
- Software Composition Analysis
- Static Code Analysis
- Runtime Code Analysis
- IaC Security
- Secret Scanning
- Cloud Security
- Sensitive Data Scanner
- Cloud Security Posture Management
- Cloud Infrastructure Entitlement Management
- Vulnerability Management
- Compliance
- Cloud Workload Protection
- App & API Protection
- Cloud SIEM
- Bits Security Analyst
Digital Experience
Software Delivery
Service Management
AI
Platform Capabilities
- Bits AI
- Bits Chat
- Bits Agent Builder
- Alerts
- Custom Metrics
- Dashboards
- Notebooks
- Mobile App
- Fleet Automation
- Access Control
- Governance Console
- DORA Metrics + AI Impact
- Incident Management
- Work Management
- Workflow Automation
- Teams
- OpenTelemetry
- Integrations
- IDE Plugins
- MCP Server
- Agent Directory
- Datadog Apps
- API
- Marketplace
- Pup CLI
- Software Catalog
- Service Level Objectives
- Customers
- Pricing
- Solutions
- Financial Services
- Manufacturing & Logistics
- Healthcare/Life Sciences
- Retail/E-Commerce
- Government
- Education
- Media & Entertainment
- Technology
- Gaming
- Amazon Web Services Monitoring
- Azure Monitoring
- Google Cloud Monitoring
- Oracle Cloud Monitoring
- Kubernetes Monitoring
- Red Hat OpenShift
- Pivotal Platform
- OpenAI
- SAP Monitoring
- OpenTelemetry
- Application Security
- Cloud Migration
- Monitoring Consolidation
- Unified Commerce Monitoring
- SOAR
- DevOps
- FinOps
- Shift-Left Testing
- Digital Experience Monitoring
- Security Analytics
- Compliance for CIS Benchmarks
- Hybrid Cloud Monitoring
- Edge Device Monitoring
- Real-Time BI
- On-Premises Monitoring
- Log Analysis & Correlation
- CNAPP
Industry
Technology
Use Case
- About
- Blog
- Docs
- Login
- Get Started

Monitor your databases at every level
Not all databases are created equal. Thousands of databases can carry the transactions your business depends on, while many more support internal tools, staging environments, and lower-traffic services that aren't mission-critical but still need high-level visibility into their health. Most monitoring approaches force an all-or-nothing choice: either every database gets the same deep visibility, or the ones deemed "less critical" go dark until something breaks.
Datadog gives you three complementary views into your databases, so you can match the depth of visibility to each database's criticality. Database Integrations give you high-level visibility across every engine in your fleet, self-hosted or cloud-managed. Database Monitoring (DBM) adds deep query-level visibility for the databases where performance matters most: historical query performance, execution plans, wait events, blocking analysis, AI-driven investigations, and validated query and index fixes. Application Performance Monitoring (APM) connects application requests to the exact database calls. Together, these capabilities give teams the right visibility at every layer: Integrations provide breadth, DBM delivers database depth, and APM gives application context.
See infrastructure health metrics across your fleet with integrations
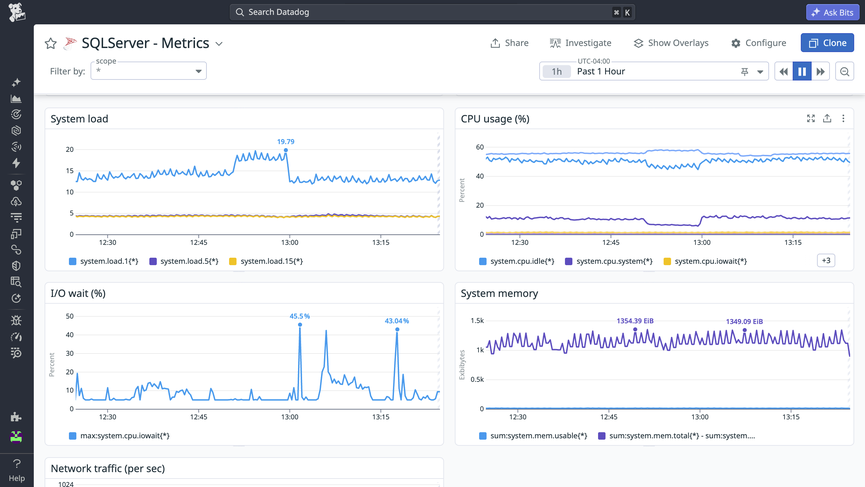
As part of Datadog's 1000+ built-in integrations, Database Integrations collect the key metrics that tell you whether a database is healthy: connections, throughput, errors, engine-specific internals, and more. Coverage spans Datadog's Data Stores integration category, including major open-source engines, their managed counterparts across leading cloud providers, and dozens of purpose-built cloud-native databases. Each integration ships with an out-of-the-box dashboard and lets you build monitors right away, giving operations and SRE teams a consistent "is it up, is it healthy" view across hundreds of instances and engines, wherever they run.
Because integrations run as Agent checks, they're included with your Infrastructure Monitoring license, with no separate install or additional cost: enable the check, add credentials, and dashboards and alerting are live in minutes.
When integrations are ideal
- Monitoring health across large numbers of database instances
- Establishing baseline visibility for operations and SRE teams
- Alerting on availability, connections, throughput, errors, and resource pressure
- Comparing database and infrastructure health in the same dashboards
Databases supported by integrations (see the full Data Stores catalog for the complete list, including caches, warehouses, and other data stores):
- Amazon DocumentDB
- ClickHouse
- MongoDB, including MongoDB Atlas
- MySQL, including Azure Database for MySQL, OCI MySQL Database, and Alibaba Cloud AnalyticDB for MySQL
- Oracle
- Postgres, including Azure Database for PostgreSQL, Azure Cosmos DB for PostgreSQL, Google Cloud AlloyDB, OCI PostgreSQL, and Nebius Cloud PostgreSQL
- SQL Server, including Azure SQL Database
- Supabase, including Supabase Cloud
Deep, query-level visibility into your databases
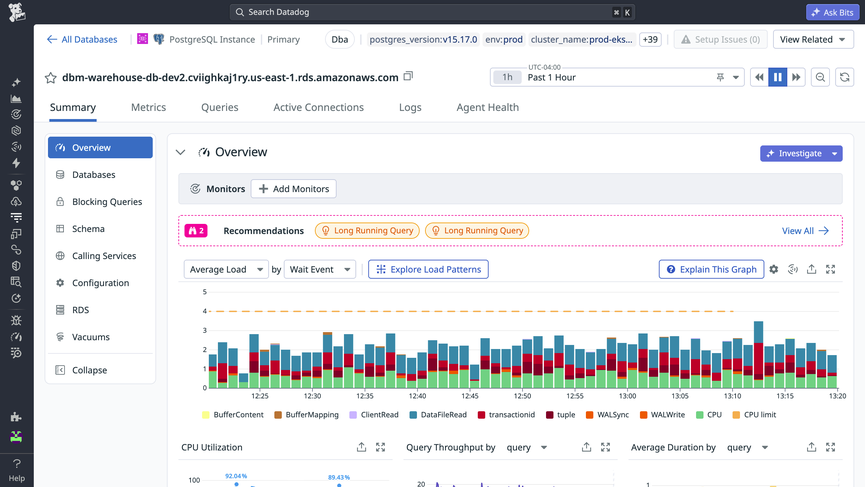
For the databases where performance directly affects revenue, uptime, or customer experience, Database Monitoring (DBM) adds the depth that integrations and APM don't reach on their own. Instead of stopping at "is the database healthy," DBM brings query performance, execution plans, wait events, blocking chains, and database configuration together with the traces, logs, and infrastructure around them—helping application, platform, and database teams move from a performance symptom to its root cause without relying on deep database expertise.
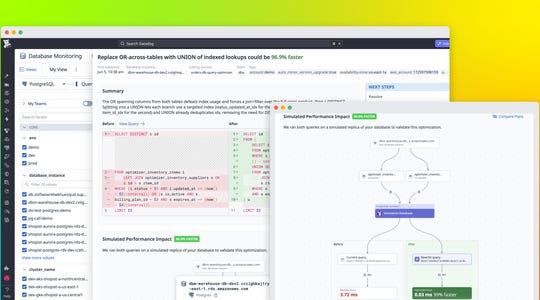
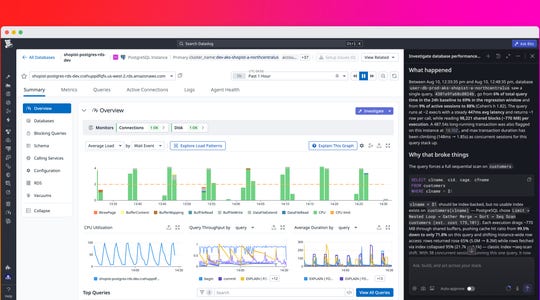
DBM goes beyond surfacing performance data to help teams troubleshoot issues, prevent regressions, and improve inefficient queries. Database Investigations in Bits Chat analyzes database and cross-stack telemetry together to diagnose performance issues and recommend next steps. Proactive recommendations and historical query metrics surface regressions and emerging performance problems before they become incidents. And Bits Database Optimization generates and validates query rewrites and index changes, so teams can move from an inefficient query to a measured, reviewable fix.
DBM is usually best applied to:
- Investigating slow, expensive, or regressing queries
- Understanding changes in execution plans and query behavior
- Resolving blocking chains, lock contention, and resource competition
- Prioritizing database recommendations before issues become incidents
- Testing supported query rewrites and index changes before review
Databases supported by DBM (self-hosted or run by a cloud provider):
With Datadog Database Monitoring, we can capture everything that we can think of and easily optimize inefficient queries.
Amith Reddy
Site Reliability Engineer,
Correlate slow requests to the exact query behind them
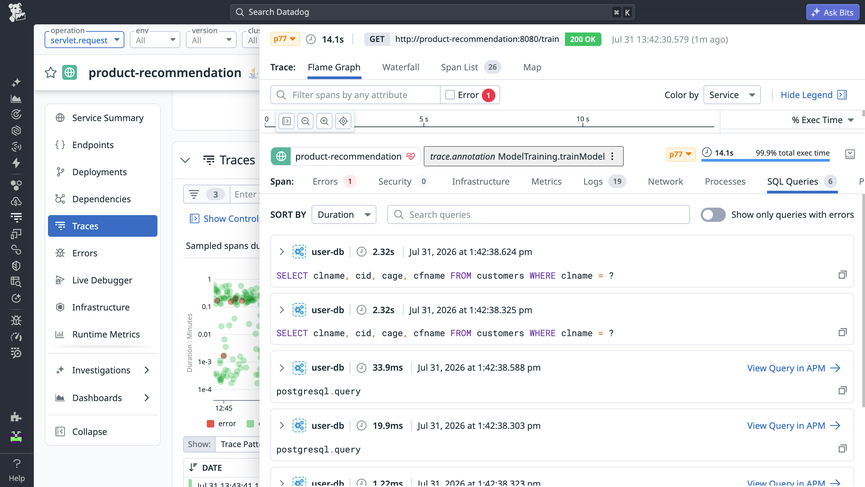
When applications are instrumented with Datadog Application Performance Monitoring (APM), database calls show up as spans inside distributed traces so teams can see exactly which service issued which query, and how much of a request's latency came from the database versus the application layer. Developers don't need direct database access to reconstruct which service is responsible for the load they're seeing.
The connection works both ways. Datadog can inject APM trace identifiers into database query collection, so application context shows up inside database views and query details show up inside traces. Application developers get a fast, safe way to check if a database is involved before escalating, while DBAs and platform teams see what's calling the query without waiting on another team.
APM database visibility is well suited for:
- Tracing slow endpoints and transactions to their database calls
- Identifying which services generate database load
- Comparing changes in database latency with application deployments
- Giving application and database teams shared evidence during an investigation
This is why Database Integrations, DBM, and APM work best together: Integrations show broad database health, APM shows application impact, and DBM explains query behavior and guides teams toward fixes.