


Real User Monitoring Overview
Learn how to instrument your web and mobile applications and start collecting user sessions.
Deliver fast, reliable experiences across web and mobile
Detect, investigate and resolve the errors, crashes, and slowdowns affecting real users

Trusted by leading frontend teams





Measure how every release impacts real users
Understand the impact of every release and keep critical user journeys fast, reliable.
Improve application availability and performance
Measure Core Web Vitals and Mobile Vitals, then slice by version, device, os, country, and other dimensions to see.
Focus teams on the highest-impact issues
Group high-volume errors and crashes into actionable issues, then pinpoint the root cause down to the exact line of code.
Connect user impact to root cause
Pivot from any user session to backend traces, session replays, logs, and infrastructure metrics to find root cause without switching tools.
Troubleshoot every application from one platform
Monitor web, mobile, desktop, and connected devices apps side by side with consistent metrics and a single workflow.
RUM without Limits™ gives you the visibility you need to monitor your frontend applications, troubleshoot faster, and make data-driven decisions.

Real user insights for every team
Get the visibility your team needs to catch user-impacting issues early, resolve them faster, and release with confidence.


Datadog Named a Leader in the 2026 Gartner® Magic Quadrant™ for Observability Platforms for the Sixth Time
Your front row seat to every user session
Detect and prioritize what matters
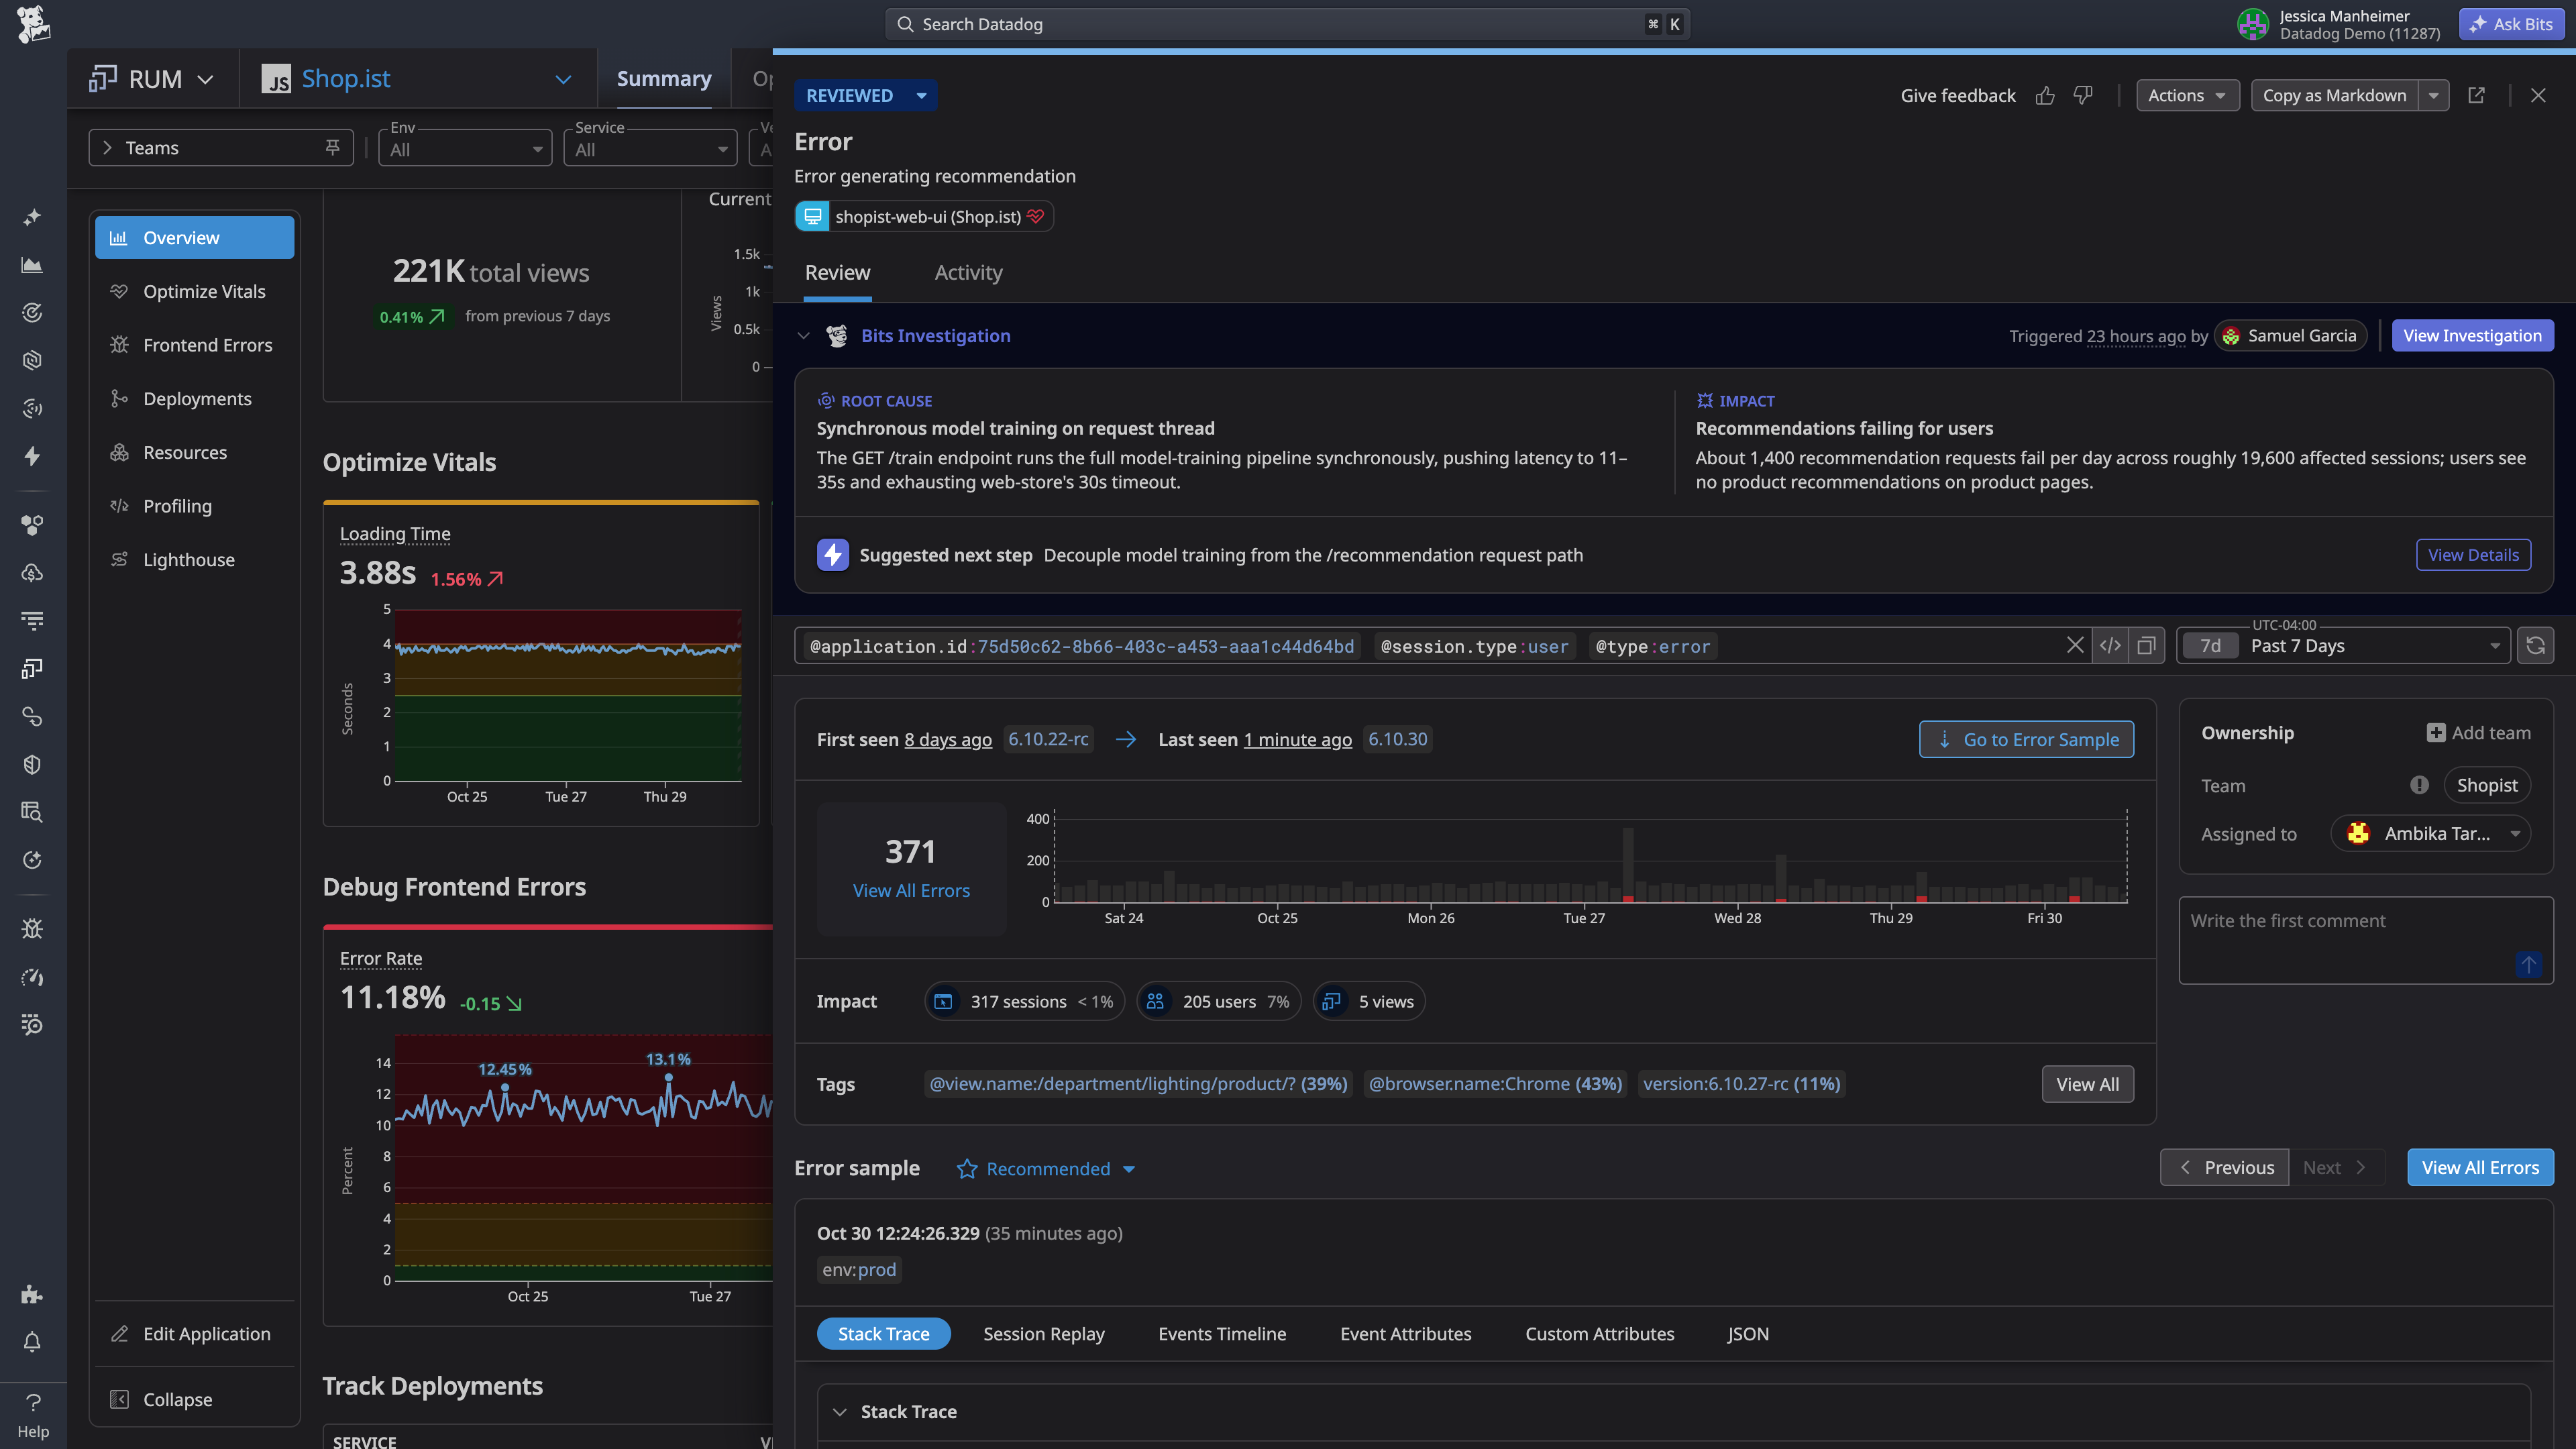
Error & crash tracking
Group errors and crashes into a focused set of issues with readable stack traces that pinpoint the line of code, then prioritize by the user segments, releases, and devices affected.
Monitors and alerts
Create monitors that alert on Core Web Vitals, crash-free rates, ANRs, app startup times, and any other RUM metric computed on 100% of your traffic.
Critical Operations monitoring
Measure the availability and latency of critical steps like signing in or processing a payment, and set SLOs on each one.
Accelerate troubleshooting
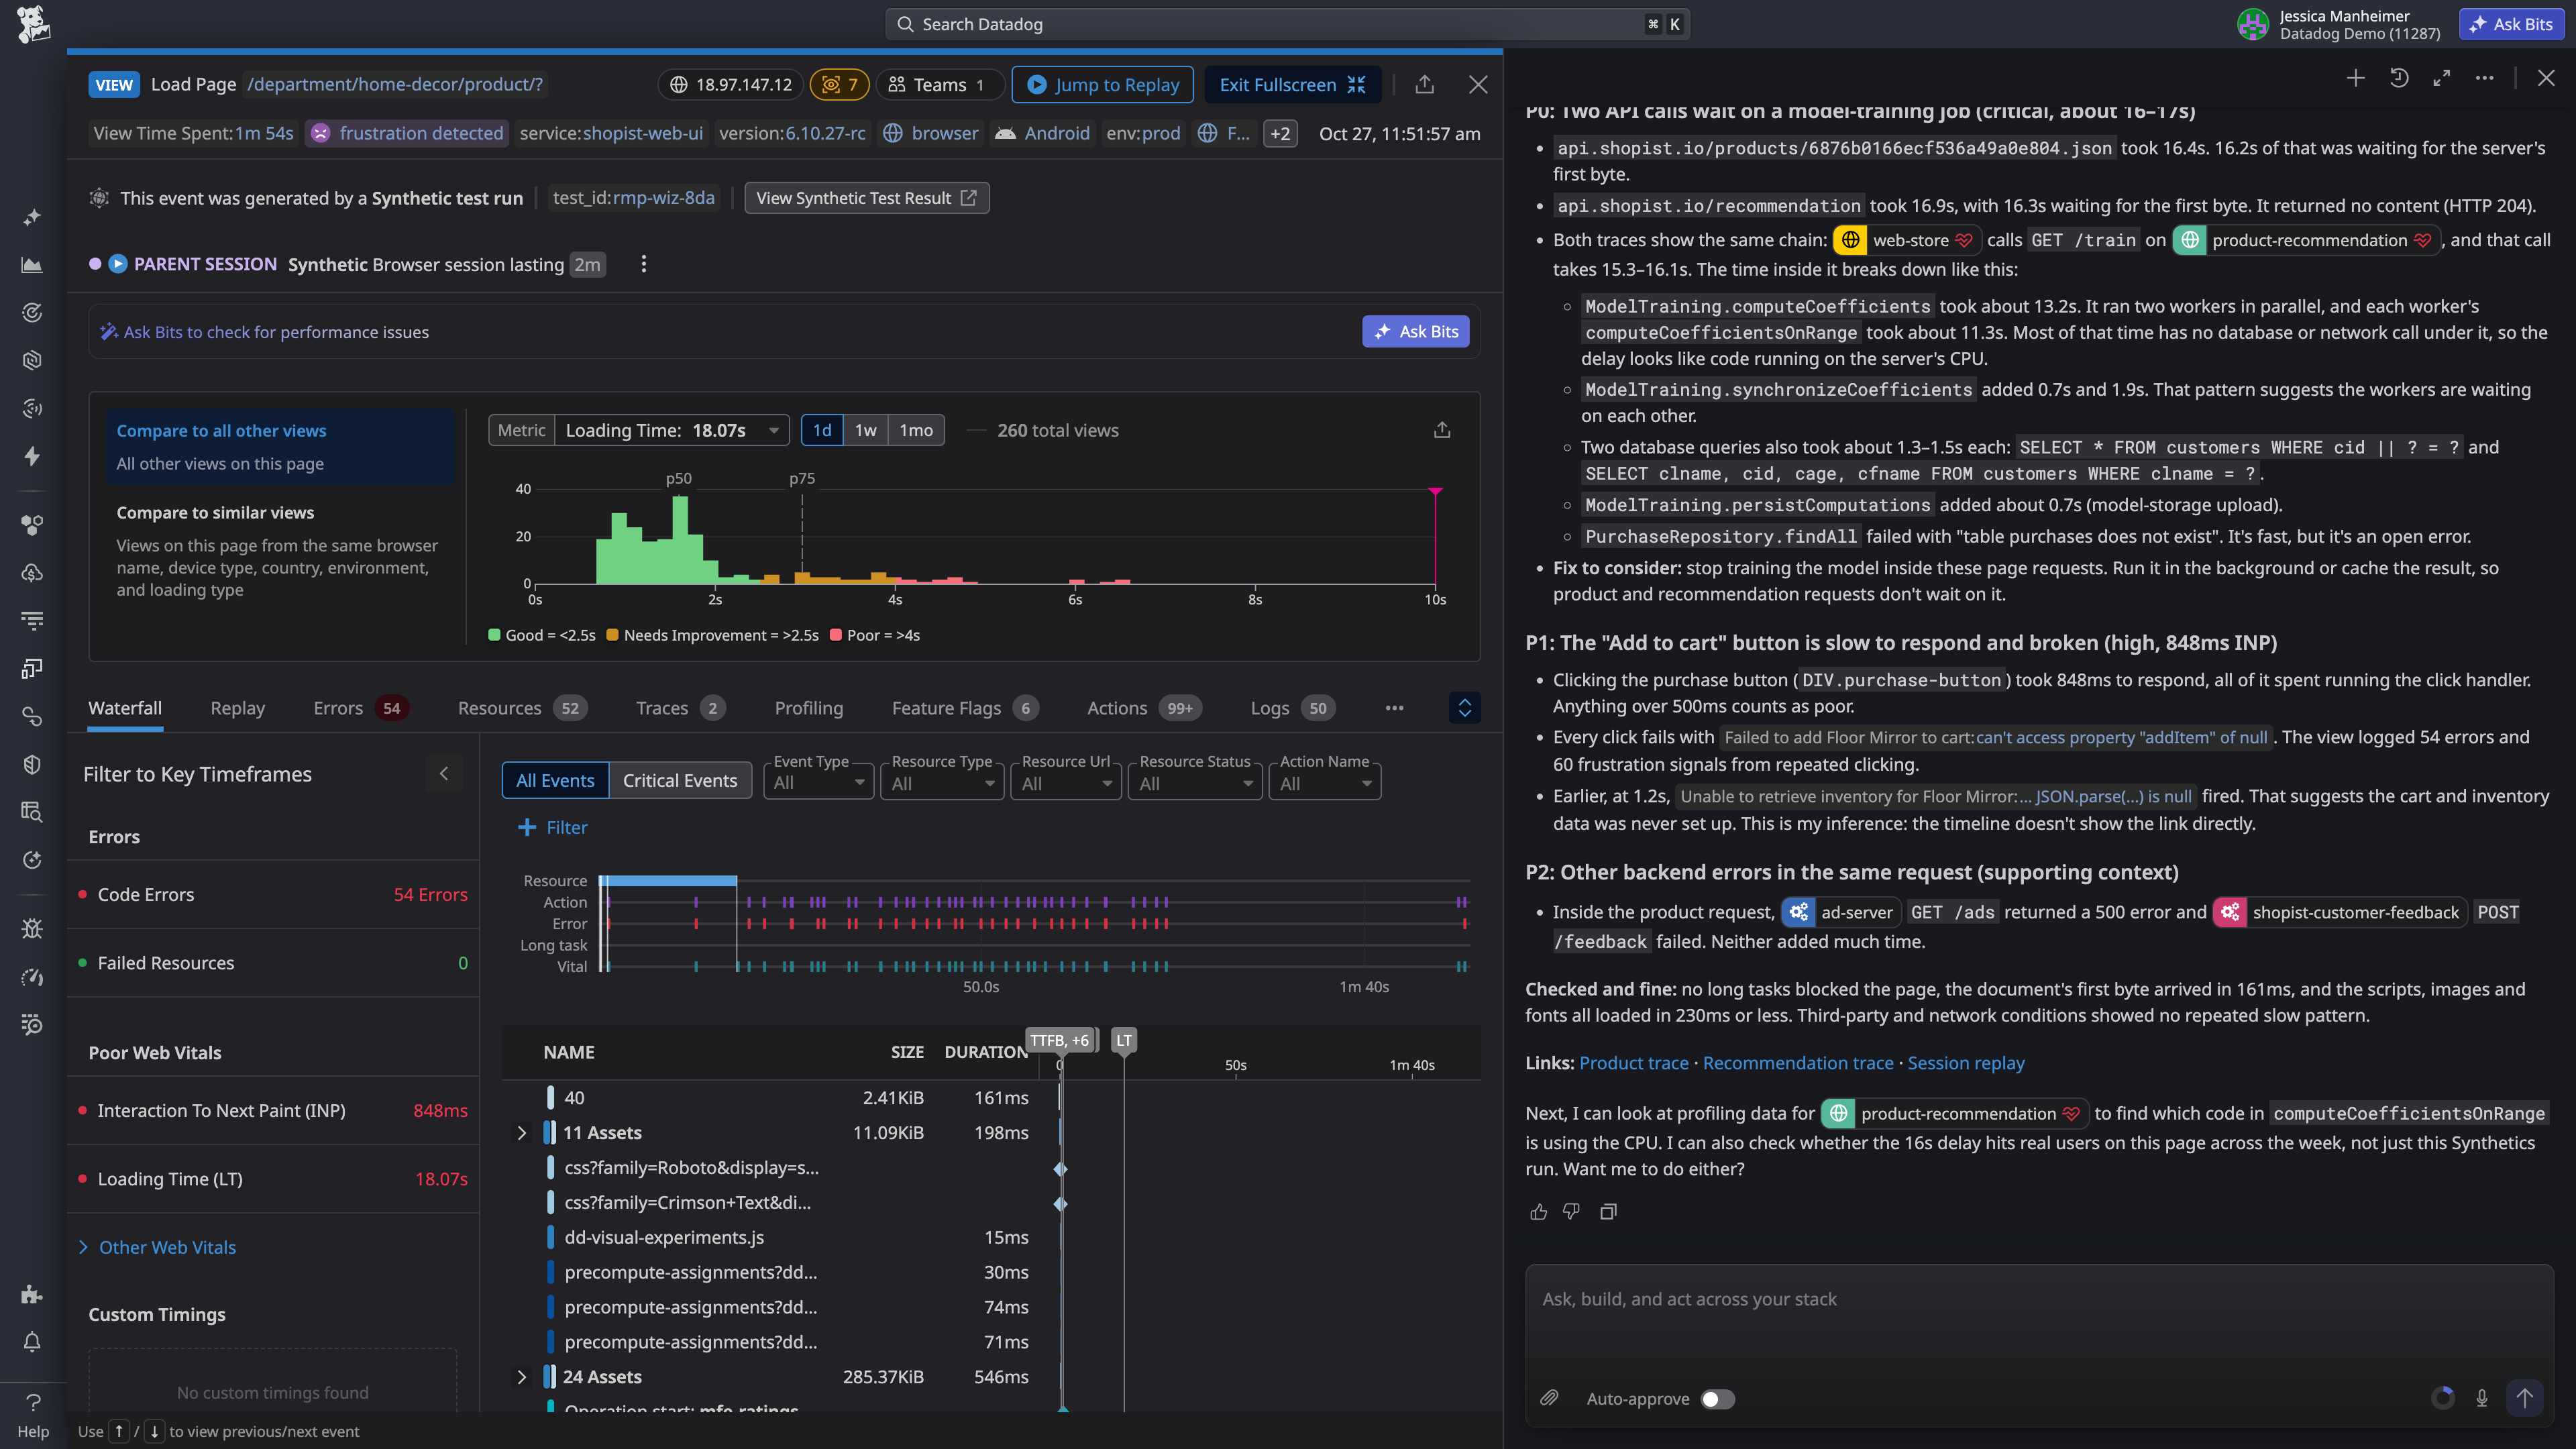
Unified frontend and backend telemetry
Pivot from any session to backend traces, logs, and infrastructure metrics in one click or correlate real user sessions with Synthetic Monitoring results.
Visualize real user sessions with Session Replay
Watch a pixel-perfect recreation of any web or mobile user journey to reproduce errors exactly as the user hit them.
Investigate with Bits AI
RUM integration with Bits AI provides both digestible summaries of your events and aggregated diagnostics with step-by-step reasoning and recommended next steps.
Trace slowdowns to their source
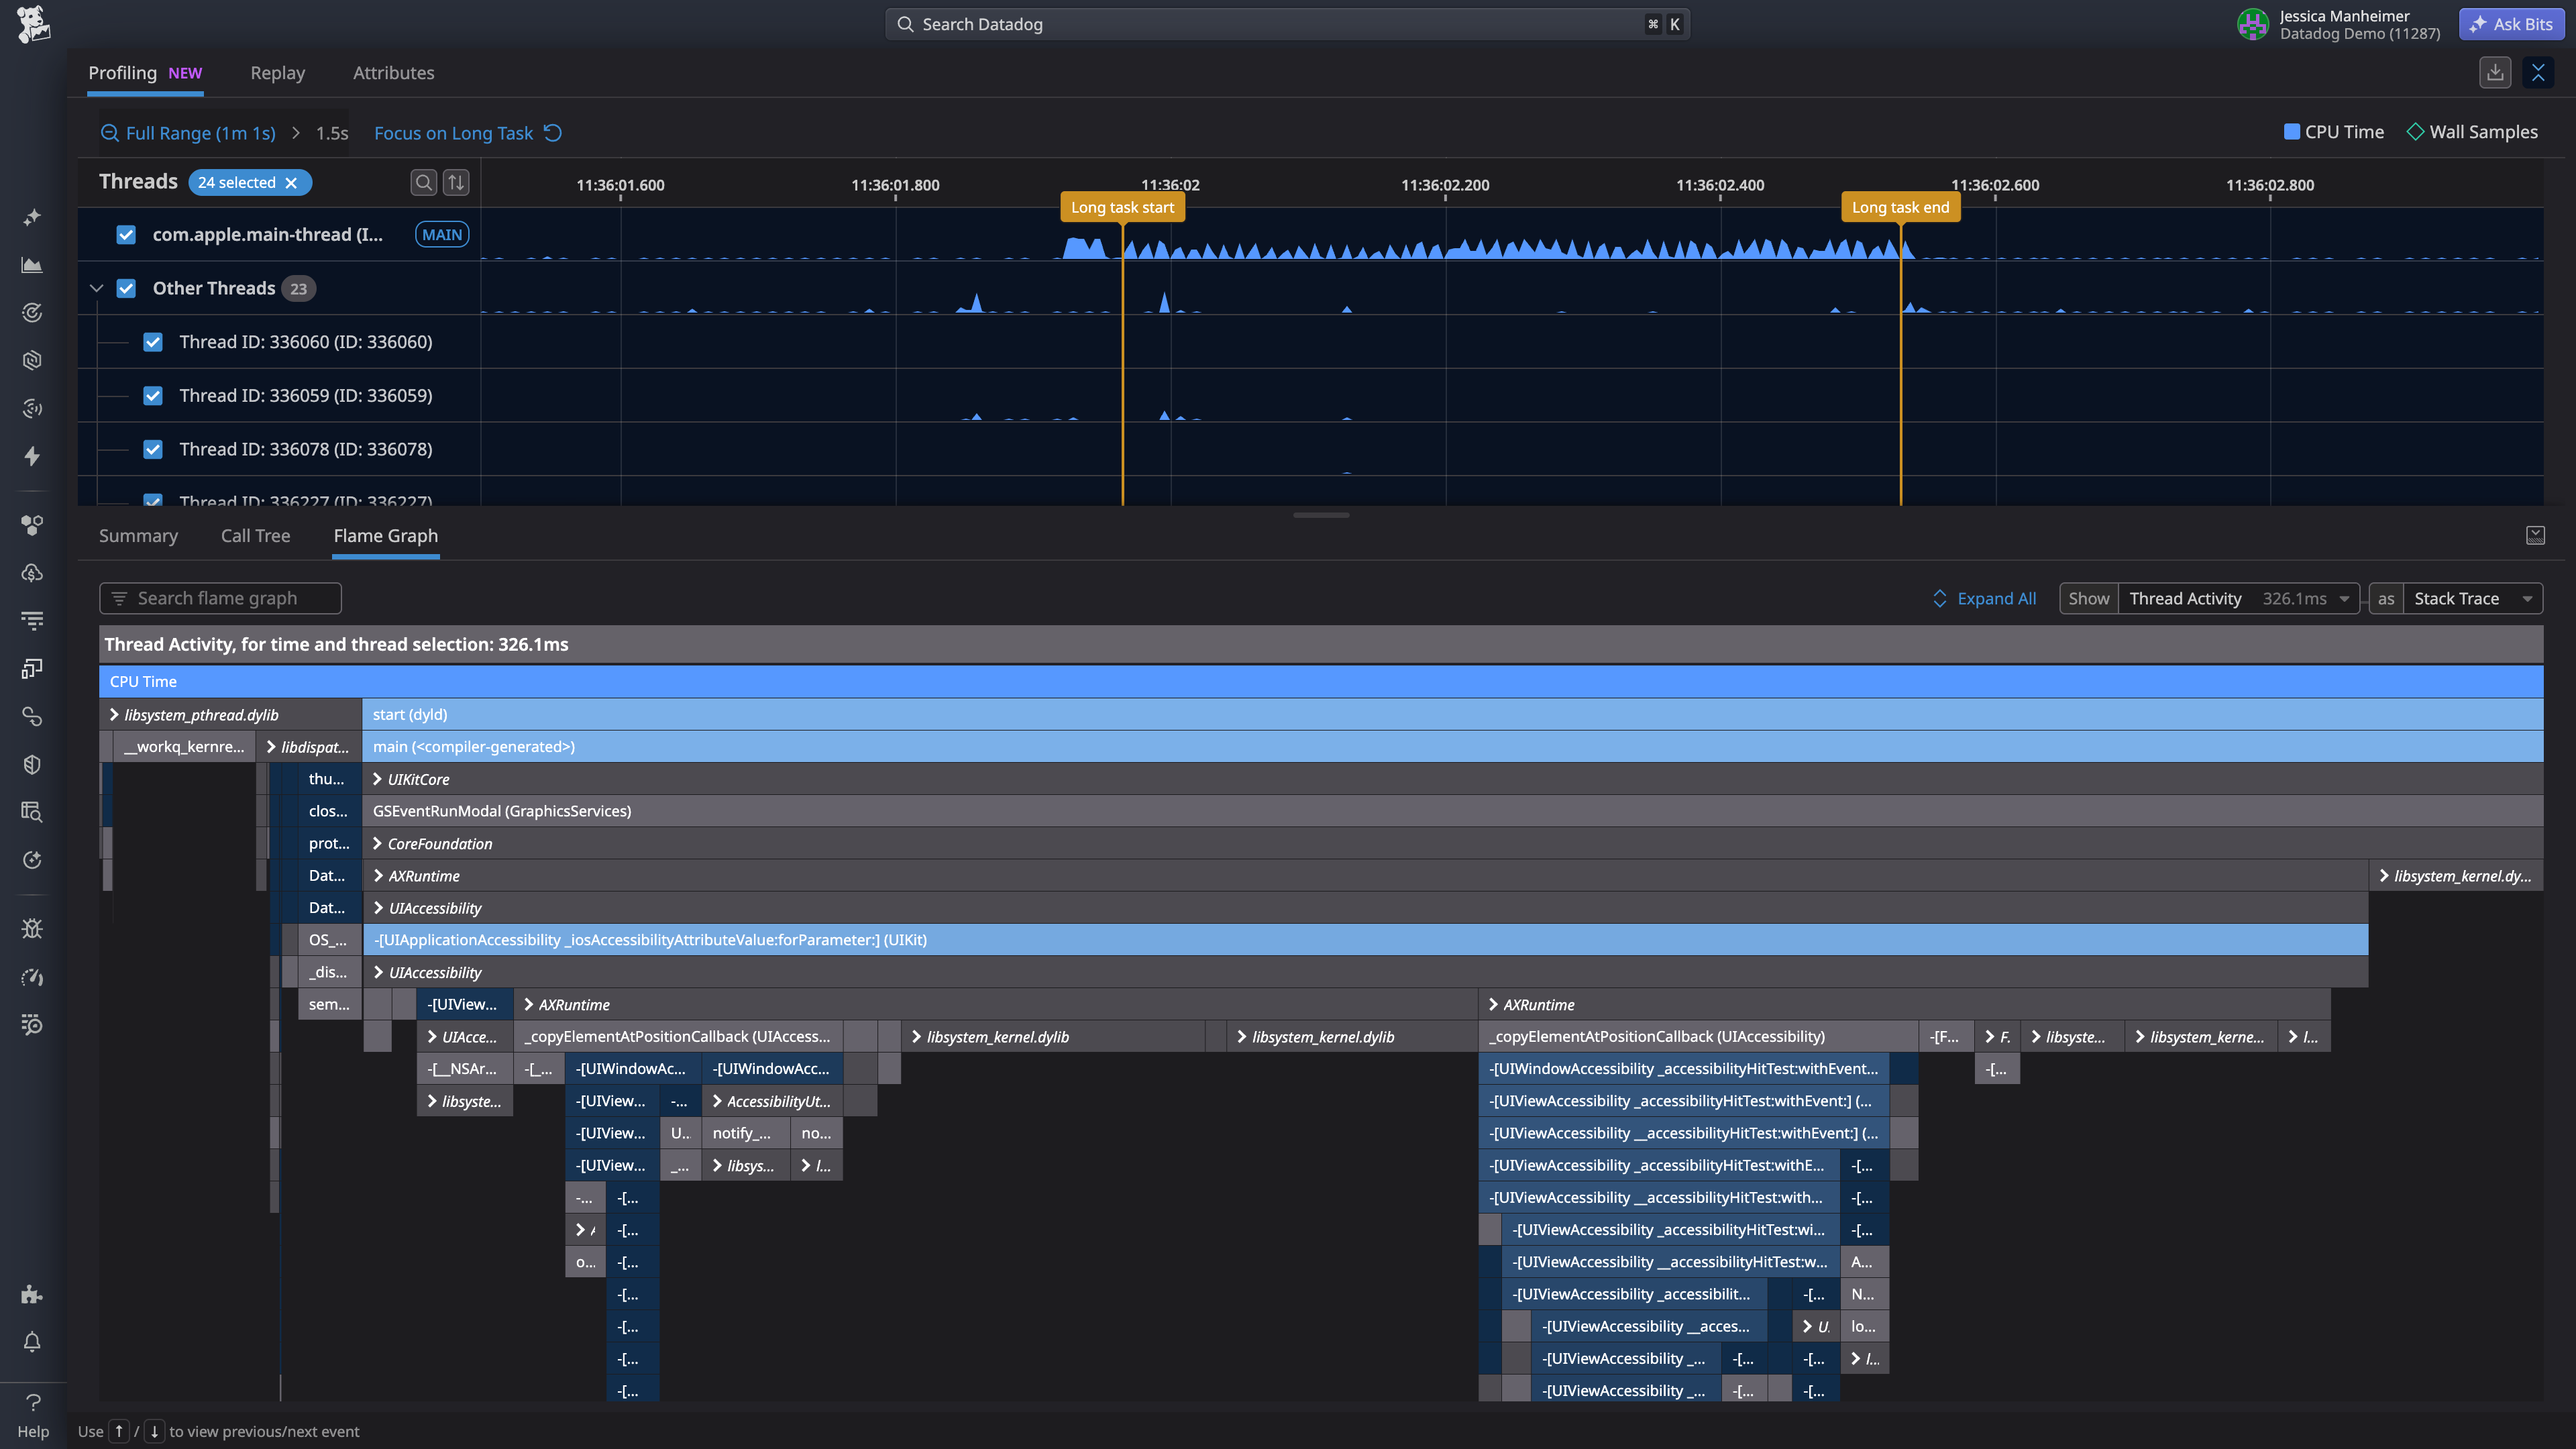
Core Web Vitals and Mobile Vitals
Track the metrics that matter on web and mobile — load times, app startups, ANRs — sliced by version, device, and country.
Browser and Mobile Profiling
Trace slowdowns to the exact methods responsible, using profiling data from real production sessions.
Deployment Tracking
Compare errors and performance across app versions and feature flags to catch regressions before they spread.
Visibility that grows with you
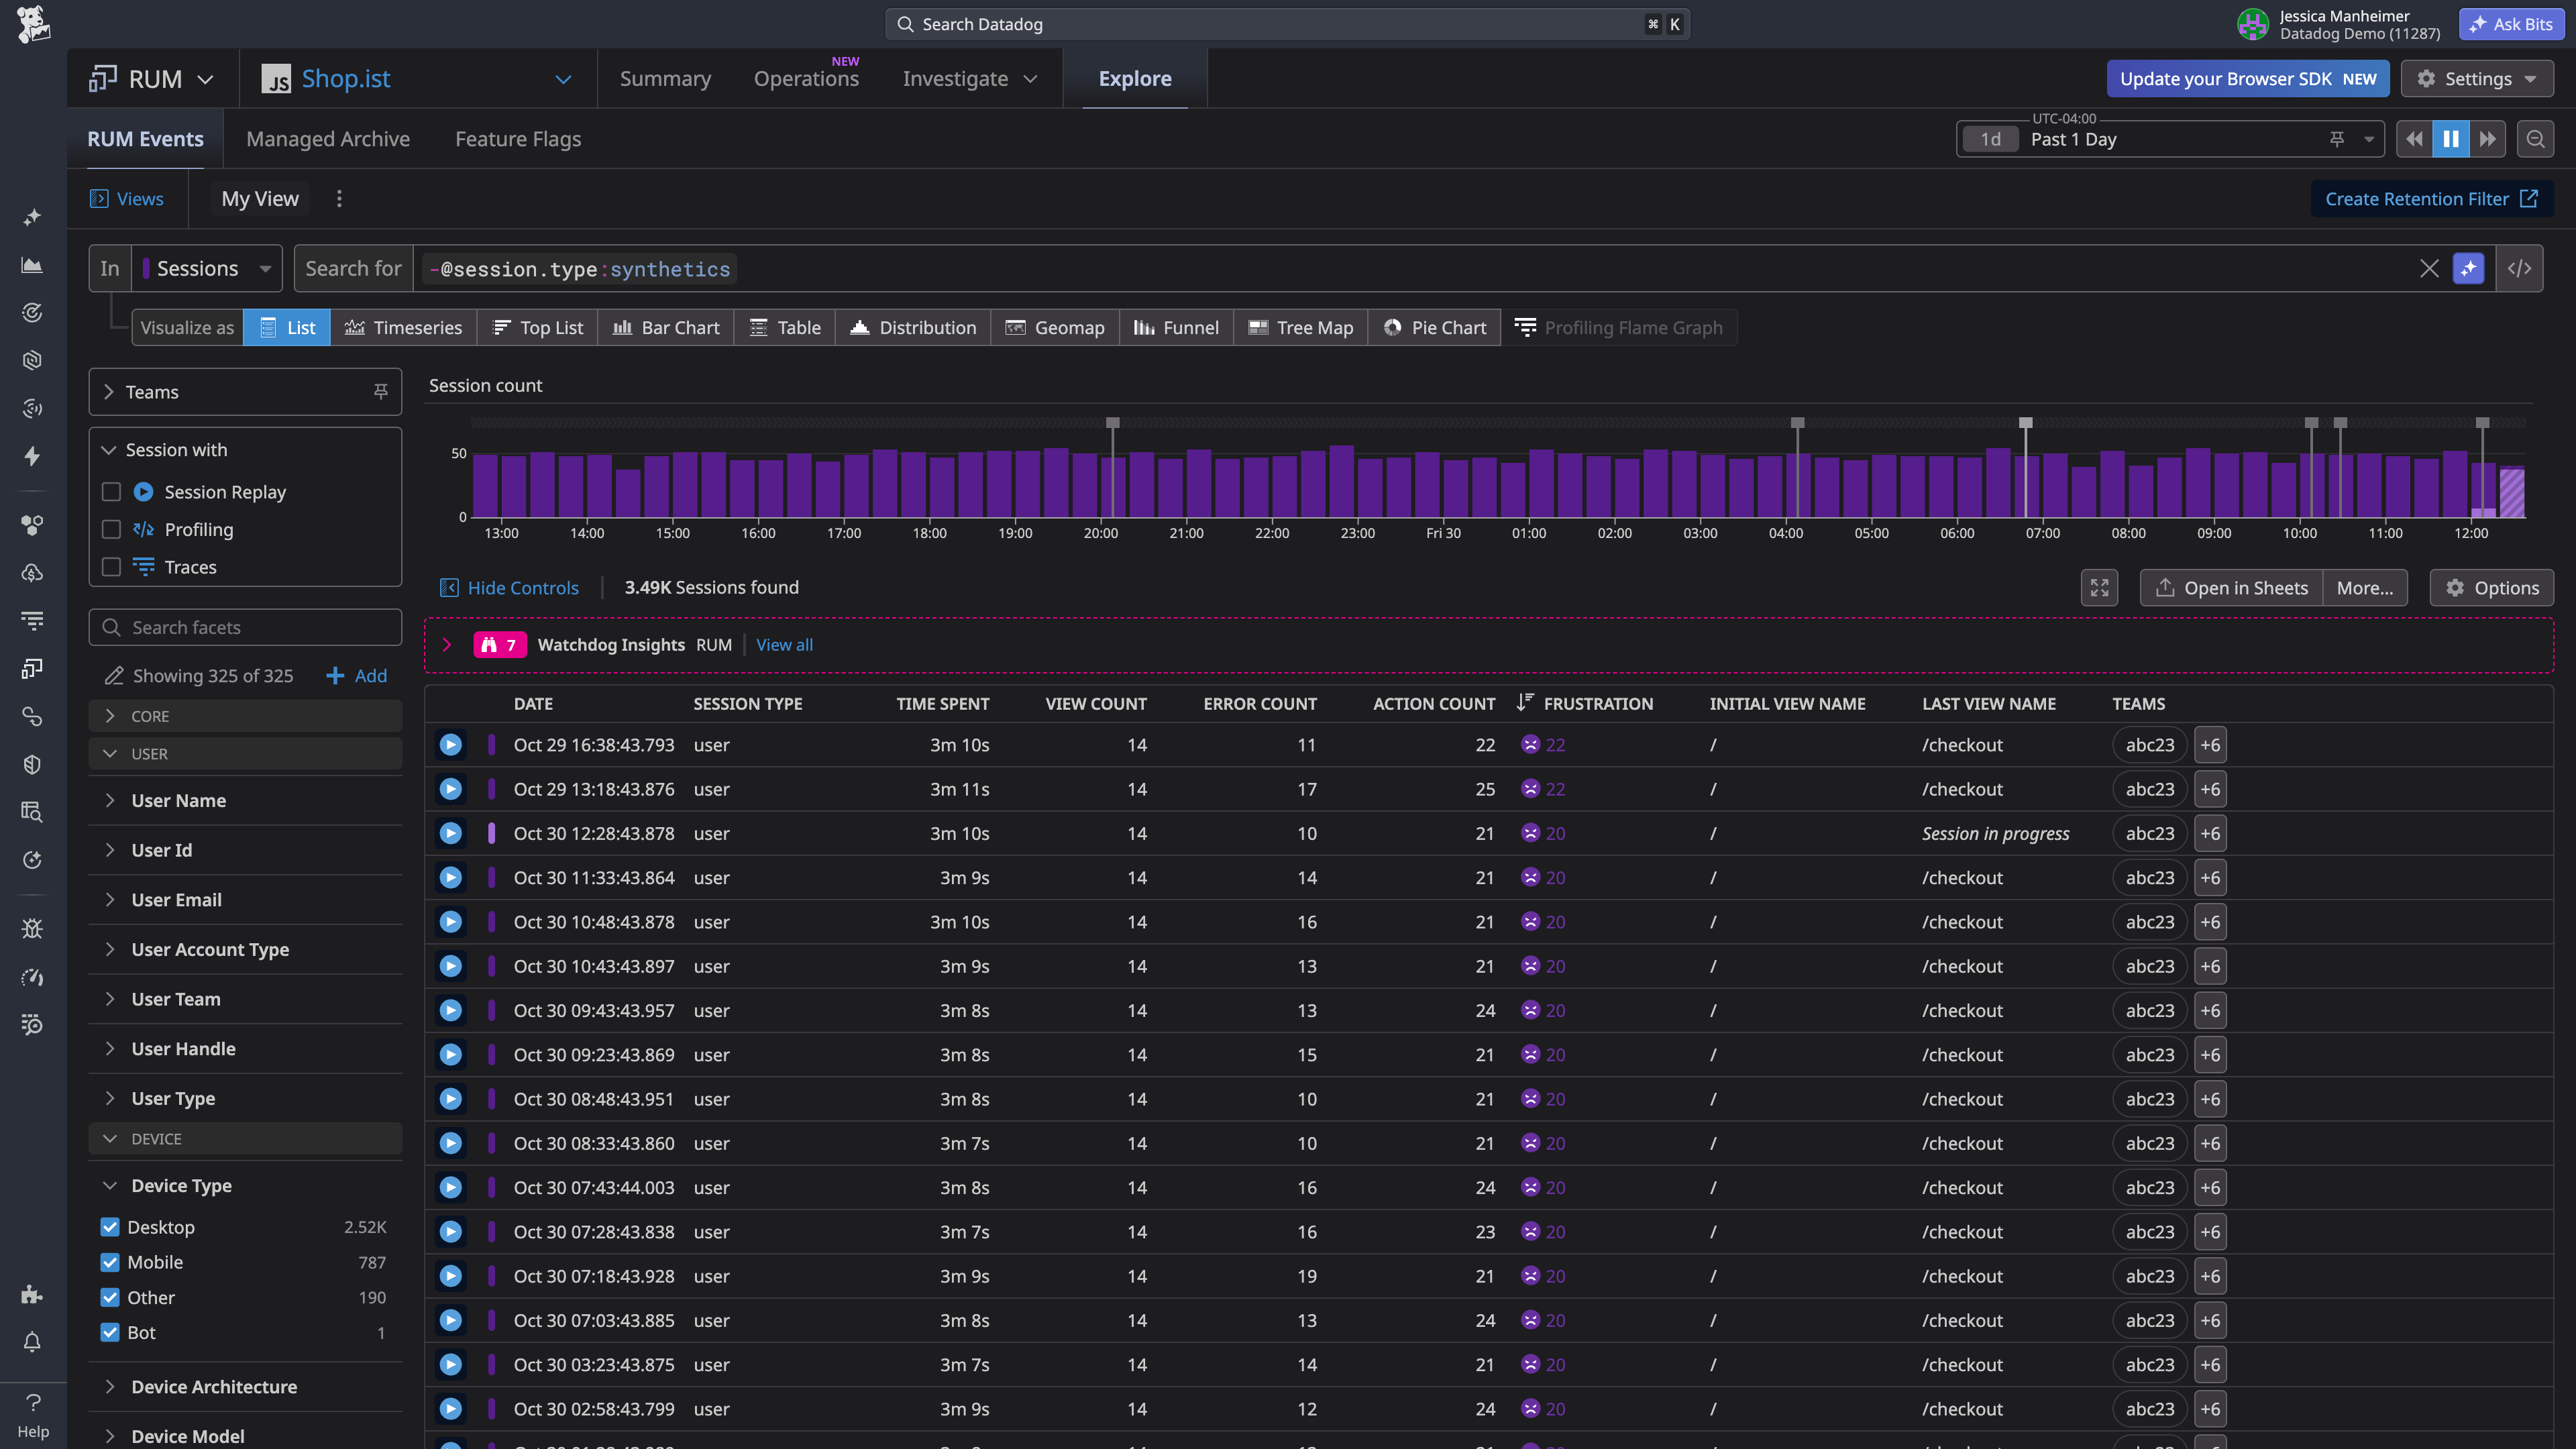
RUM without Limits™
Capture 100% of user sessions while retaining only the most valuable data with flexible retention filters.
Recovery and data ownership
Recover any session from Datadog-managed storage for investigations, or export raw events to your own cloud storage for analysis.
One workflow, Every platform
The same metrics, dashboards, and monitors work across web, mobile, desktop, and connected devices.
Step-by-step guides and complete reference material
Priced to measure everything and investigate what matters
Gain unified visibility into the availability and performance of your web and mobile applications
All prices shown are starting rates. From basic plans to bespoke offerings, Datadog offers the right level of support & services for any organization.
¹ RUM Measure billed annually or $0.22 on-demand
² RUM Investigate billed annually or $4.50 on-demand
³ Recovering a session from the archive is billed separately, under RUM Investigate, at 10x your contracted RUM Investigate rate
⁴ RUM Managed Archive billed annually or $0.30 (1 month), $0.45 (3 month), and $0.68 (6 month) on-demand
⁵ Session Replay billed annually or $3.60 on-demand
Customers delivering experiences millions of users depend on
See how teams protect app performance, usability, and reliability across web and mobile. Join 33,000+ organizations that trust Datadog.
User Monitoring (RUM) gives you full visibility into every user session on your web and mobile applications. It helps teams detect, investigate, and resolve frontend errors, crashes, and performance issues by correlating real user behavior with backend traces, logs, and infrastructure metrics.
Yes. One RUM product covers browser applications, native and cross-platform mobile apps, desktop, and connected devices, with consistent metrics and a single troubleshooting workflow across both.
Datadog RUM supports browser applications, the Android ecosystem (including Android TV and Android Automotive OS), Apple platforms (including iOS, iPadOS, tvOS, watchOS, and visionOS), Roku, Electron, and C++. On mobile, Datadog RUM also comes with SDKs for cross platform frameworks: React Native, Flutter, Kotlin Multiplatform, Unity, and .NET MAUI. The browser SDK adds dedicated plugins for React, Angular, Vue, Next.js, Nuxt, Salesforce, and Shopify.
A session is a continuous navigation on your web or mobile application, and it is the unit RUM meters and bills on. It can last up to 4 hours of continuous activity, and expires after 15 minutes of inactivity. Each session groups together every view, action, resource, error, and other events a user generates. When a mobile app contains webviews and both the web and mobile applications are instrumented, Datadog bridges them into one mobile session, and only that session is billable.
RUM collects by default the views, actions, resources, errors, and long tasks, along with context like app version, device, operating system, browser, and geography. You can enrich sessions with additional events and any custom attributes. Inputs are masked by default in Session Replay, and you can apply finer masking rules to control exactly what gets recorded.
RUM links outgoing network requests from your application to the backend APM traces and logs generated by the same requests, so you can move from a frustrated user to the responsible service in one click. RUM is a standalone product and does not require APM or Log Management, but connecting them is what helps you seamlessly troubleshoot across the stack.
RUM Measure applies to every session you collect. It powers 30+ metrics you can use in dashboards, monitors, and SLOs. Metrics are computed on 100% of your traffic and retained for 15 months. RUM Investigate applies only to the sessions your retention filters keep, and it gives you full session detail, error and crash tracking, profiling, and one click correlation to backend traces and logs.
RUM is billed per 1,000 sessions per month, split into two parts. RUM Measure covers your full session traffic at $0.15 per 1,000 sessions, and RUM Investigate covers the filtered sessions you retain in full detail at $3 per 1,000 sessions. Annual, month to month, and on demand rates are available, and add-ons like Session Replay are priced separately per 1,000 sessions.
Session Replay is a RUM add-on that records and replays any web or mobile session, so you can watch exactly what a user did before hitting an error. It shares RUM's data model, and inputs are masked by default to protect sensitive data.
You can start with a 14-day free trial of the entire Datadog platform. Instrumenting an application is as simple as importing the package and initializing the SDK. Most teams are collecting sessions within minutes, and you can create retention filters and monitors from the UI without redeploying.
Resources
Detect and resolve errors, crashes, and slowdowns across web, mobile, and desktop