

Aaron Kaplan
Technical Content Writer

Ryan Warrier
Senior Product Manager
In the first part of this series, we cataloged key metrics for Databricks data engineering, analytics, and Model Serving workloads. In this post, we’ll discuss how to collect those metrics and other telemetry data from Databricks and Apache Spark, which powers Databricks under the hood. We’ll cover collecting and querying telemetry data via system tables, as well as the other primary sources of visibility into:
Collect and query telemetry data via system tables
System tables are the primary resource for Databricks performance, cost, and usage analysis. They provide a wide range of telemetry data, from audit logs and cost records to performance metrics and SQL warehouse events.
The data contained in system tables is not real-time; its latency varies by schema. So while system tables provide far-reaching visibility into Databricks environments, don’t rely on them for up-to-the-minute alerting. For real-time monitoring of Databricks, you can use job notifications and Jobs API queries, as well as host-based telemetry data collected via monitoring agents or cloud providers.
By enabling system tables and delegating access via Unity Catalog, you can query a wide range of Databricks observability signals and analyze Databricks performance, cost, and usage through the Databricks UI as well as through external monitoring tools. From the Databricks UI, you can also create custom SQL-powered dashboards and alerts using any data source.
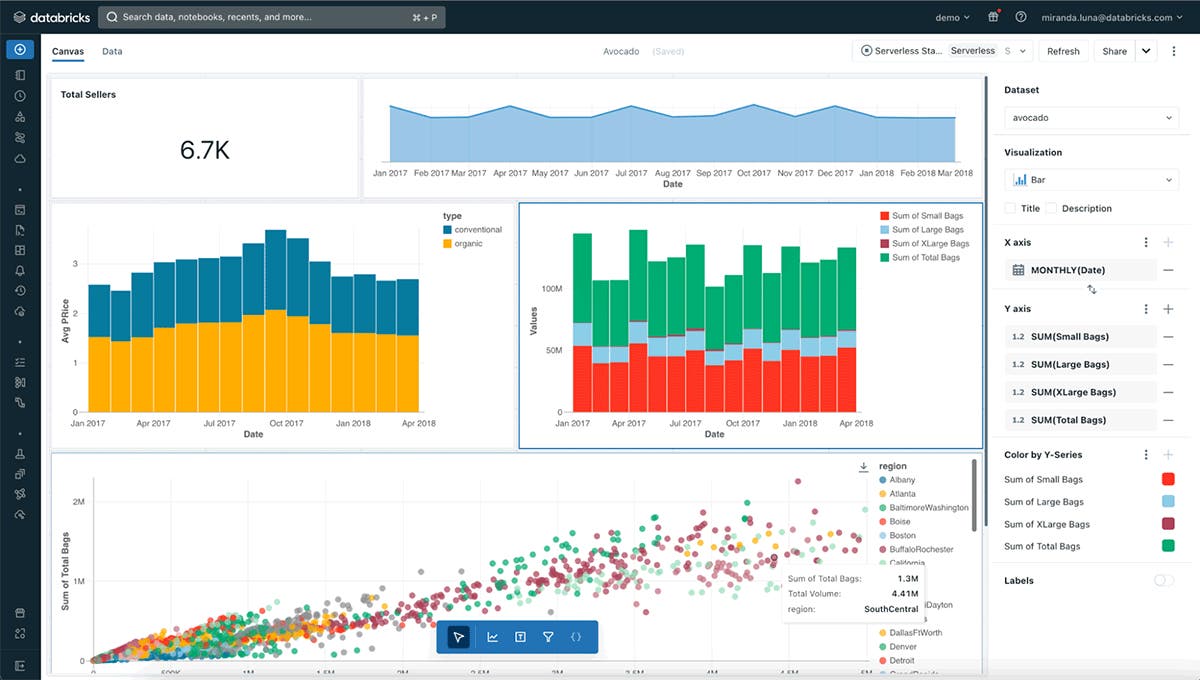
External tools can pull data from system tables via the Databricks SQL API for reporting and analysis. While system tables include operational data for all workspaces deployed within the same cloud region for your account, they can only be accessed through Unity Catalog-enabled workspaces. The billing schema is enabled by default, providing access to the system.billing.usage table, which includes cost data for all billable usage. All other system table schemas must be enabled manually.
Throughout this post, we’ll cover the system tables that are particularly useful for monitoring Databricks performance, including system.compute.*, system.query.history, and system.lakeflow.*, as well as complementary methods of monitoring performance through the Databricks UI.
Compute performance
System tables provide visibility into both classic and serverless Databricks compute. The compute schema exposes infrastructure-level performance data for all-purpose compute and classic compute jobs and pipelines (system.compute.clusters, system.compute.node_timeline, system.compute.node_types, system.compute.instance_events) as well as SQL warehouses (system.compute.warehouse_events, system.compute.warehouses). For serverless compute and SQL warehouse monitoring, the query schema exposes query-level metrics from the system.query.history table, and the Databricks UI offers query insights for serverless query performance profiling.
Classic compute clusters emit metrics and logs that can be collected via monitoring agents, forwarded to external storage, and accessed in Databricks via the Compute page.
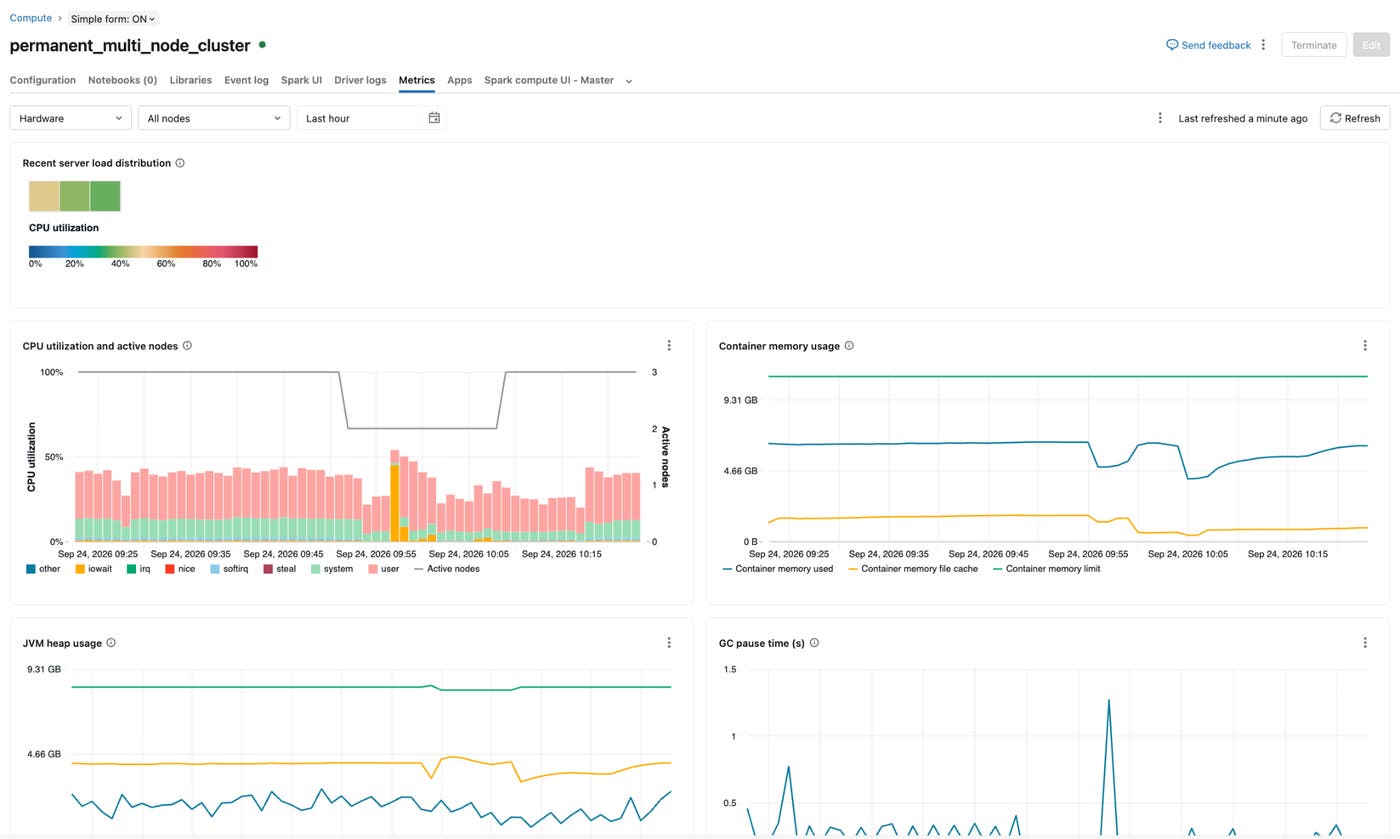
See the Databricks documentation to learn more about configuring compute log delivery destinations and retention.
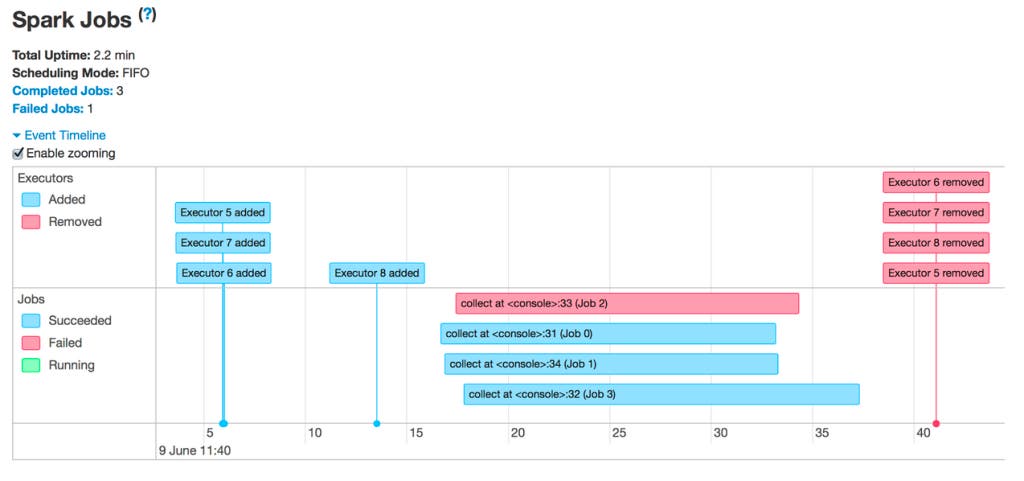
The Spark UI offers another layer of visibility into classic compute, enabling you to closely track and analyze Databricks job, pipeline, and query performance by monitoring the Spark jobs powering your Databricks workloads under the hood. You can use it to troubleshoot and optimize Spark job-level execution via the jobs timeline; DAG visualizations; metrics for skew, spill, shuffle, and streaming jobs; JVM thread dumps; and driver and executor logs. It is particularly useful for troubleshooting slow performance.
SQL warehouse performance
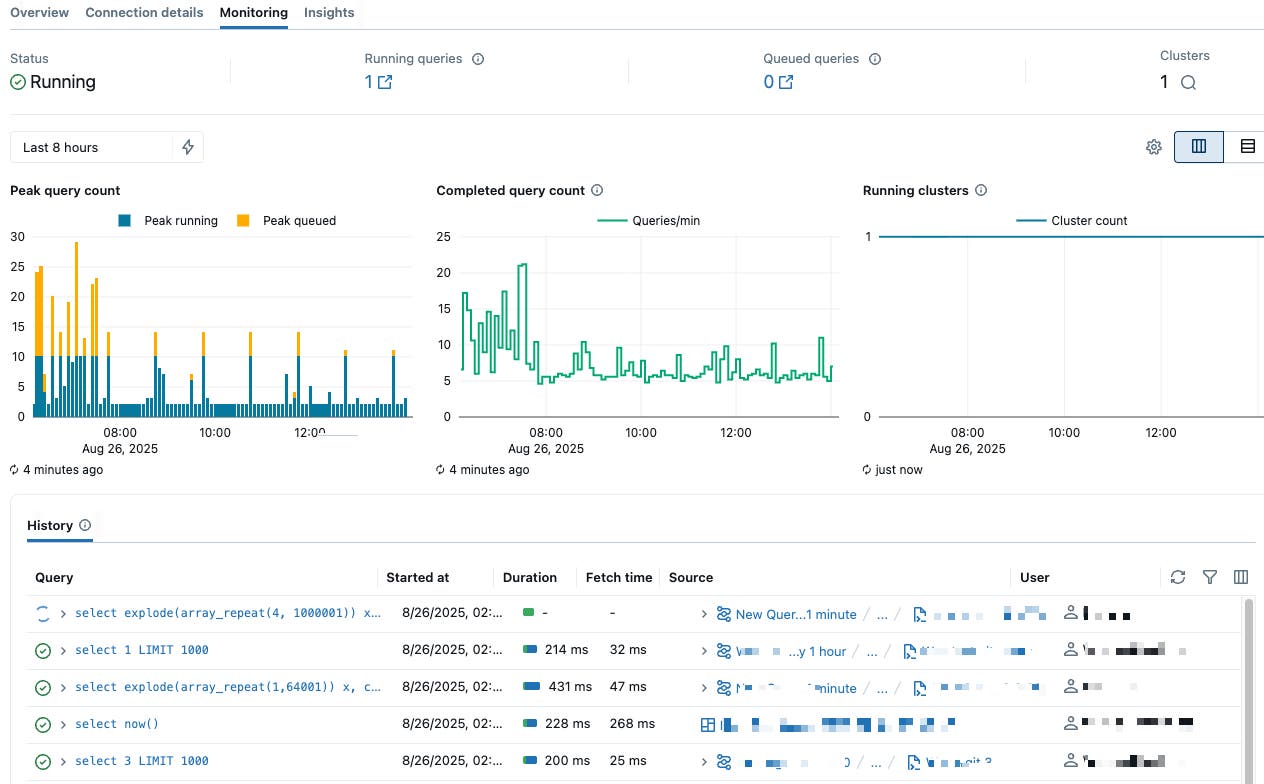
Alongside the system.compute.warehouse_events and system.compute.warehouses tables, the Databricks UI provides a dedicated dashboard for each of your SQL warehouses. SQL warehouse dashboards visualize a range of metrics alongside logs of active and historical query and cluster activity.
Job- and pipeline-level performance
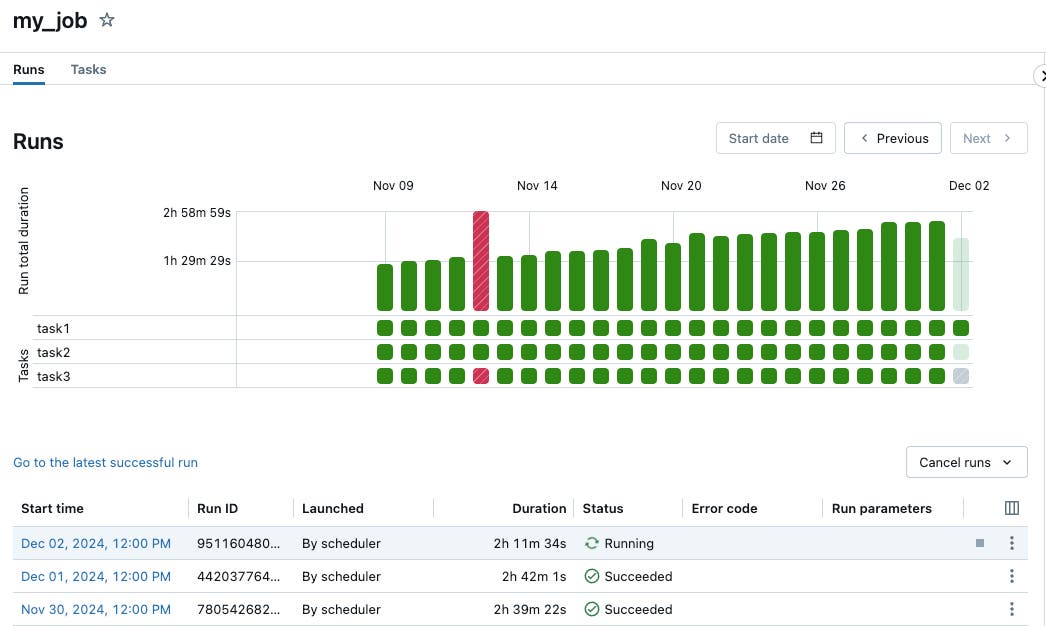
Tracking Databricks job and pipeline performance is essential to ensuring reliability and enabling optimization and troubleshooting of tasks and scheduling. The system.lakeflow.* tables provide job metadata such as job and task definitions and schedules (system.lakeflow.jobs, system.lakeflow.job_tasks), as well as job performance metrics (system.lakeflow.job_run_timeline, system.lakeflow.job_task_run_timeline). Because system.lakeflow.* data is not real-time, these tables should not be relied on for live alerting on job and task failures. To receive real-time notifications when jobs succeed, fail, start, or exceed expected durations, Databricks provides built-in job notifications that can be routed to email, Slack, Microsoft Teams, PagerDuty, or any HTTP webhook.
Databricks also provides detailed visibility into jobs and pipelines via the jobs and pipelines page, the pipeline event log, and the Spark Streaming Query Listener. The pipeline event log is SQL-queryable via the Pipelines API, and with the Spark Streaming Query Listener, you can send streaming metrics to external services.
Query-level performance
Along with being useful for monitoring serverless compute and SQL warehouses, visibility into query performance is important for root cause analysis and fine-tuned optimization of your Databricks jobs and pipelines. In addition to the system.query.history table, which you can use to track and dissect query durations, the query history page in the Databricks UI enables in-depth query performance profiling, and query insights surface Spark statement metrics inline for queries run on serverless compute.
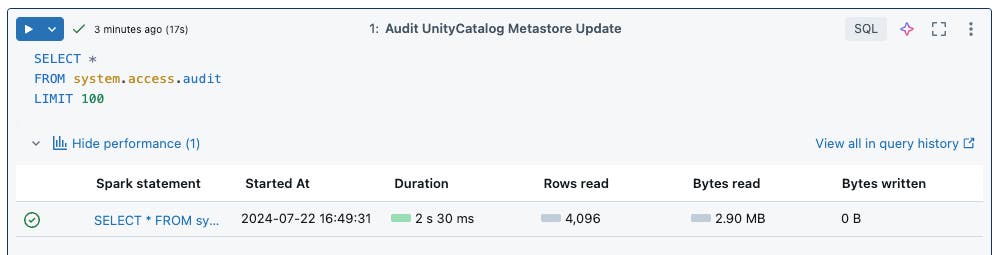
You can also access query history via the Databricks REST API.
Data quality and lineage
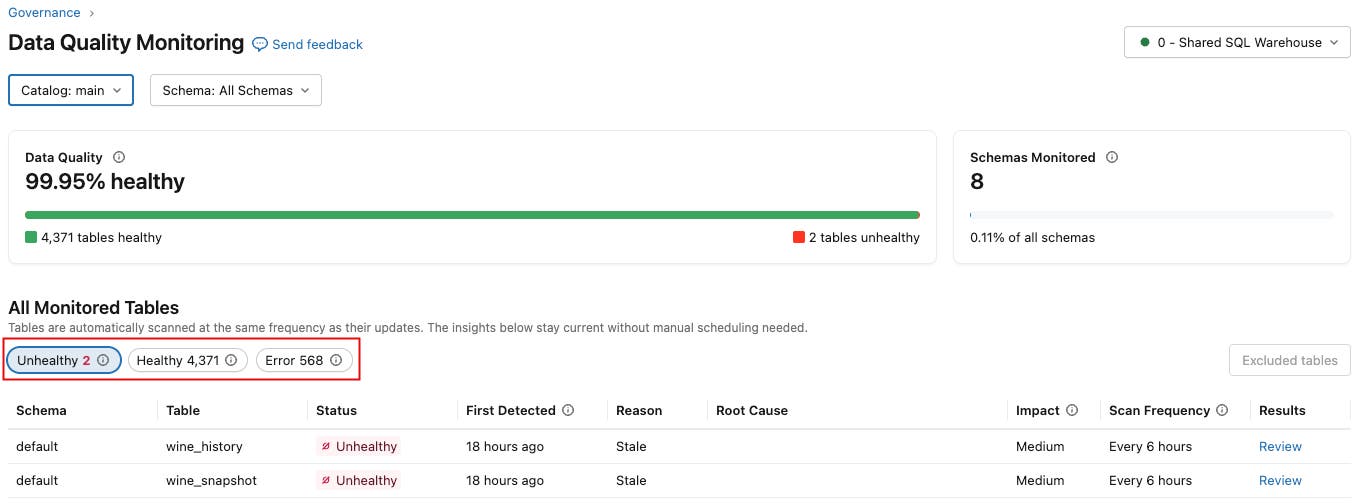
Monitoring data lineage can help you find upstream root causes of issues affecting your data and, more broadly, follow the movement and development of data throughout your pipelines. Databricks provides data profiling via Unity Catalog and a Data Quality Monitoring UI to help you track data quality and integrity. You can define profiles through the Databricks UI or the API in order to monitor critical metrics such as data completeness and freshness and use them to set SQL alerts. Databricks also provides anomaly detection that can help you track these metrics throughout schemas using the Data Quality Monitoring UI as well as health indicators in the Catalog Explorer.
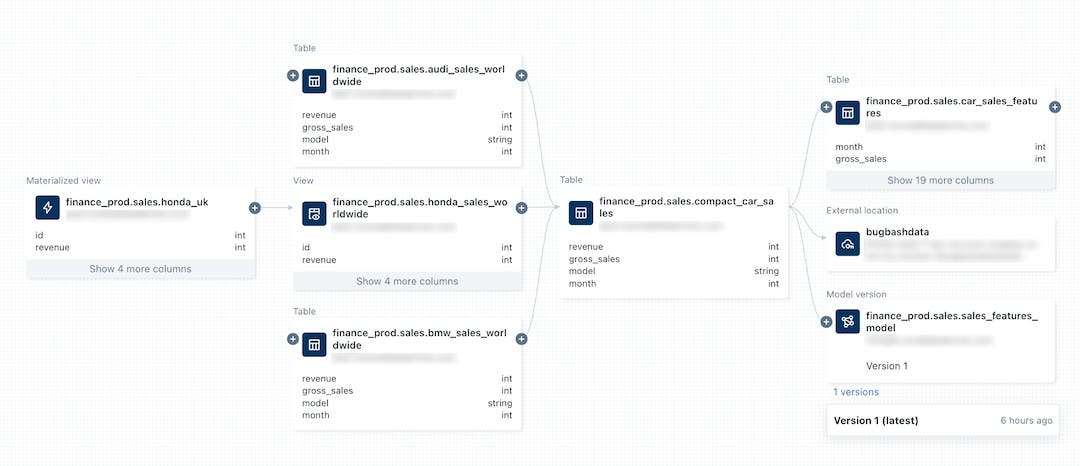
The system.access.table_lineage and system.access.column_lineage tables record lineage events, and their entity_metadata fields can be used to trace data events to specific jobs and notebooks. Databricks audit logs, which are queryable via the system.access.audit table, can be used to track actions taken across your account, such as configuration, schema, and permission changes. Together, these tables enable root cause analysis of issues affecting data quality. You can also enable audit log delivery to external storage. The Databricks UI visualizes lineage with lineage graphs in the Catalog Explorer, and Unity Catalog automatically captures lineage down to the column level for queries run on Databricks. The lineage system tables retain data over a rolling one-year window, while the Catalog Explorer retains lineage data indefinitely. Unity Catalog also allows you to add lineage metadata from external sources.
Finally, you can collect Spark-level lineage metadata from Databricks by installing the OpenLineage Spark integration on classic compute clusters. From there, you can store and visualize this data using tools like Marquez (a popular open source solution) or Datadog (as we’ll discuss in Part 3 of this series).
Model Serving performance
Model Serving deploys AI/ML models and agents behind HTTPS endpoints on Databricks-managed serverless compute. Databricks provides a range of resources for tracking Model Serving performance in order to optimize and troubleshoot AI/ML workloads. It exposes endpoint health metrics in the OpenMetrics format at https://[DATABRICKS_HOST]/api/2.0/serving-endpoints/[ENDPOINT]/metrics, so you can track live request and error counts, latency, and compute usage with Prometheus, Datadog, or any OpenMetrics-compatible agent.
From the Databricks Serving UI, you can access endpoint health metrics from the previous 14 days. You can also access service and build logs from the UI or through the API; service logs are ephemeral, while build logs are retained for up to 30 days.
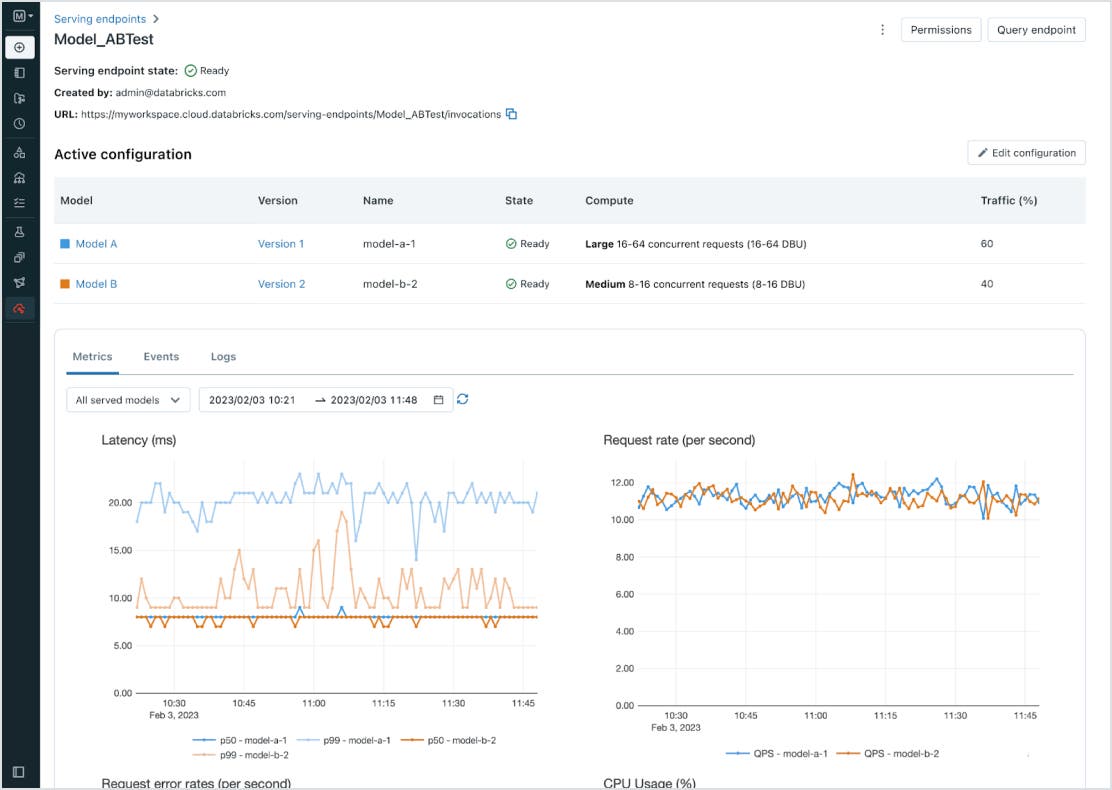
Databricks also logs Model Serving endpoint inputs and responses in inference tables, which capture requests and responses for AI/ML performance analysis. Inference tables must be enabled for individual endpoints. You can track model performance by defining data profiles and SQL alerts on your inference tables, and Databricks provides customizable LLM judges and scorers for tracking model and agent performance.
For Model Serving endpoints that sit behind the Databricks AI Gateway, you can also access metrics via the system.ai_gateway.usage table for performance monitoring and cost tracking.
Comprehensively monitor Databricks
In this post, we’ve surveyed the primary monitoring solutions provided by Databricks, including system tables, the Databricks UI and SQL API, the Spark UI, and built-in job notifications. In Part 3 of this series, we’ll show you how to use Datadog’s Databricks integration and Data Observability: Jobs Monitoring for comprehensive monitoring of your Databricks data engineering, analytics, and Model Serving workloads.
