Emily Chang
This is the first post in a series about Datadog's latest feature enhancements. This post focuses on new and improved integrations and data collection features. The other installments in the series focus on alerting enhancements and new features for graphing and collaboration, respectively.
Whether your infrastructure is cloud-based, on-prem, serverless, containerized, or all of the above, being able to identify and troubleshoot issues across every layer of your stack is more important than ever before—and also more challenging. As our users' environments have become more diverse and dynamic, Datadog has continually expanded its capabilities to meet the challenges of monitoring at scale.
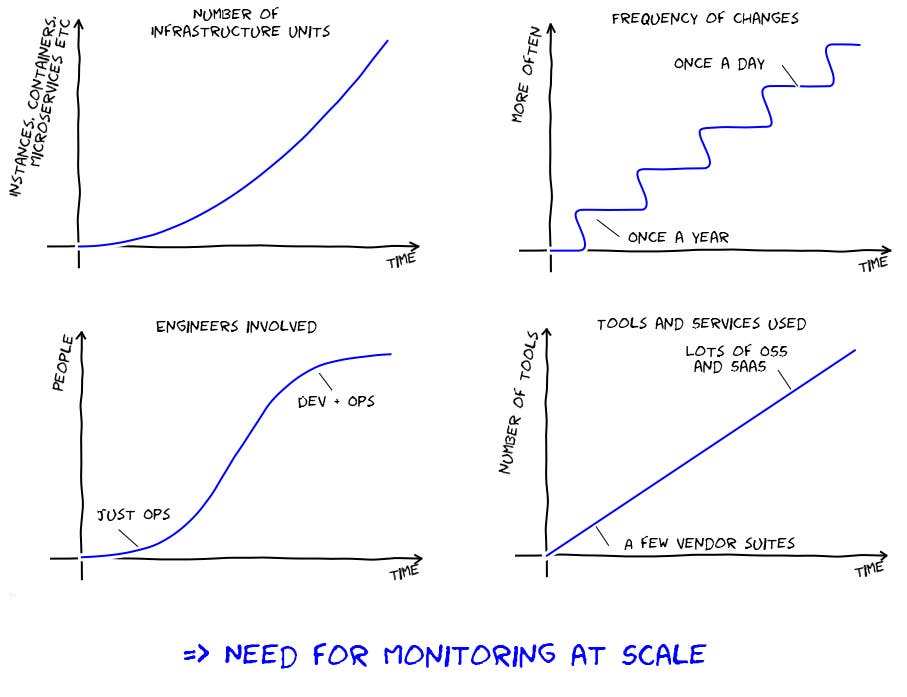
In this series, we will highlight several recent features and enhancements we've developed to help our users gain full observability. This post focuses on our newest integrations and data collection features. Even if you're already a Datadog customer, we hope you'll discover new features that will prove useful for monitoring your infrastructure and applications.
More coverage, better observability
At Datadog, it's no secret that we believe in collecting all of the data you can, and analyzing it to quickly identify and resolve performance issues. With this objective in mind, we are always working to add new integrations to get more data into Datadog, and new features to make it easier to aggregate, analyze, and make decisions based on that data. Three highlights from the past several months:
Application performance monitoring
Datadog's expansion into application performance monitoring was arguably our biggest development over the past year. APM is now bundled with the Datadog Agent, so you can easily deploy it across your entire infrastructure with a one-line installation. Like the rest of the Datadog Agent, all of the source code for our APM instrumentation is open source and completely customizable.
At launch time, Datadog APM supported applications written in Ruby, Python, and Go, and more languages are now being added. APM also includes auto-instrumentation for popular web frameworks like Django, Ruby on Rails, and Gin, as well as data stores like Redis and Elasticsearch. You can also collect custom traces from your applications using our open source client libraries. With APM built into Datadog, you can track application performance and trace requests across service boundaries, then investigate issues by drilling down into the underlying infrastructure. Get the rundown in this two-minute video:
More metrics, integrations, and dashboards
In the past year or so, Datadog has added or expanded dozens of integrations to bring more visibility to the tools and services you’re already using. Among our newest integrations:
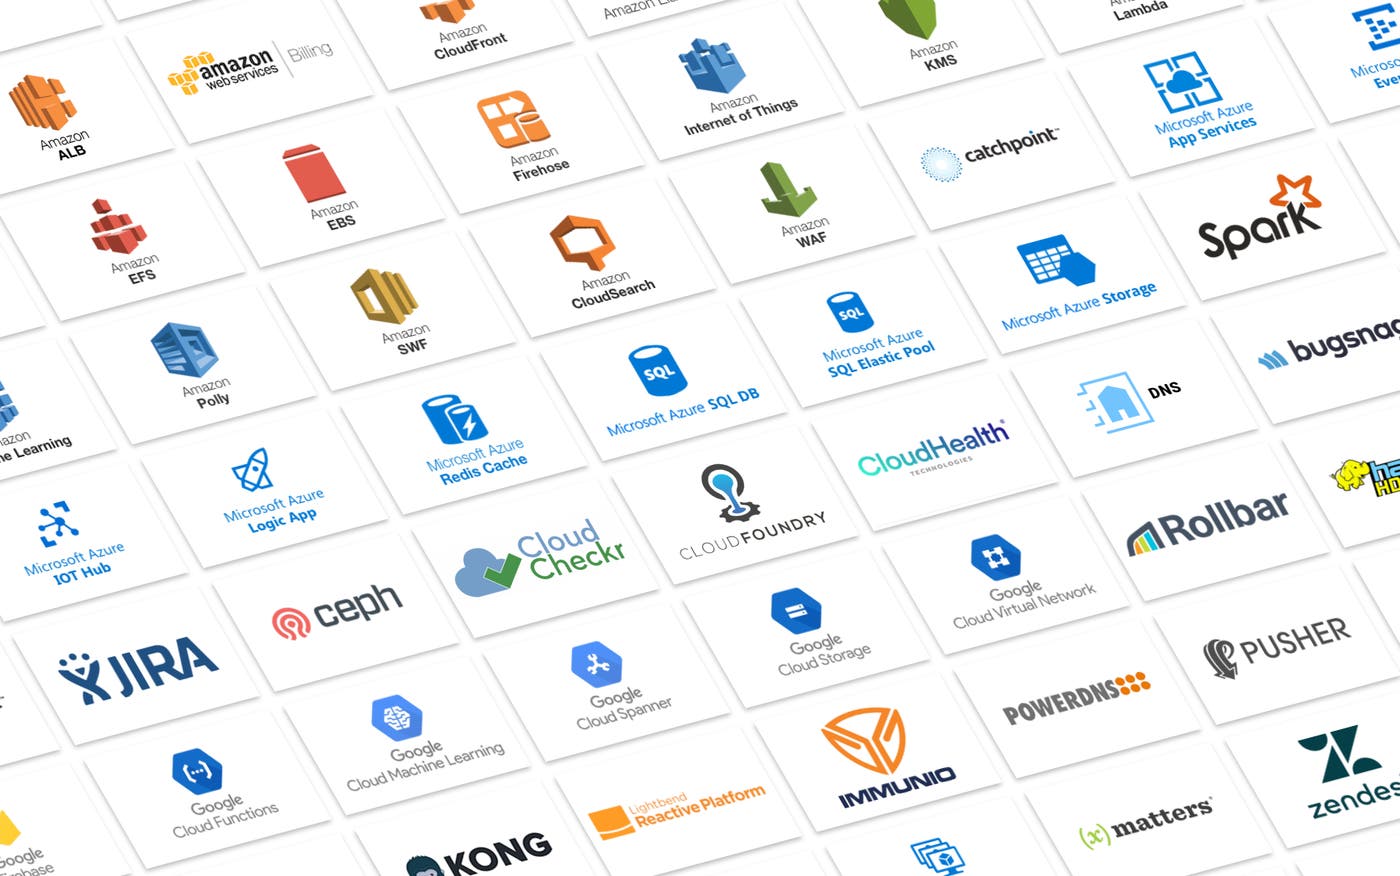
AWS: Application Load Balancer, Billing, CloudFront, CloudSearch, Elastic Block Store, Elastic File System, Elasticsearch Service, Firehose, IoT, Key Management Service, Lambda, Machine Learning, Polly, Simple Workflow Service, Trusted Advisor, Web Application Firewall, and Workspaces
Google Cloud Platform: Cloud Spanner, Datastore, Firebase, Functions, Machine Learning, Storage, and VPN
Microsoft Azure: App Services, Event Hubs, IoT Hub, Logic Apps, Redis Cache, SQL Databases, SQL Elastic Pool, Storage, and VM Scale Set
Hadoop: HDFS, MapReduce, YARN, and Spark
Platforms and management tools: Ceph, CloudCheckr, Cloud Foundry, CloudHealth, Kong, Lightbend, Pusher, and Terraform by HashiCorp
Other monitoring tools: Catchpoint, IMMUNIO, and xMatters
DNS: DNS Service Check and PowerDNS Recursor
We also enhanced many of our existing integrations by adding new metrics and/or improved out-of-the-box dashboards.
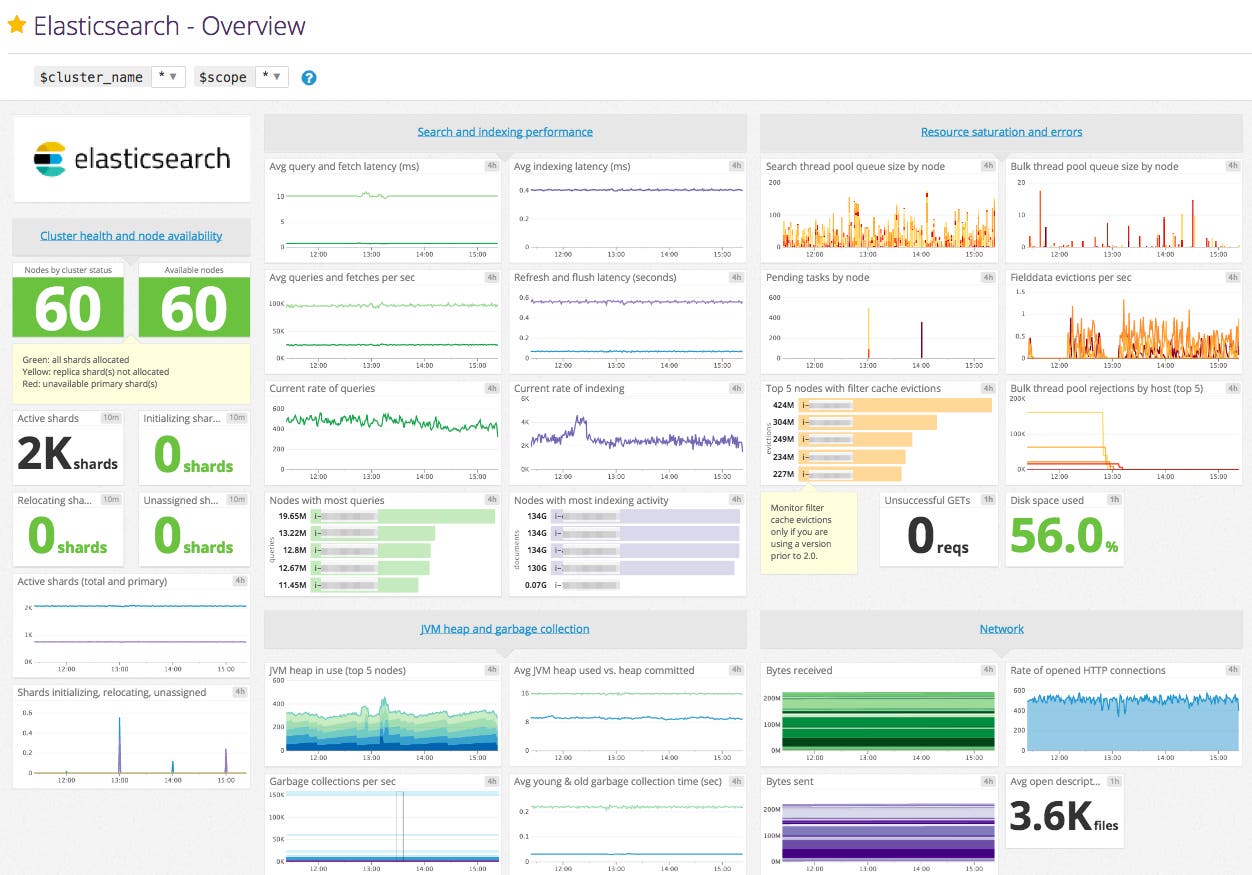
We now support more than 1,000 infrastructure technologies. If you'd like to learn more about how to contribute new integrations or enhance existing ones, please consult our contribution guide.
Autodiscovery: Monitoring services across containers
According to our latest Docker report, containers churn nine times more quickly than VMs, with an average lifespan of only 2.5 days. With containers constantly starting, stopping, and shifting across hosts, it becomes increasingly difficult to keep track of where your services are running at any given moment.
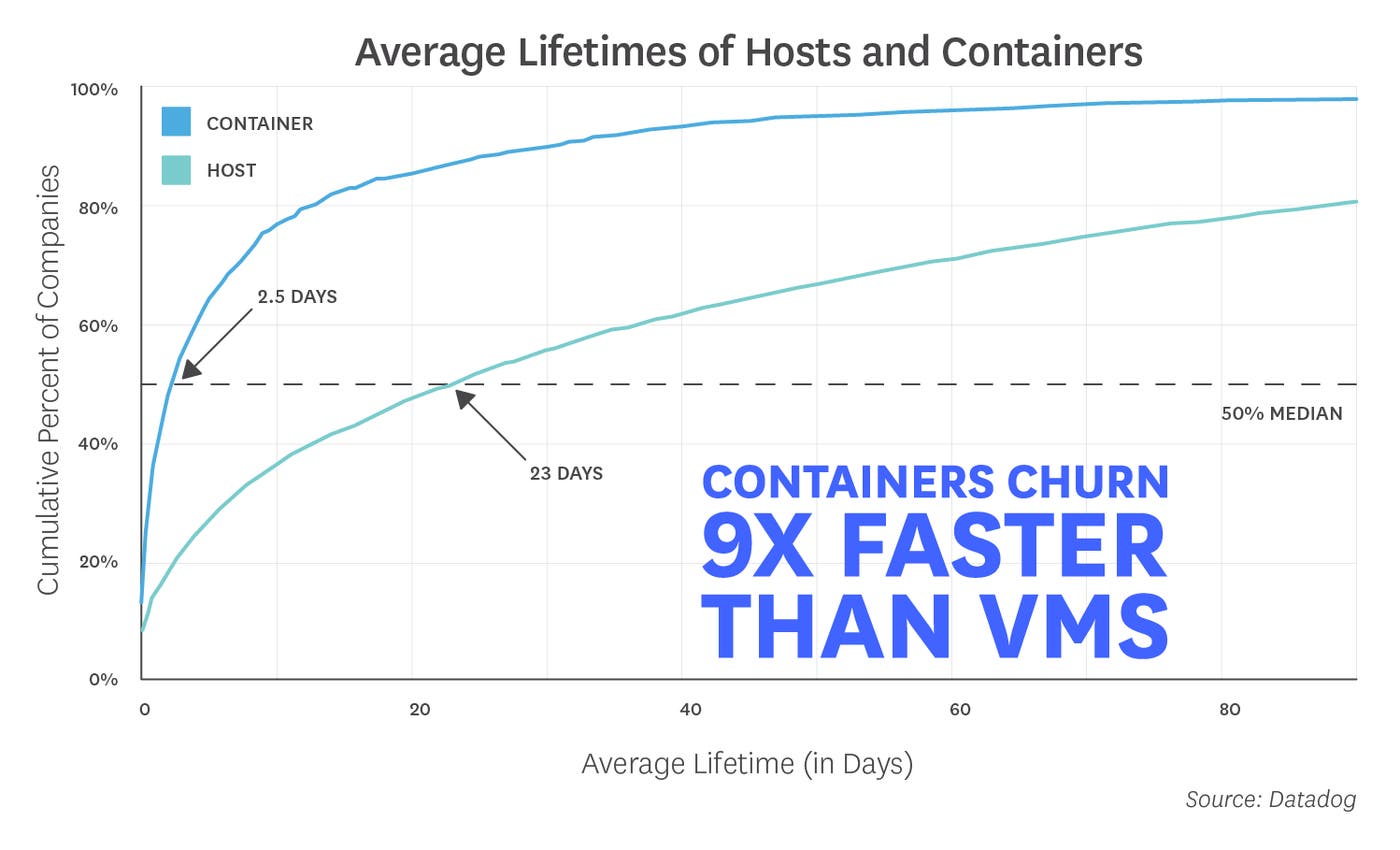
Datadog's Autodiscovery feature makes it much easier to automatically collect and aggregate data from your containerized services and track containers' lifecycle events. Autodiscovery can continuously detect and monitor which services are running where, enabling you to seamlessly track application performance on ephemeral containers. You can even use configuration variables like %%host%% and %%port%% to dynamically apply your monitoring across changing infrastructure.
If you're using Docker and haven't yet enabled Autodiscovery, read our guide to get started.
Metrics -> Alerts!
In this post, we highlighted a few ways in which we've helped our users collect more metrics from their infrastructure and applications. If you're already a customer, you can start using these new features right away. Otherwise, get started with a free trial.
Once you've collected all of the data you need to monitor, alerts will help you automatically detect if those metrics approach problematic thresholds or reflect abnormal patterns. In the next article in this series, we'll explore some of the enhancements we made to alerting and algorithmic monitoring.
