K Young
Datadog APM is now available to all Datadog customers.
When troubleshooting a modern application, you need to understand not only its code, but also how its execution is affected by the underlying infrastructure. To help provide full-stack observability for modern applications, we have expanded Datadog's capabilities to include application performance monitoring (APM).
Datadog APM includes:
Distributed tracing of requests from end to end, across every service and host involved
Detailed performance overviews for each monitored service
Latency distributions and percentiles, plus full decompositions of how much each service contributes to aggregate latency
See APM in action in this two-minute video:
Dev & Ops: the traditional divide
Traditionally, APM and infrastructure monitoring have been provided by separate tools. These tools focused on different layers of the stack, and they were used by different people: APM was for developers, and infrastructure monitoring was for IT or Ops teams.
Now that devops has united dev and ops, and now that infrastructure changes rapidly with autoscaling, microservices, and containerization, this divide no longer makes sense. When code and infrastructure are both moving targets, you can't fully understand their intertwined behavior by observing them separately.
Full-stack observability
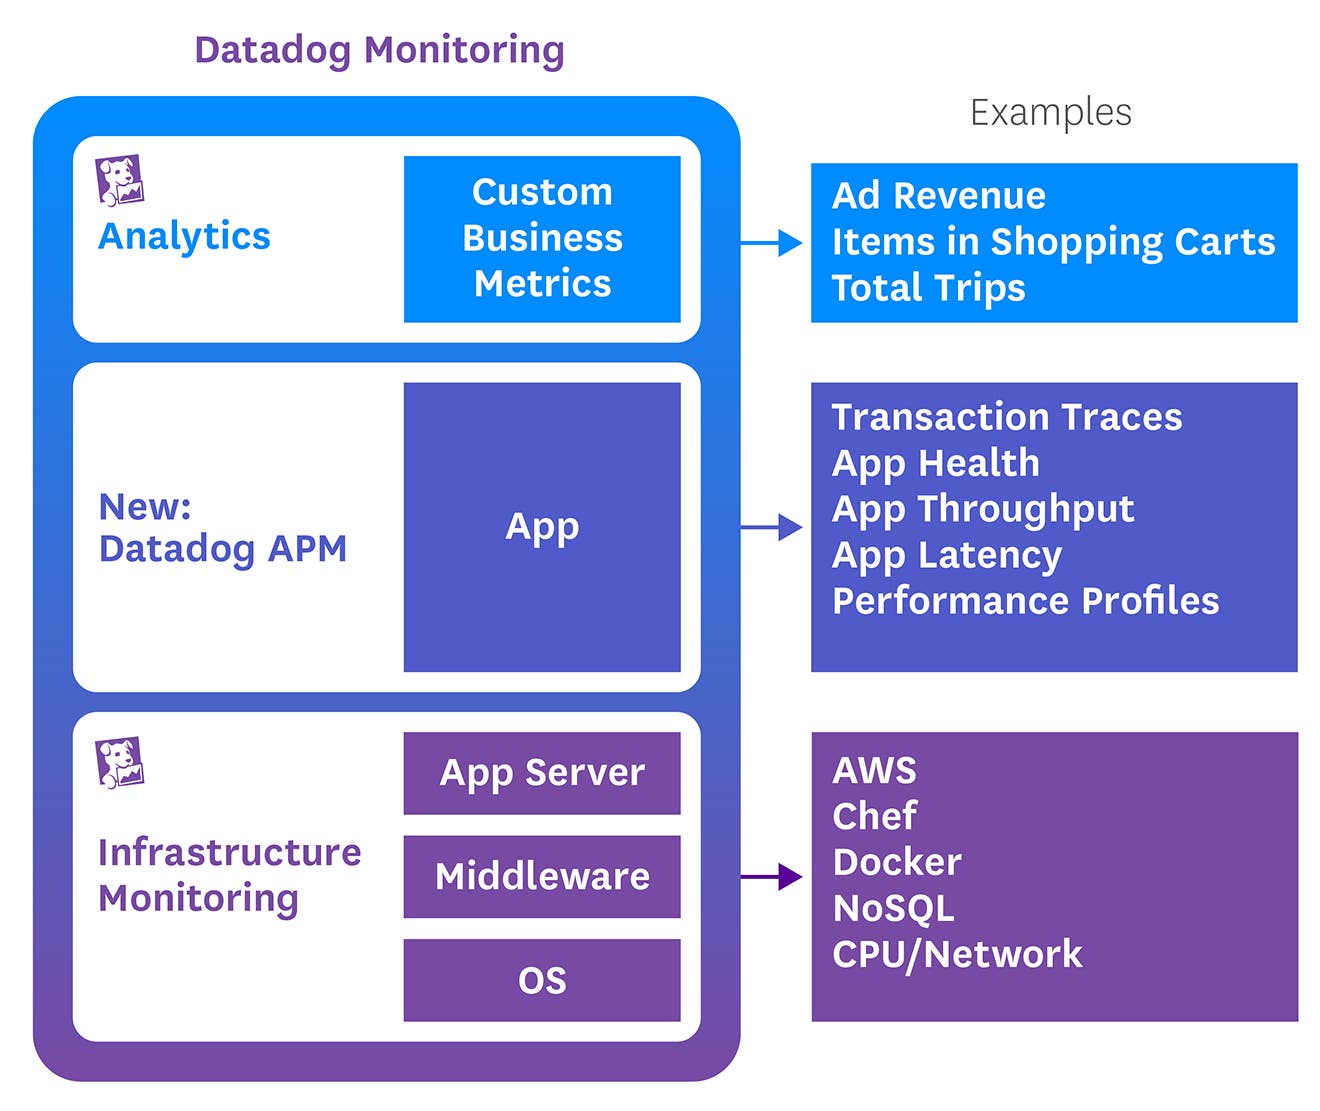
Most of you are using Datadog today for two things: 1) to monitor your infrastructure and 2) to support higher-level analytics of key business metrics. Our goal with Datadog APM is to bridge the gap between these two use cases and provide full-stack observability.
Next-generation APM
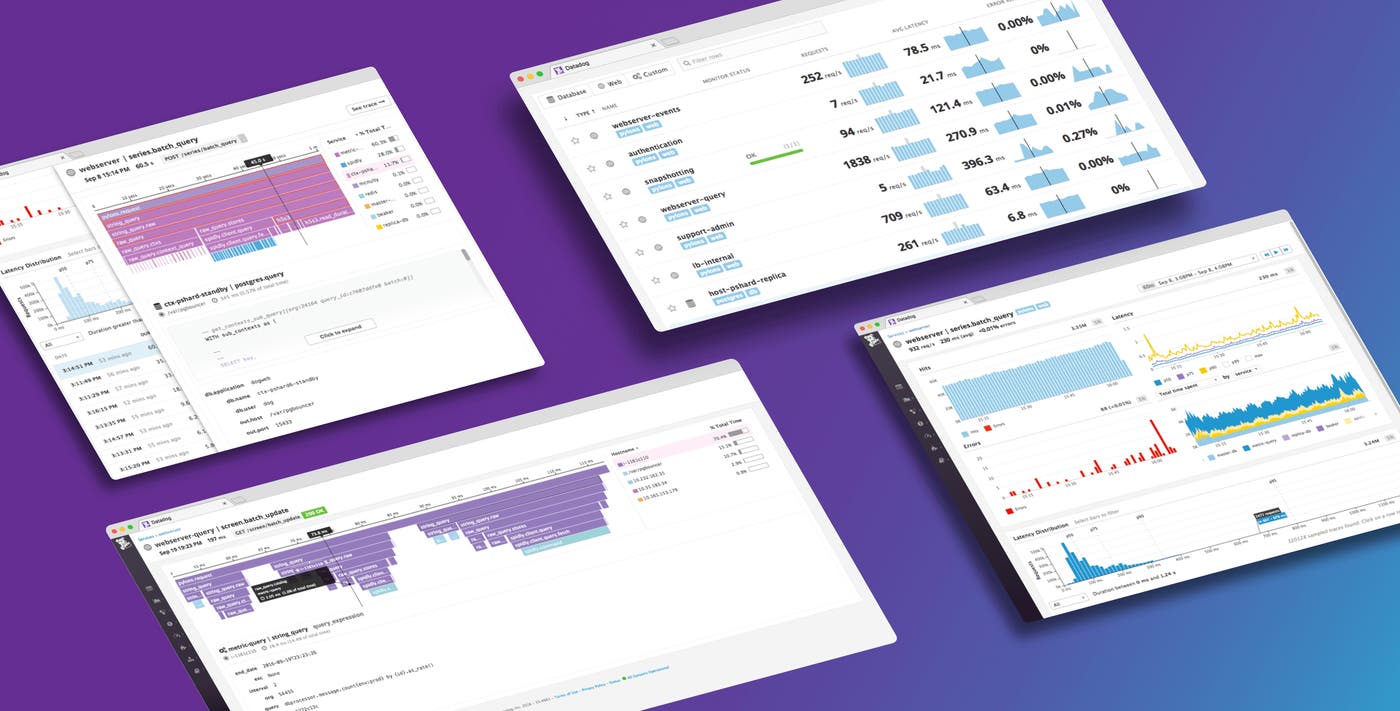
Datadog APM gives you powerful tools to observe and optimize modern applications. It enables you to see exactly where your requests go and which services or calls are contributing to overall latency. The lightweight agent is designed to be deployed on every host in your infrastructure, so it generates gap-free distributed request traces even in the most complex microservice architectures. APM also provides multifaceted performance metrics for each service, which you can use in Datadog graphs and alerts.
We built our APM functionality to be:
Infrastructure-aware
Deployed in minutes
Endlessly customizable
Comprehensive
An integral part of Datadog, so it includes long data retention, built-in collaboration tools, and more
Infrastructure-aware
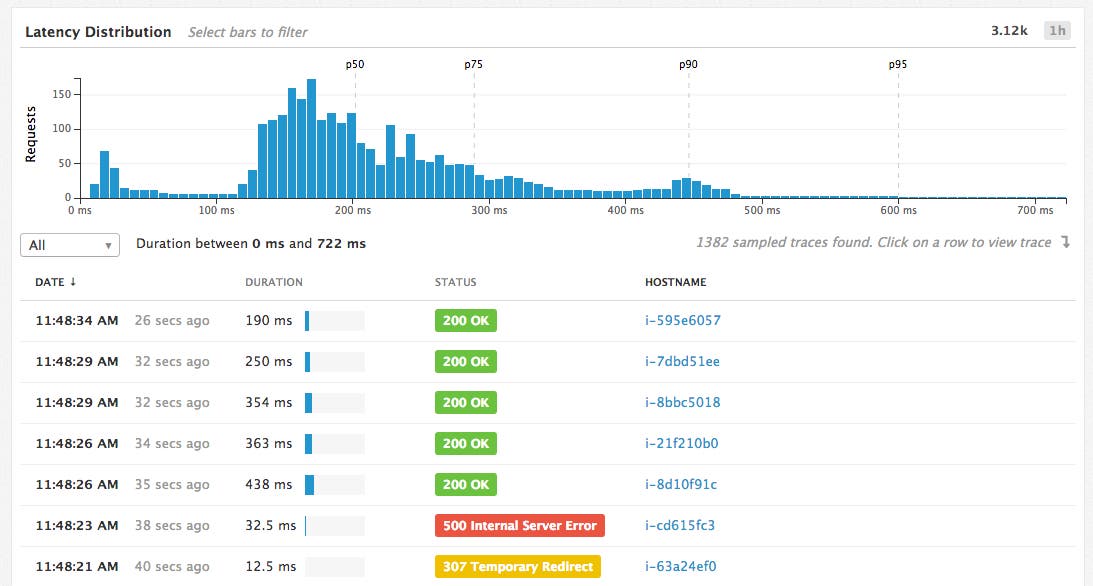
Our APM understands infrastructure: whether it’s on-prem or in the cloud, whether it’s manually orchestrated or automated, and whether it’s running on bare metal, VMs, or containers. Datadog APM will identify the exact hosts, containers, databases, APIs, and other components that were part of the execution path—even as these hosts come and go in an ever-shifting cloud environment. Datadog gives you the ability to quickly troubleshoot problems by diving down into the right infrastructure metrics, without switching tools or contexts.
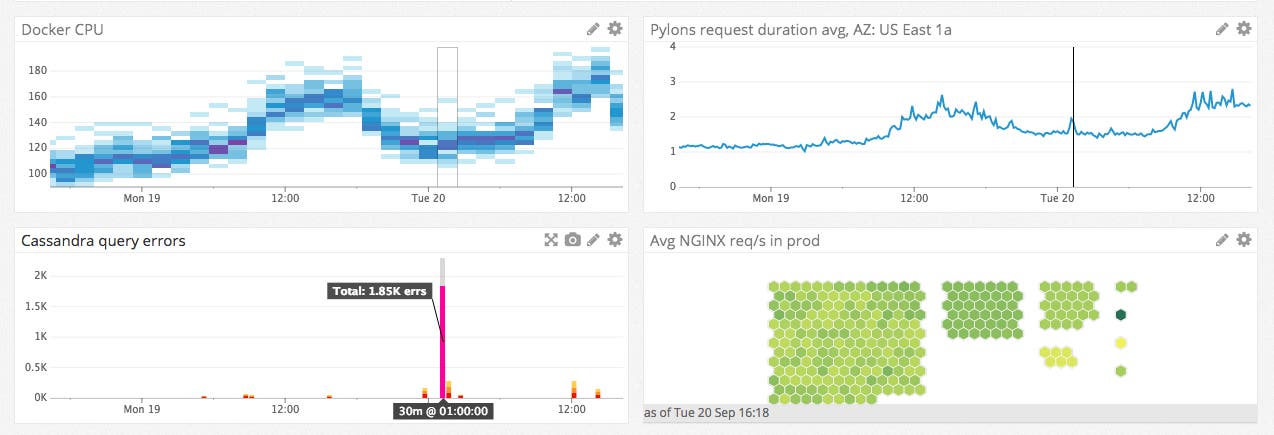
Just as important for full-stack correlation analysis, you can also mix metrics from your application and your infrastructure in a single dashboard—or even a single graph.
Deployed in minutes
APM is deployed just like the rest of Datadog: with a one-line agent installation that includes integrations with common web frameworks, data stores, and other infrastructure components. That means that you can roll out Datadog across your entire infrastructure in minutes.
Endlessly customizable
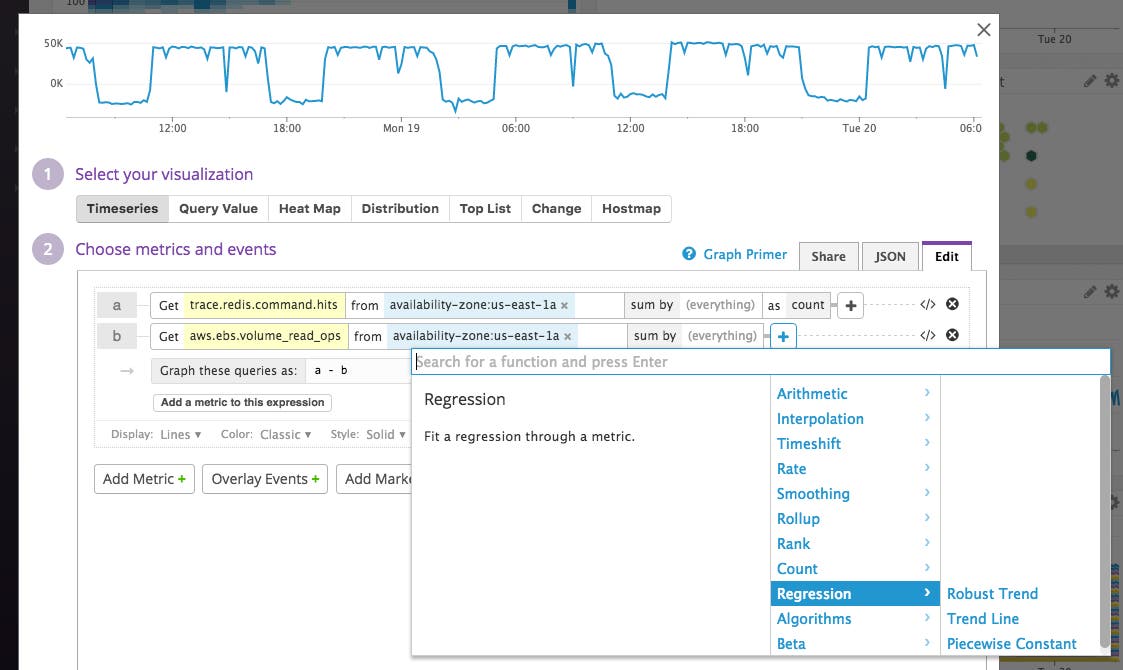
Like the rest of Datadog, APM is easily customized to fit your needs:
Instrument custom applications using our open source agent and client libraries
Track performance using auto-generated service-level overviews, or create your own drag-and-drop dashboards
Use built-in functions to transform your performance metrics, or apply sophisticated algorithms for outlier or anomaly detection
Navigate and filter traces in Datadog to quickly isolate problematic requests
Comprehensive request tracing
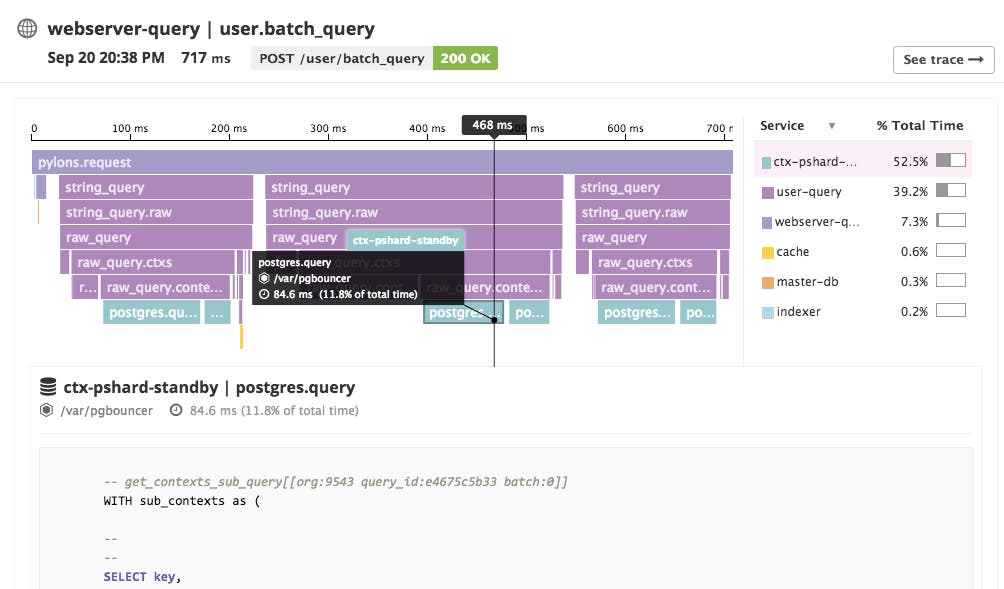
You can't have full-stack observability if your monitoring platform is only collecting data from a subset of your hosts. That's why Datadog APM is designed for simple, widespread deployment. Once you deploy the agent and install the client library, Datadog will automatically trace requests from end to end, wherever they go: across services, databases, caches, etc. You can also trace requests as they cross infrastructure boundaries—moving between hosts, data centers, cloud providers, and so on. That means you can identify bottlenecks in microservice architectures and other complex environments just by looking at flame graphs and service summaries.
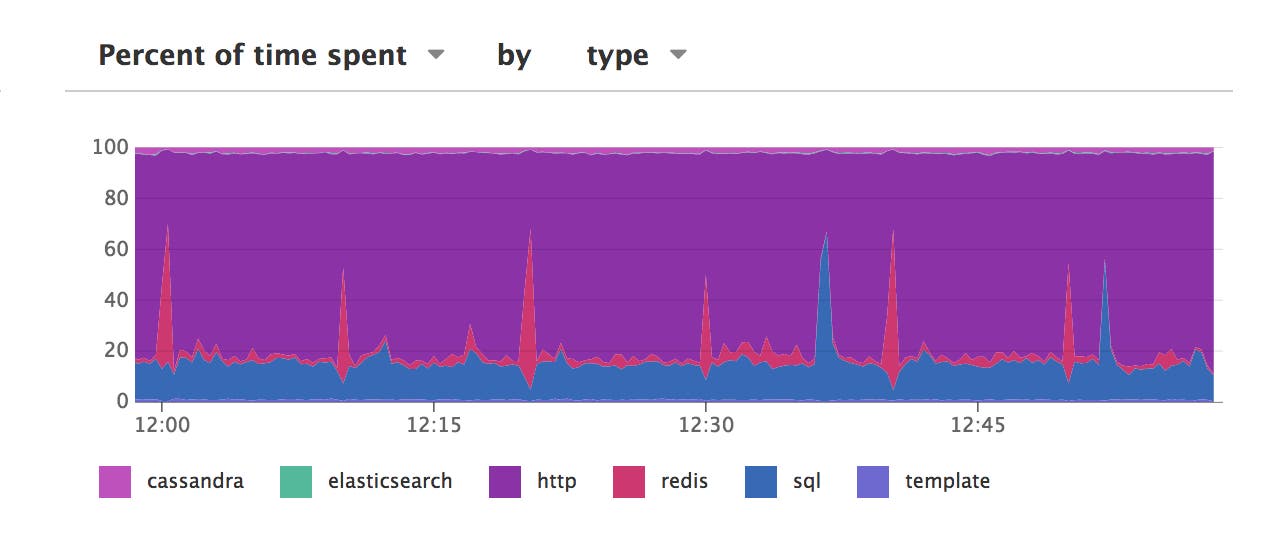
Your runtime investigation is virtually unlimited as you can aggregate, filter, drill up, or drill down through requests and individually traced steps. Each step of a trace also offers rich metadata so you can answer ad hoc questions such as "which requests touch a particular database table?", or "which requests call a function in a certain way?".
Rather than providing a one-sided view by surfacing only the slowest requests, Datadog's intelligent sampling captures a comprehensive set of traces for a complete view of your application's performance.
Core Datadog features
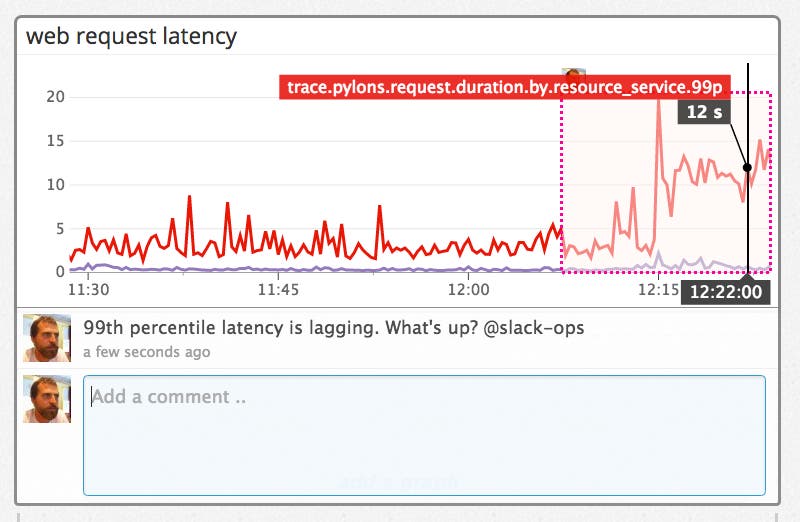
If you use Datadog already, then you're familiar with some of the beloved core features that we've included in our APM:
Rich collaboration features and integrations to keep large teams in sync
Sophisticated alerts that provide actionable context
Metrics retained for 15 months at full granularity
Get started with next-generation APM
Datadog APM is now available in Datadog. If you don't yet have a Datadog account, you can try next-generation APM for yourself with a free 14-day trial.
