John Matson
Azure Event Hubs is a service for building real-time data pipelines in the Microsoft Azure cloud. Data is sent to an Event Hub in messages called “events”, each of which represents a discrete occurrence or measurement such as a user’s in-app action or a device reading. The Event Hub then stores the events in sequence for a configurable retention time, allowing “consumer” applications to stream or replay data from the Event Hub as needed. The service has many similarities to Kafka and the AWS Kinesis service offered in the Amazon cloud.
Whatever infrastructure you use, we aim to bring you full observability. So we’re pleased to announce that you can now monitor your Event Hubs alongside your Azure VMs, Azure SQL Databases, Azure App Service applications, and more.

Keep your hubs humming
Event Hubs are designed for high throughput and low latency, but their capacity is constrained by the number of throughput units provisioned for a given Event Hub namespace. That’s why it’s important to monitor all your Event Hubs, both to confirm that they are performing as expected, and to ensure that you do not saturate your provisioned capacity.
Every throughput unit allows you 1,000 inbound messages, or 1 megabyte of incoming data, per second. If you exceed your provisioned capacity, incoming events will be throttled, events will be dropped, and an exception will be returned to the event publisher.
For most applications, you want to know if you are trending toward dropping data before it happens. Once you turn on the Datadog integration with Azure, you’ll be able to immediately monitor your consumed capacity and trigger an alert if you’re in danger of saturation.
Outbound data from Event Hubs is limited to 2 megabytes per second per throughput unit. And although outgoing messages are not subject to throttling exceptions, monitoring your outbound traffic can help you identify resource limitations that may be slowing down your consumer applications.
See your Event Hubs in context
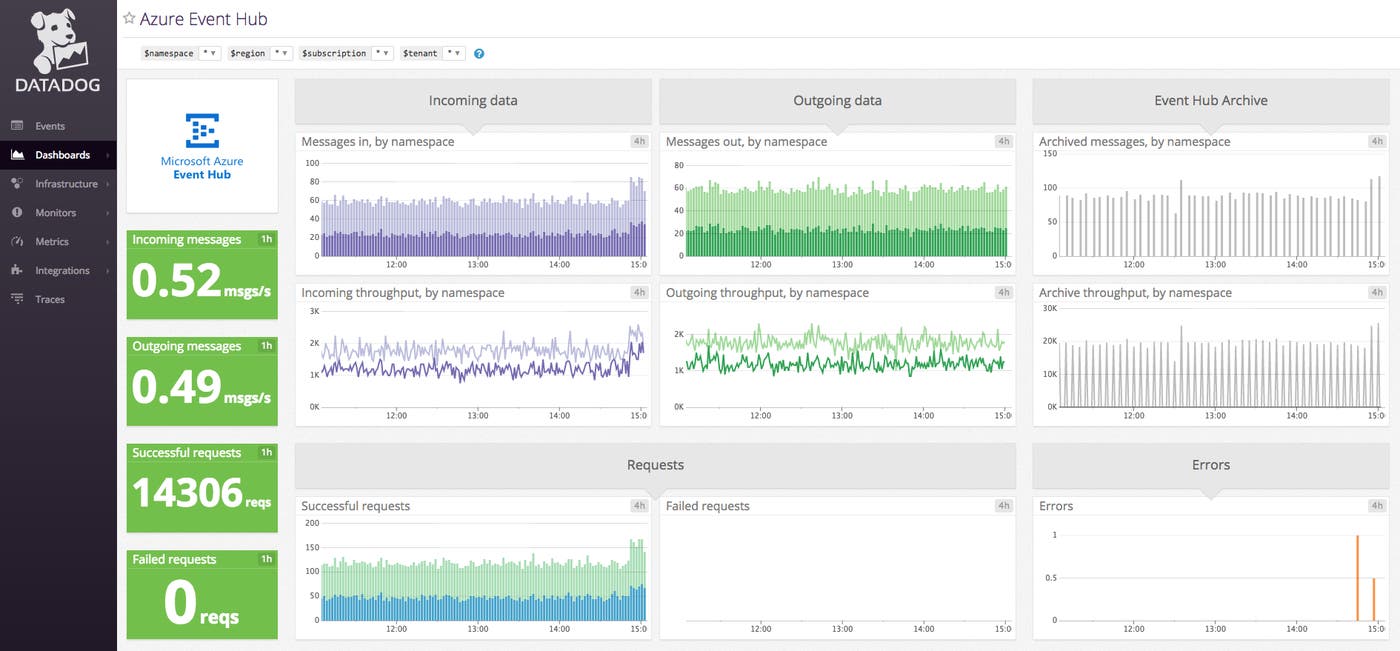
By connecting Datadog to Azure and enabling the integration with Event Hubs, you’ll immediately have access to a full suite of metrics from Event Hubs and other Azure services. You can track Event Hub throughput, as described above, and set alerts on internal server errors and other failures that can cause problems for your downstream applications.
To supplement your standard Azure metrics, you can choose from Datadog’s more than 1,000 built-in integrations with infrastructure technologies, including IIS, SQL Server, and other Microsoft products. Datadog also provides full support for custom metrics in multiple programming languages and frameworks, including C#.
Full Azure observability
Once metrics from your Event Hubs are flowing into Datadog, you have all of Datadog’s advanced monitoring functionality at your fingertips. From a flexible graphing interface and drag-and-drop dashboards to algorithmic alerting on outlier detection and anomaly detection, Datadog has the tools you need to monitor modern infrastructure.
If you don’t have a Datadog account and are ready to bring observability to your Azure infrastructure, sign up for a free trial account here.


