Emily Chang
This is the second post in a series about Datadog's latest feature enhancements. This post highlights recent improvements in alerting and algorithmic monitoring. The other installments in the series focus on data collection and new features for visualization and collaboration, respectively.
Alerting on critical issues is a central component of any effective monitoring strategy. At a minimum, alerts should help you identify key issues with performance and availability, but ideally, they should also be actionable, clear, and customizable. With these goals in mind, we have developed several new features to help you create smarter, more effective alerts. In this post we'll cover a few highlights:
Anomaly detection
Metrics that exhibit natural fluctuations or changing baselines over time are often hard to monitor with threshold-based alerts. So we added anomaly detection to Datadog, which enables you to trigger an alert on abnormal changes in a metric's value, while accounting for that metric's recent trends or recurring patterns.
Anomaly detection is especially powerful for user-driven metrics, like web server requests per second or application logins, which typically exhibit large-amplitude fluctuations depending on the time of day or the day of the week.
Consult this guide for more details on how to add anomaly detection to your dashboards and alerts.
APM service monitors
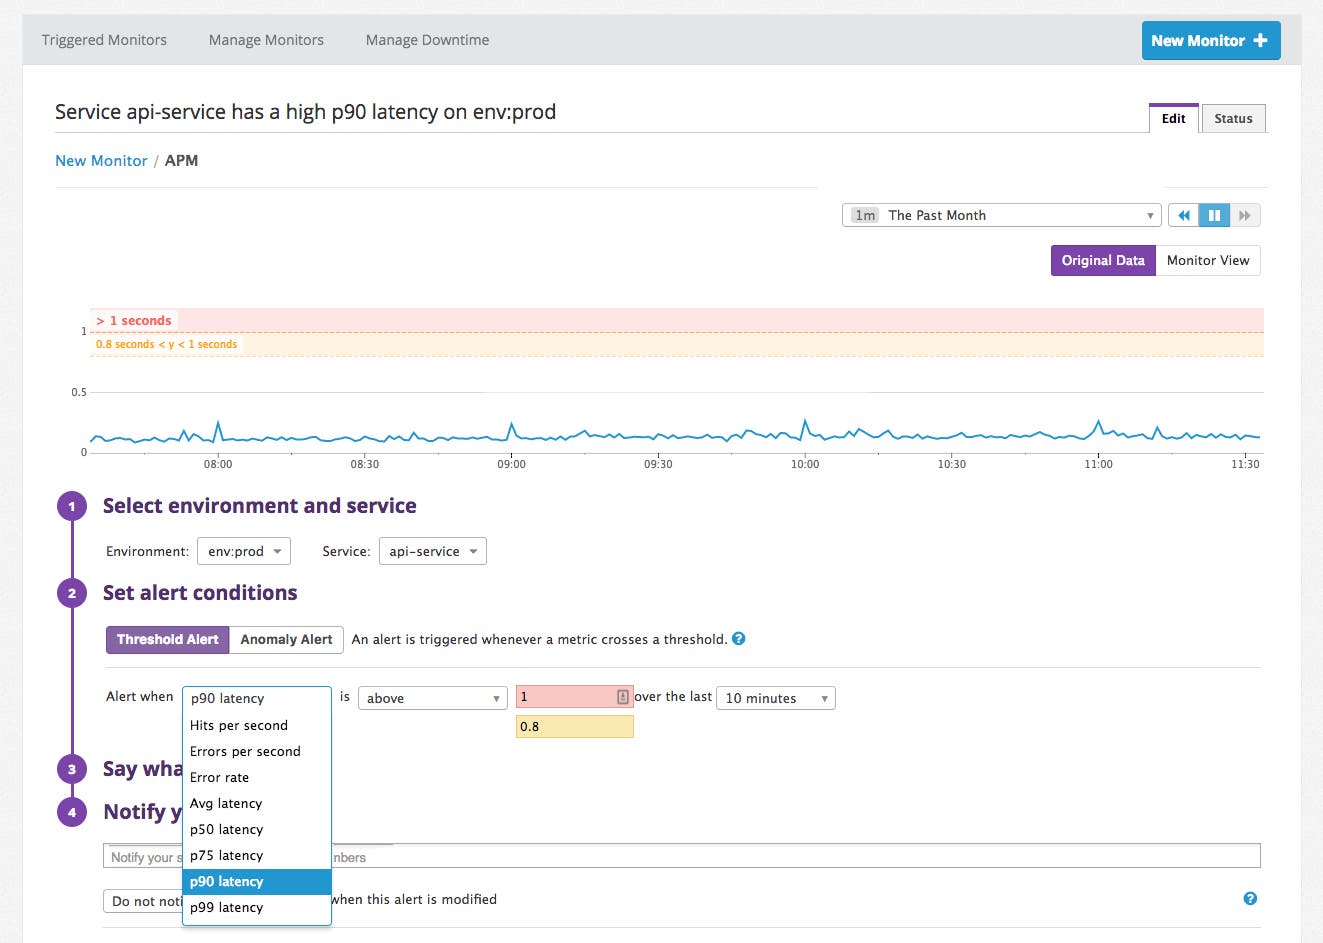
If you're using Datadog APM, you can create service-level monitors to tie your alerts directly to the health of specific services that support your applications. These monitors are designed to help you automatically track targeted performance indicators from each of your services:
latency (average, 50th/75th/90th/99th percentile)
error rate (errors per second, or error-per-hit ratio)
throughput
You can set up service-level monitors to notify you when these performance indicators cross fixed thresholds, or use anomaly detection to find out whenever a service's performance deviates from its expected range.

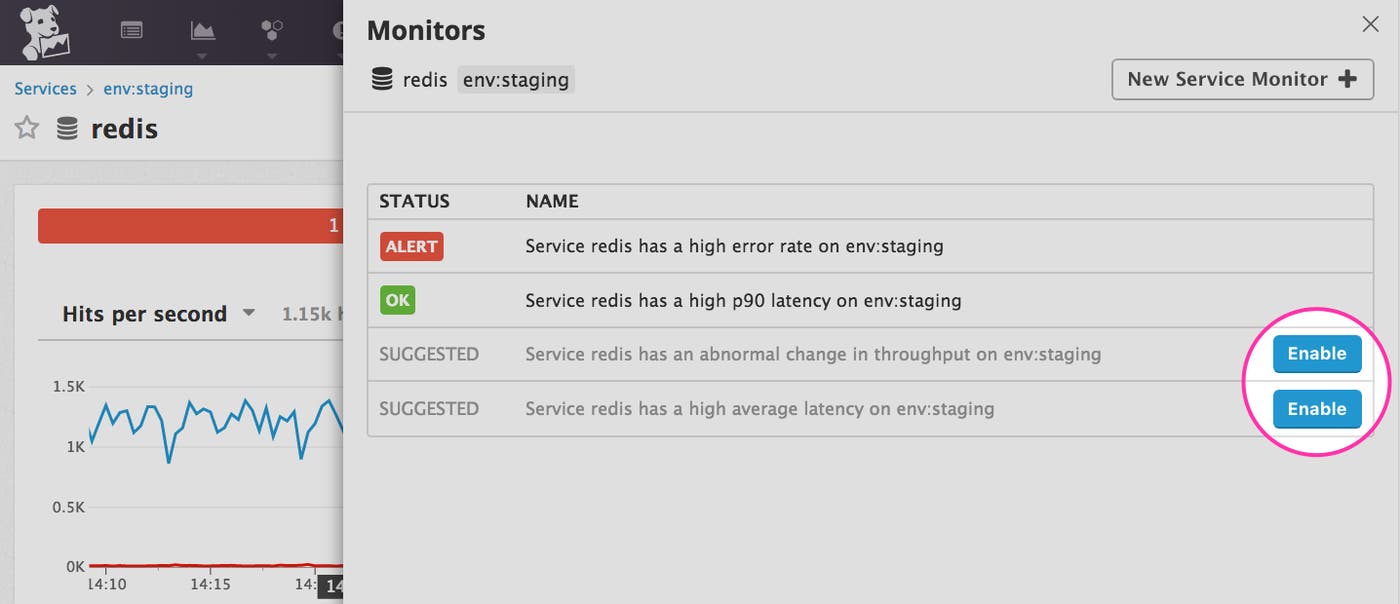
These monitors are designed to help you maintain a clear focus on service-level performance, even if the underlying infrastructure is dynamic or ephemeral. You can get started quickly by enabling suggested service monitors that automatically detect issues with latency, throughput, or error rate.

Composite monitors
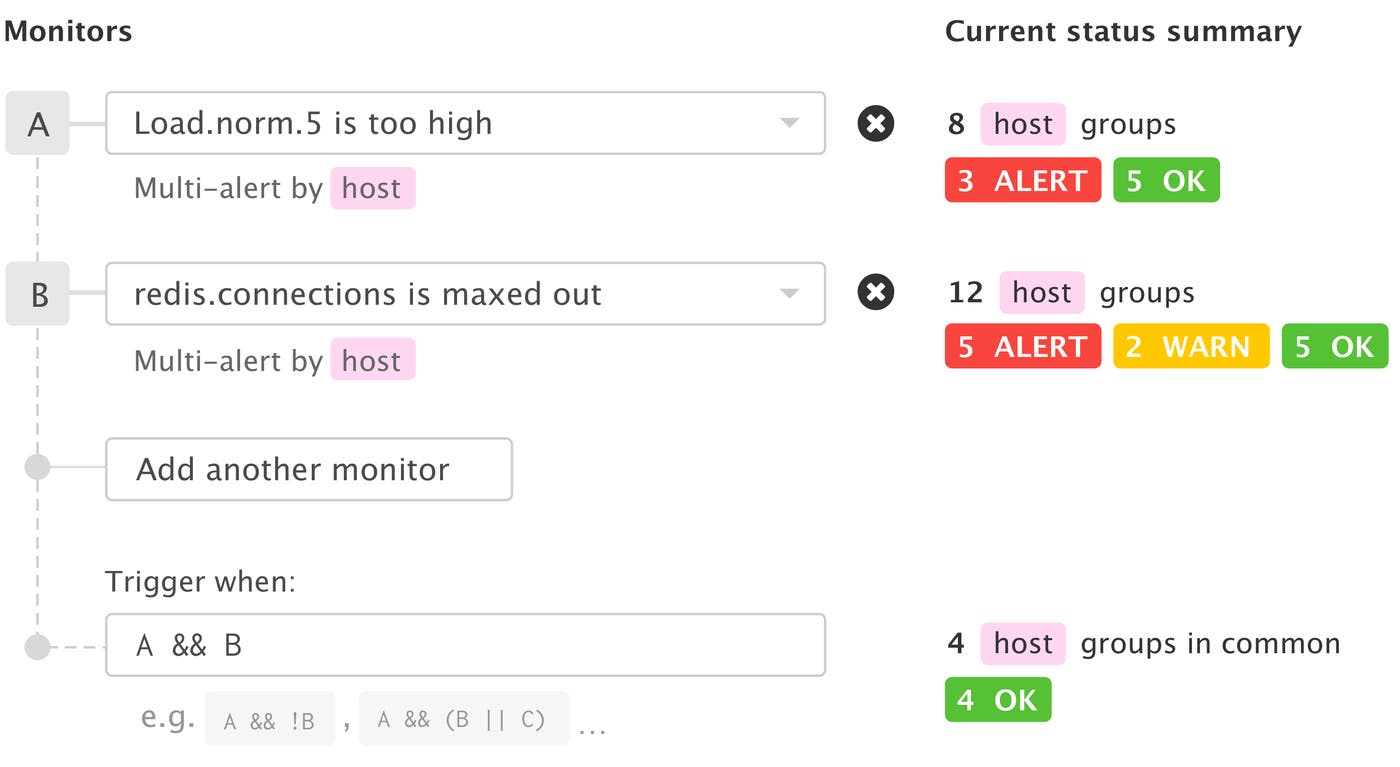
Many performance problems or failure modes are identified not by a single indicator, but by a combination of factors. Now, you can create alerts that capture this complexity by using composite monitors, which trigger based on the presence or absence of multiple indicators.

You can chain up to 10 different alerting conditions using logical operators (&&, ||, !) to fine-tune your alert definitions. You can even add nested logic using parentheses. With composite monitors, you will be able to create very targeted alerts that reduce noise, while still ensuring that you get notified immediately of pressing problems.
Zippy faceted monitor search
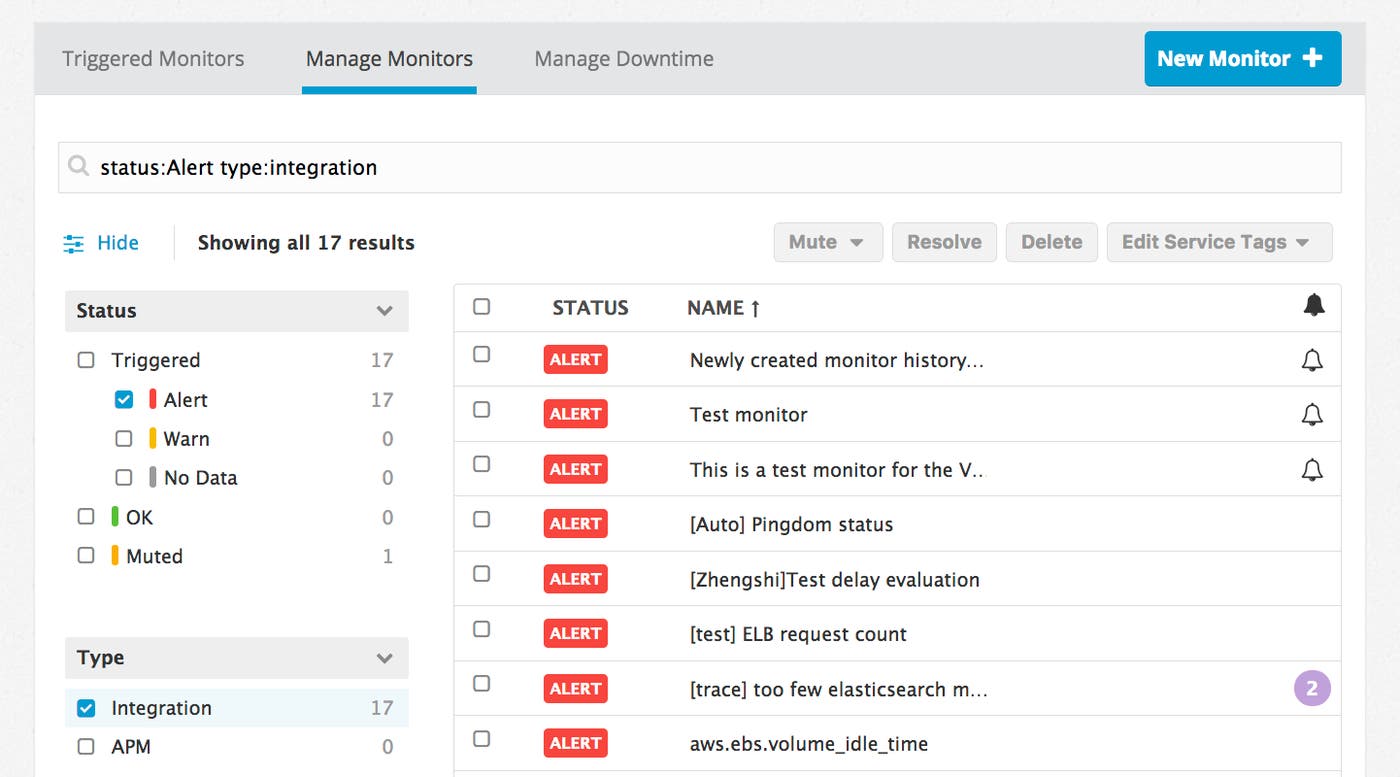
The Manage Monitors page provides a valuable window into the state of your infrastructure—particularly when you are paged about an issue and need to define the scope of the problem quickly. We recently rolled out a new Manage Monitors UI that makes it easier for users to quickly find relevant monitors to discern which parts of their infrastructure are experiencing issues.

The new user interface enables you to search or filter your monitors faster than ever before, by specifying tags, free text, and meaningful attributes like service name and alert status. Navigate to your Manage Monitors page to try it out.
Visualize the future
If you're using Datadog already, you have access to all these features today. Otherwise, you can start setting up sophisticated alerts in your own environment with a free trial.
Read on for more recent additions to the Datadog platform. In the next article in this series, we'll explore some of our newest enhancements around collaboration and visualization of data.

