At DASH, we shared how Datadog is helping teams monitor, optimize, and secure their services. This roundup highlights new features that deliver comprehensive analysis and automatically surface actionable insights to resolve performance issues and system anomalies.
We’ve launched RUM Recommendations to pinpoint user friction, Automated Analysis to interpret profiling data in real time, and one-click recommendations for significantly improving test reliability in CI pipelines. We’ve also made it easier than ever to manage costs for your Datadog services, in addition to your infrastructure.
Learn how these updates—plus new capabilities for Product Analytics, the Software Catalog, and more—enable teams to detect and resolve issues faster. Then, check out our keynote roundup for other major announcements, including:
Diagnose and resolve problems with automated insights
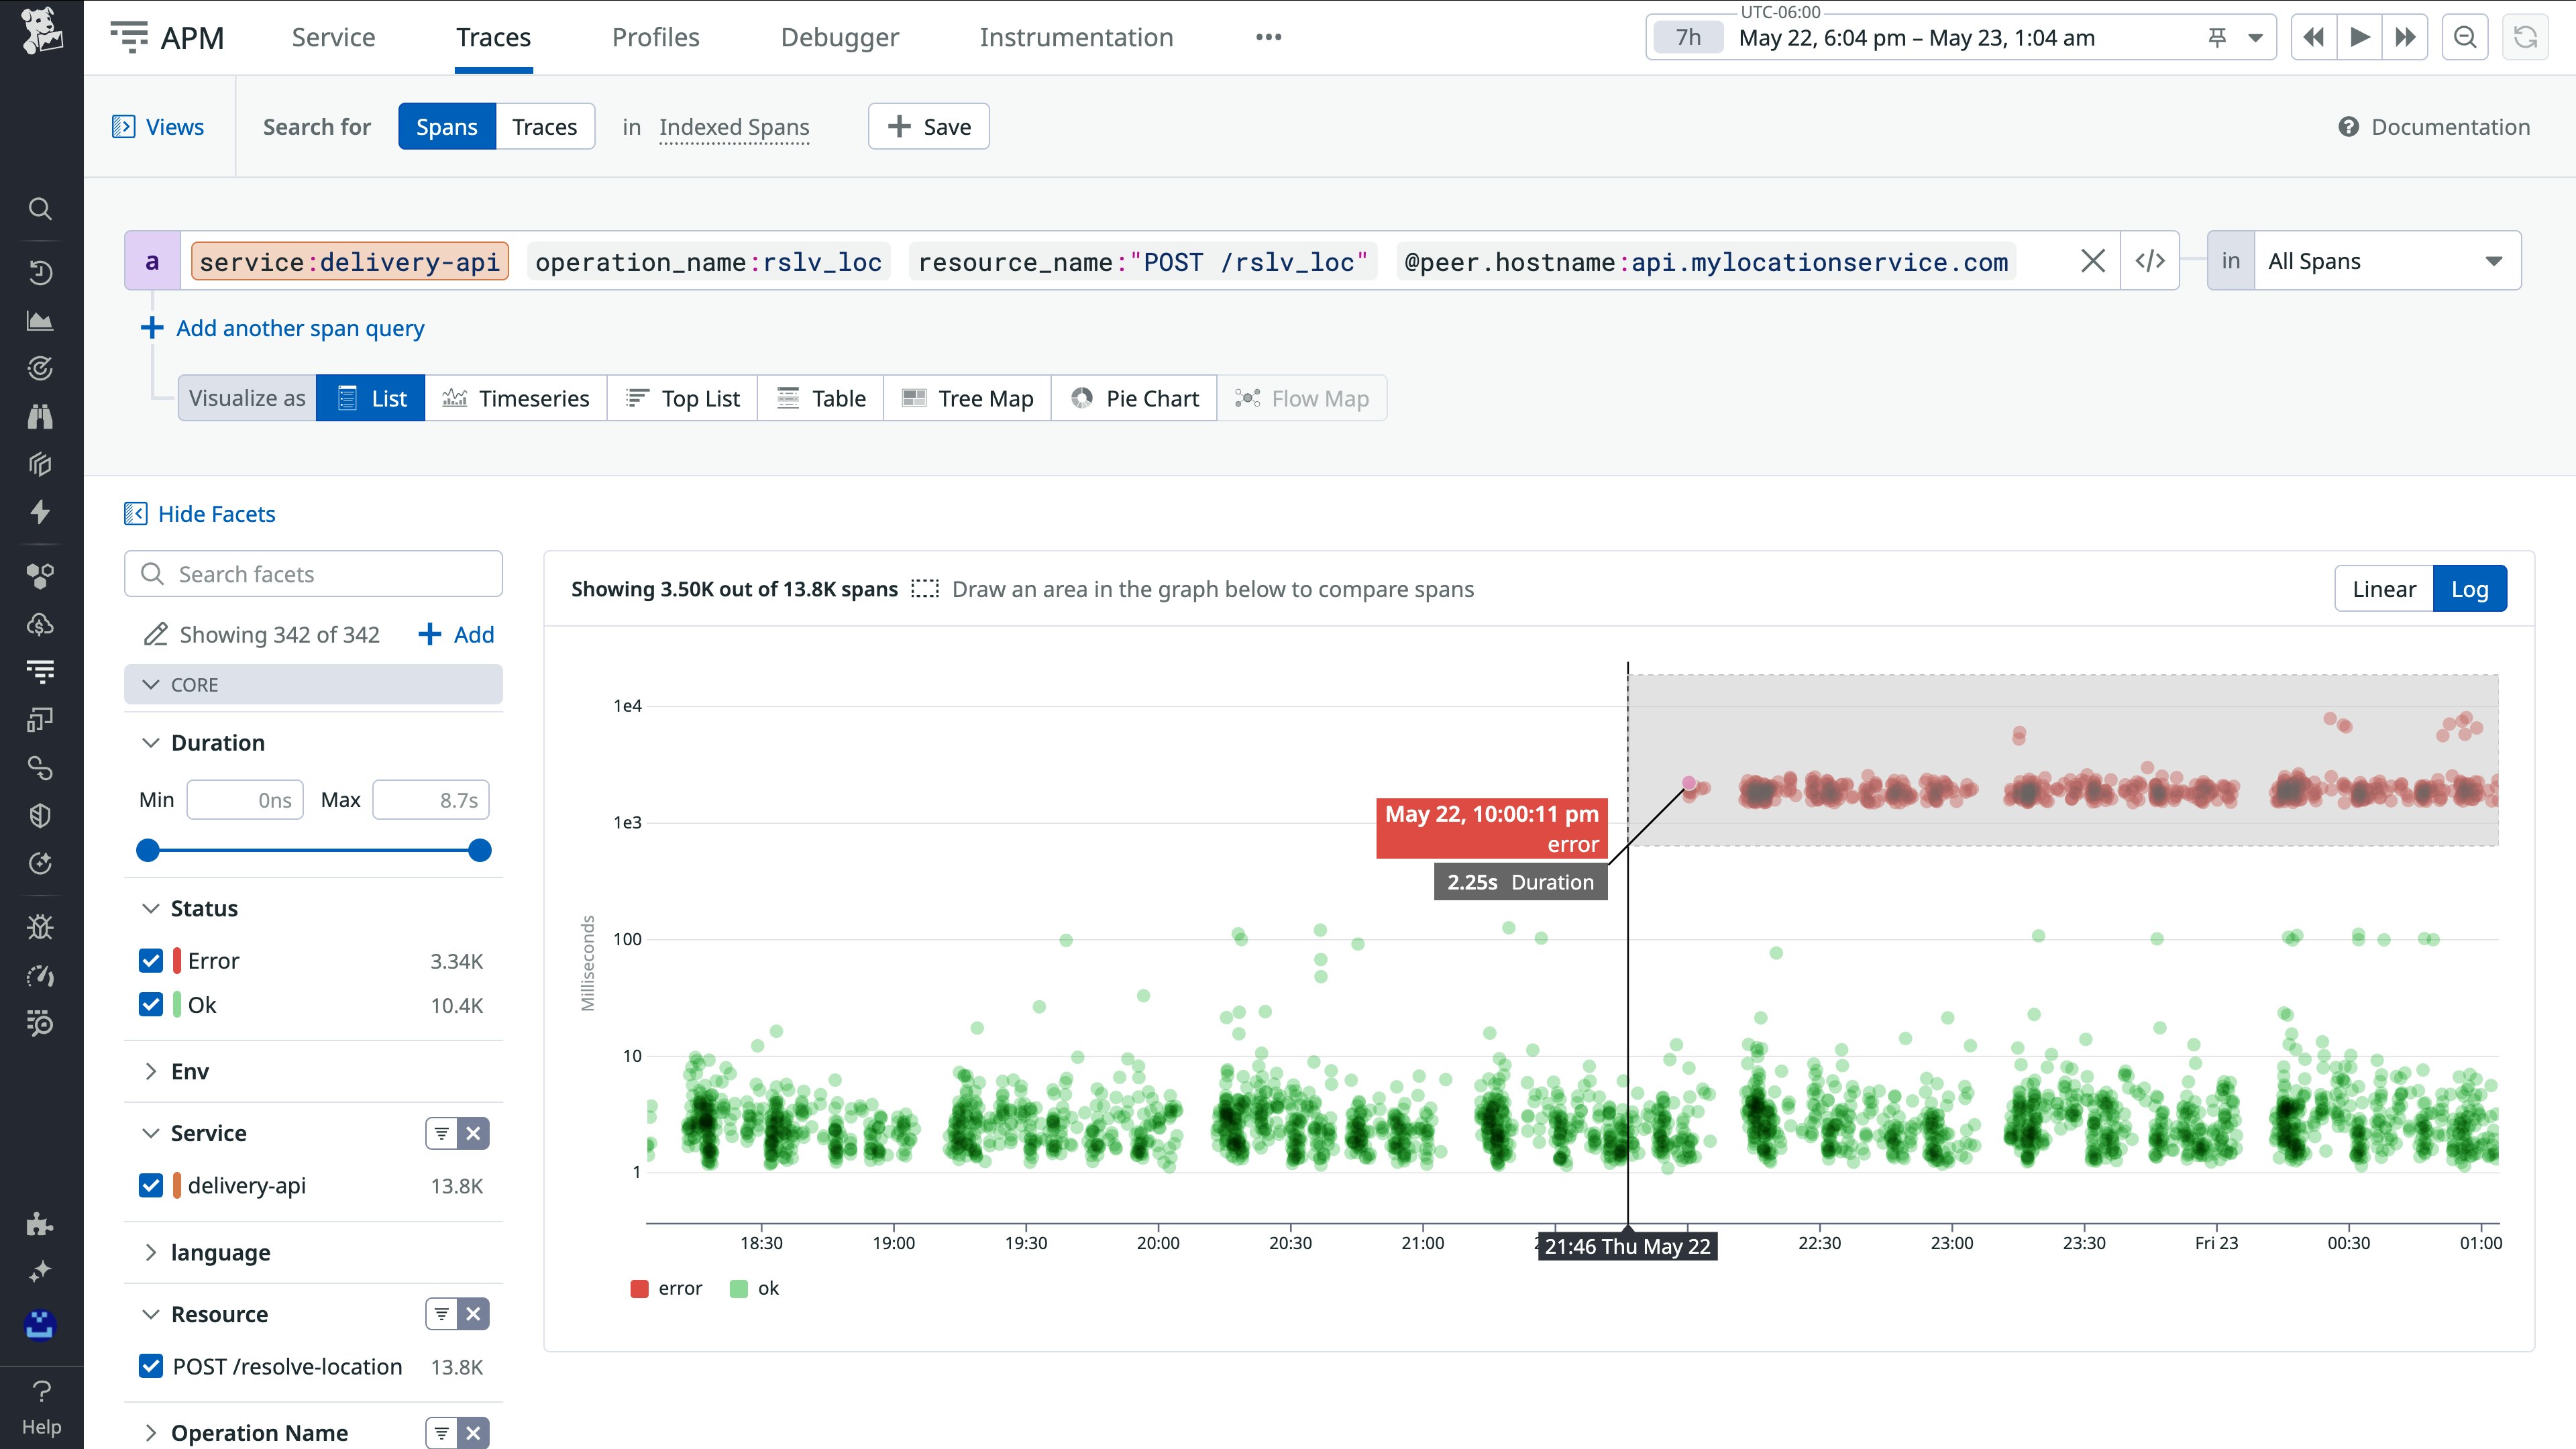
Identify what’s driving errors and latency with Tag Analysis
When application performance degrades, identifying the root cause often means embarking on the tedious, time-consuming process of guessing which tags might be relevant and grouping traces manually. Datadog Tag Analysis removes this friction by automatically identifying the tags that are most strongly correlated with latency spikes or errors. It generates a ranked list of statistically significant attributes, showing how each tag’s values differ between affected spans and baseline performance. These insights help you quickly understand what distinguishes anomalous behavior, such as a slowdown tied to a new service version or issues concentrated in a specific region. Instead of relying on intuition or cycling through tag combinations manually, you get a clear, data-driven view into what’s driving the problem so you can investigate with focus and resolve issues faster. Learn more in our blog post.
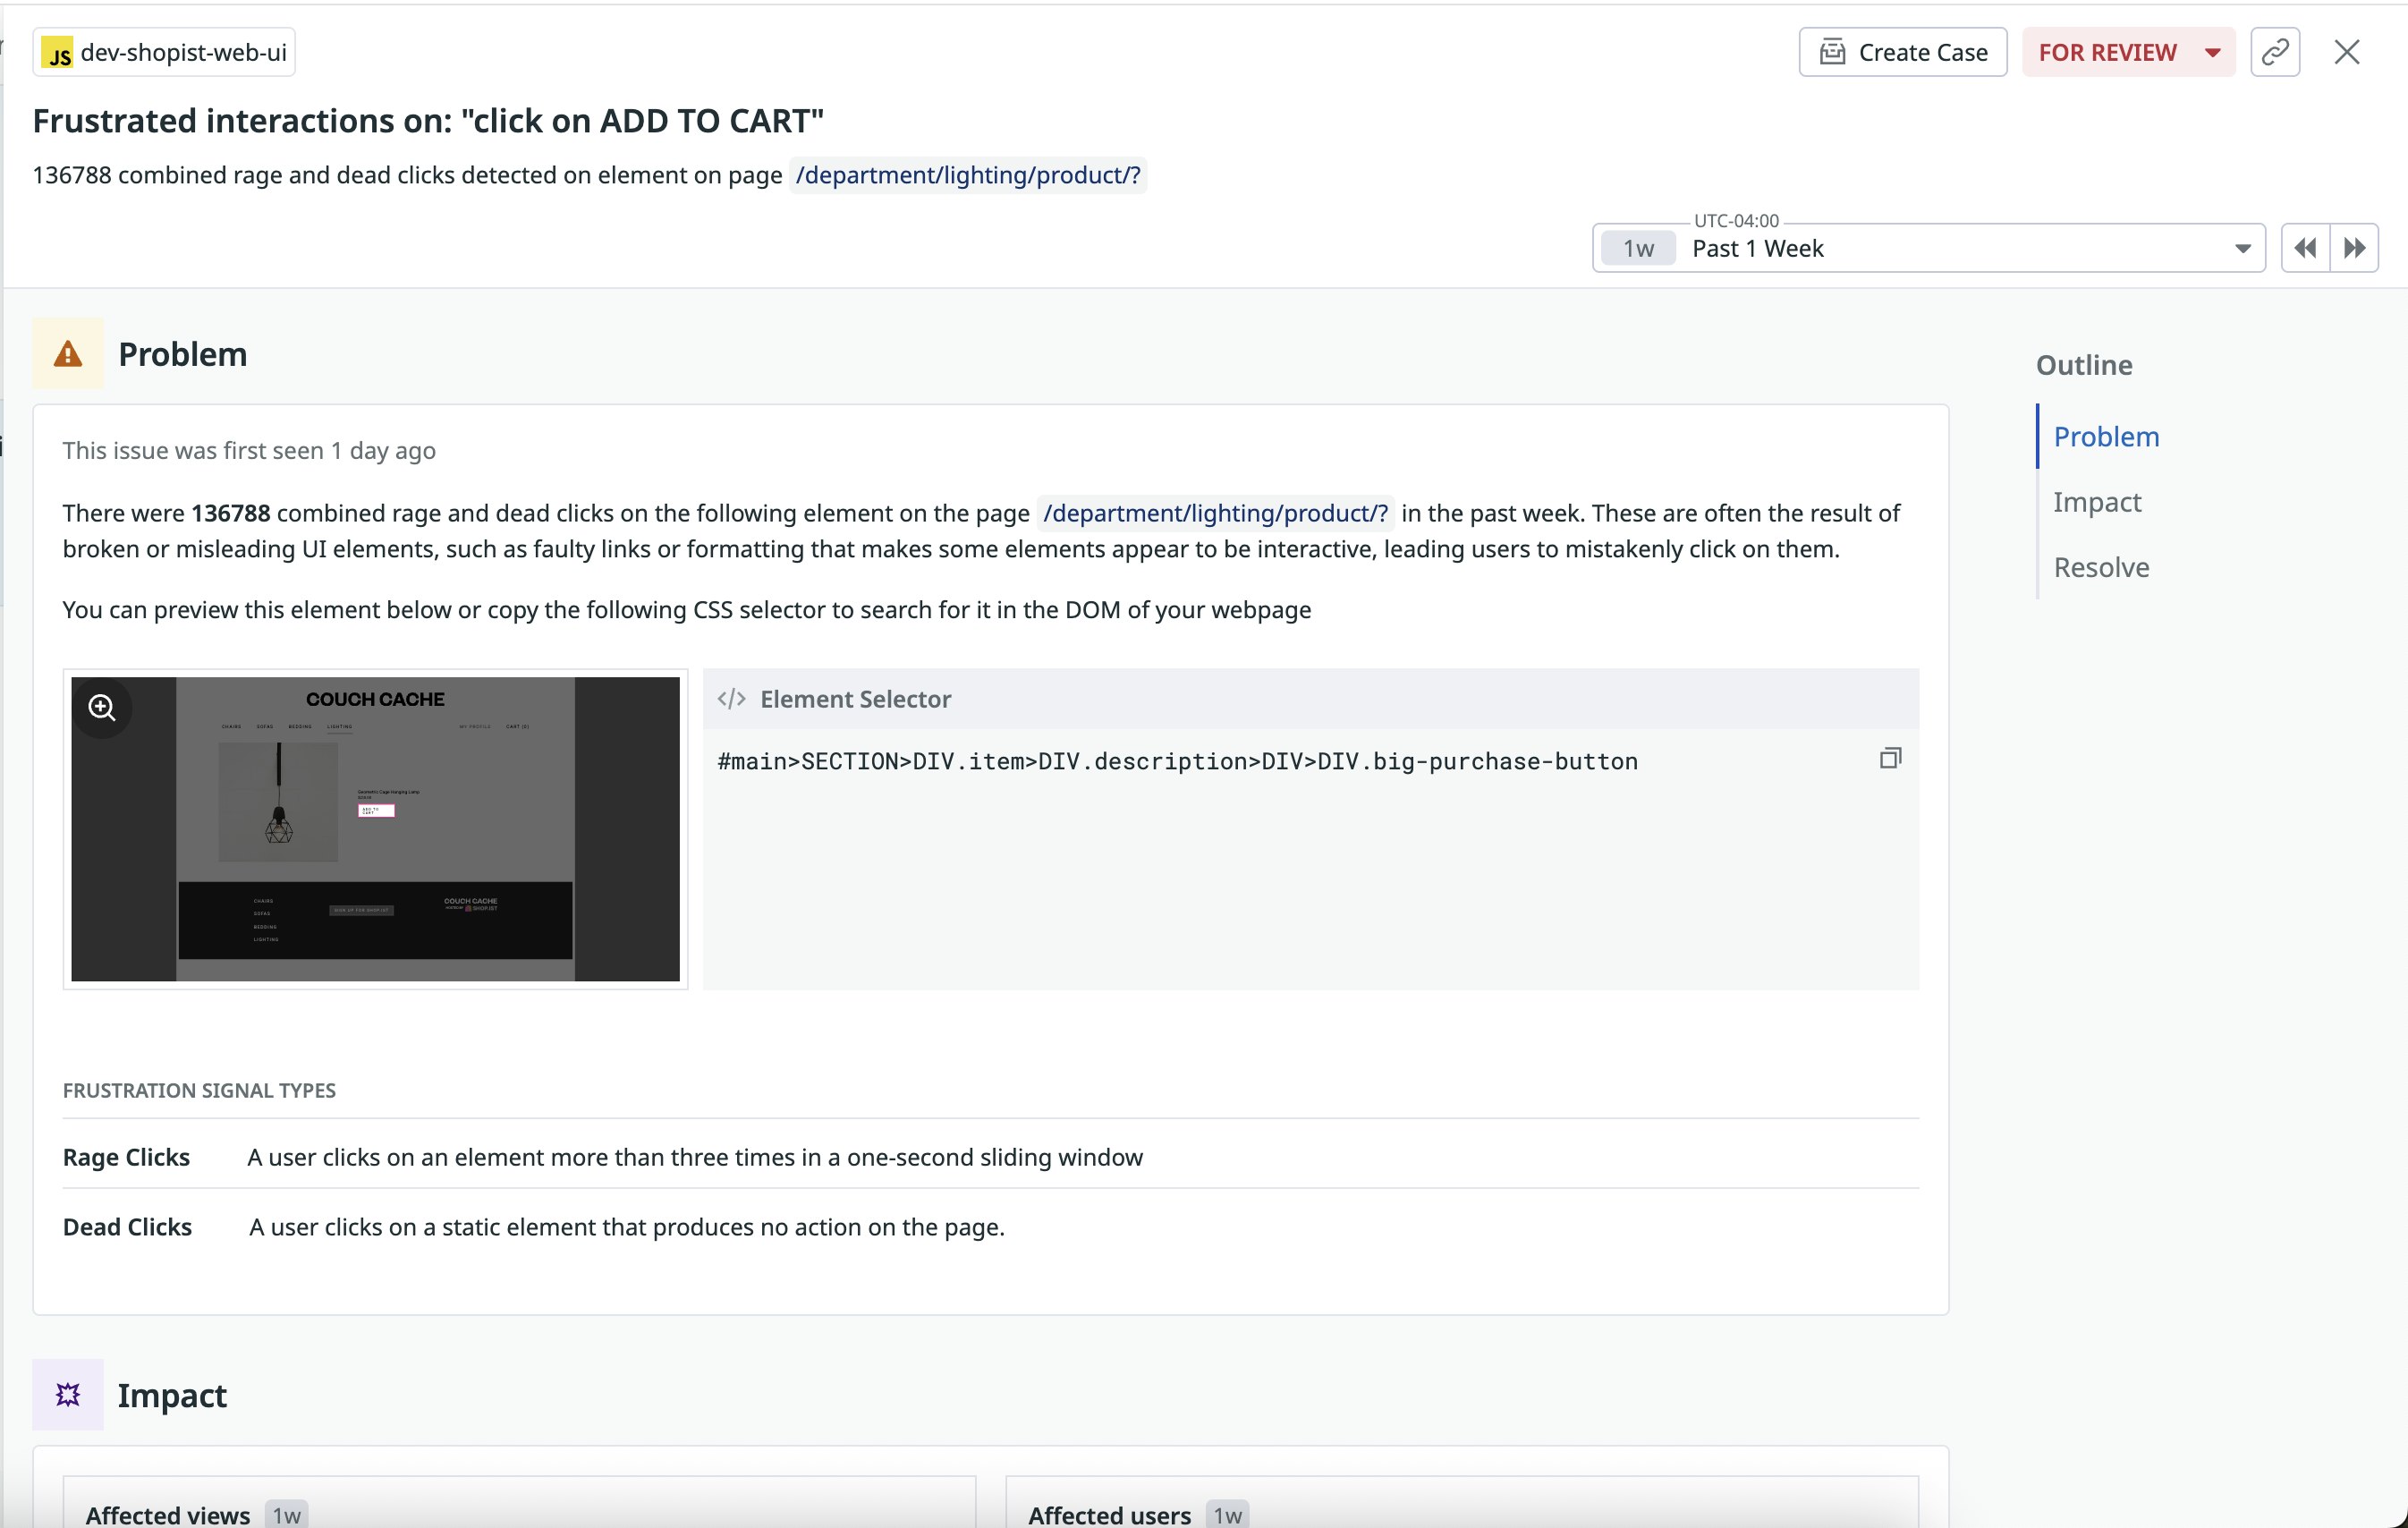
Improve frontend performance by identifying and resolving user-impacting issues with Datadog RUM Recommendations
Delivering fast, reliable frontend experiences starts with knowing where problems are and so where to focus optimization efforts. Datadog RUM Recommendations helps teams proactively detect and resolve performance and usability issues by analyzing each view of your application and surfacing signs of user friction, such as slow load times or frustration clicks.
Datadog prioritizes recommendations by user impact and includes suggested code changes, enabling teams to address the most pressing issues quickly and effectively.
RUM Recommendations is now in Preview. Sign up for the Preview or learn more in our documentation.
Get actionable insights into continuous profiling data with Automated Analysis
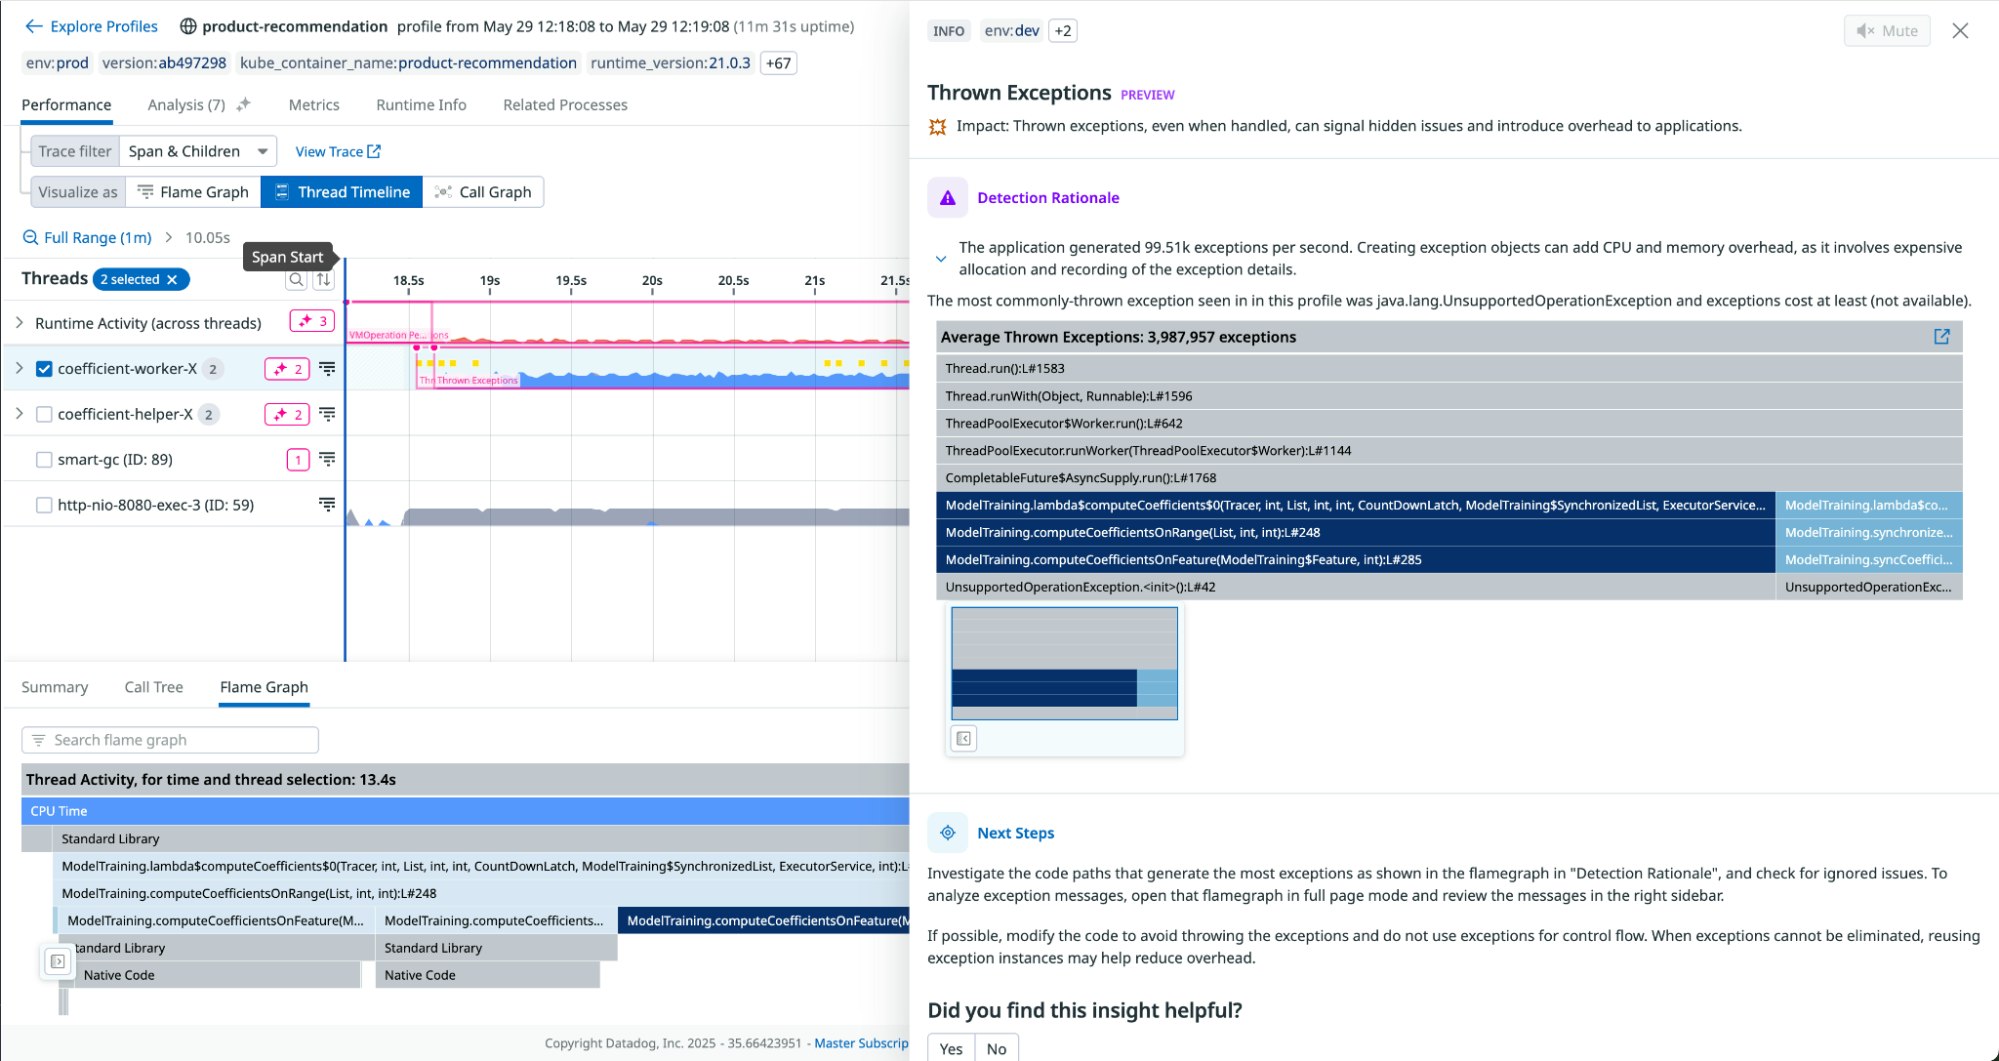
Powered by Continuous Profiler, Automated Analysis continuously monitors your applications and surfaces critical issues in real time along with actionable insights to guide resolution, helping teams detect and troubleshoot problems faster without requiring deep expertise in code profiling.
When Datadog identifies a problem, Automated Analysis provides a clear summary of the issue, explains why it matters, and highlights relevant profiling data such as the affected methods, packages, or processes. It also recommends next steps to help your team take action immediately. By connecting low-level performance data to clear, developer-friendly guidance, Automated Analysis makes it easier to improve service health and reduce time to resolution. Request access to the Preview here, or see our documentation for more information.
Detect and investigate query regressions with Datadog Database Monitoring
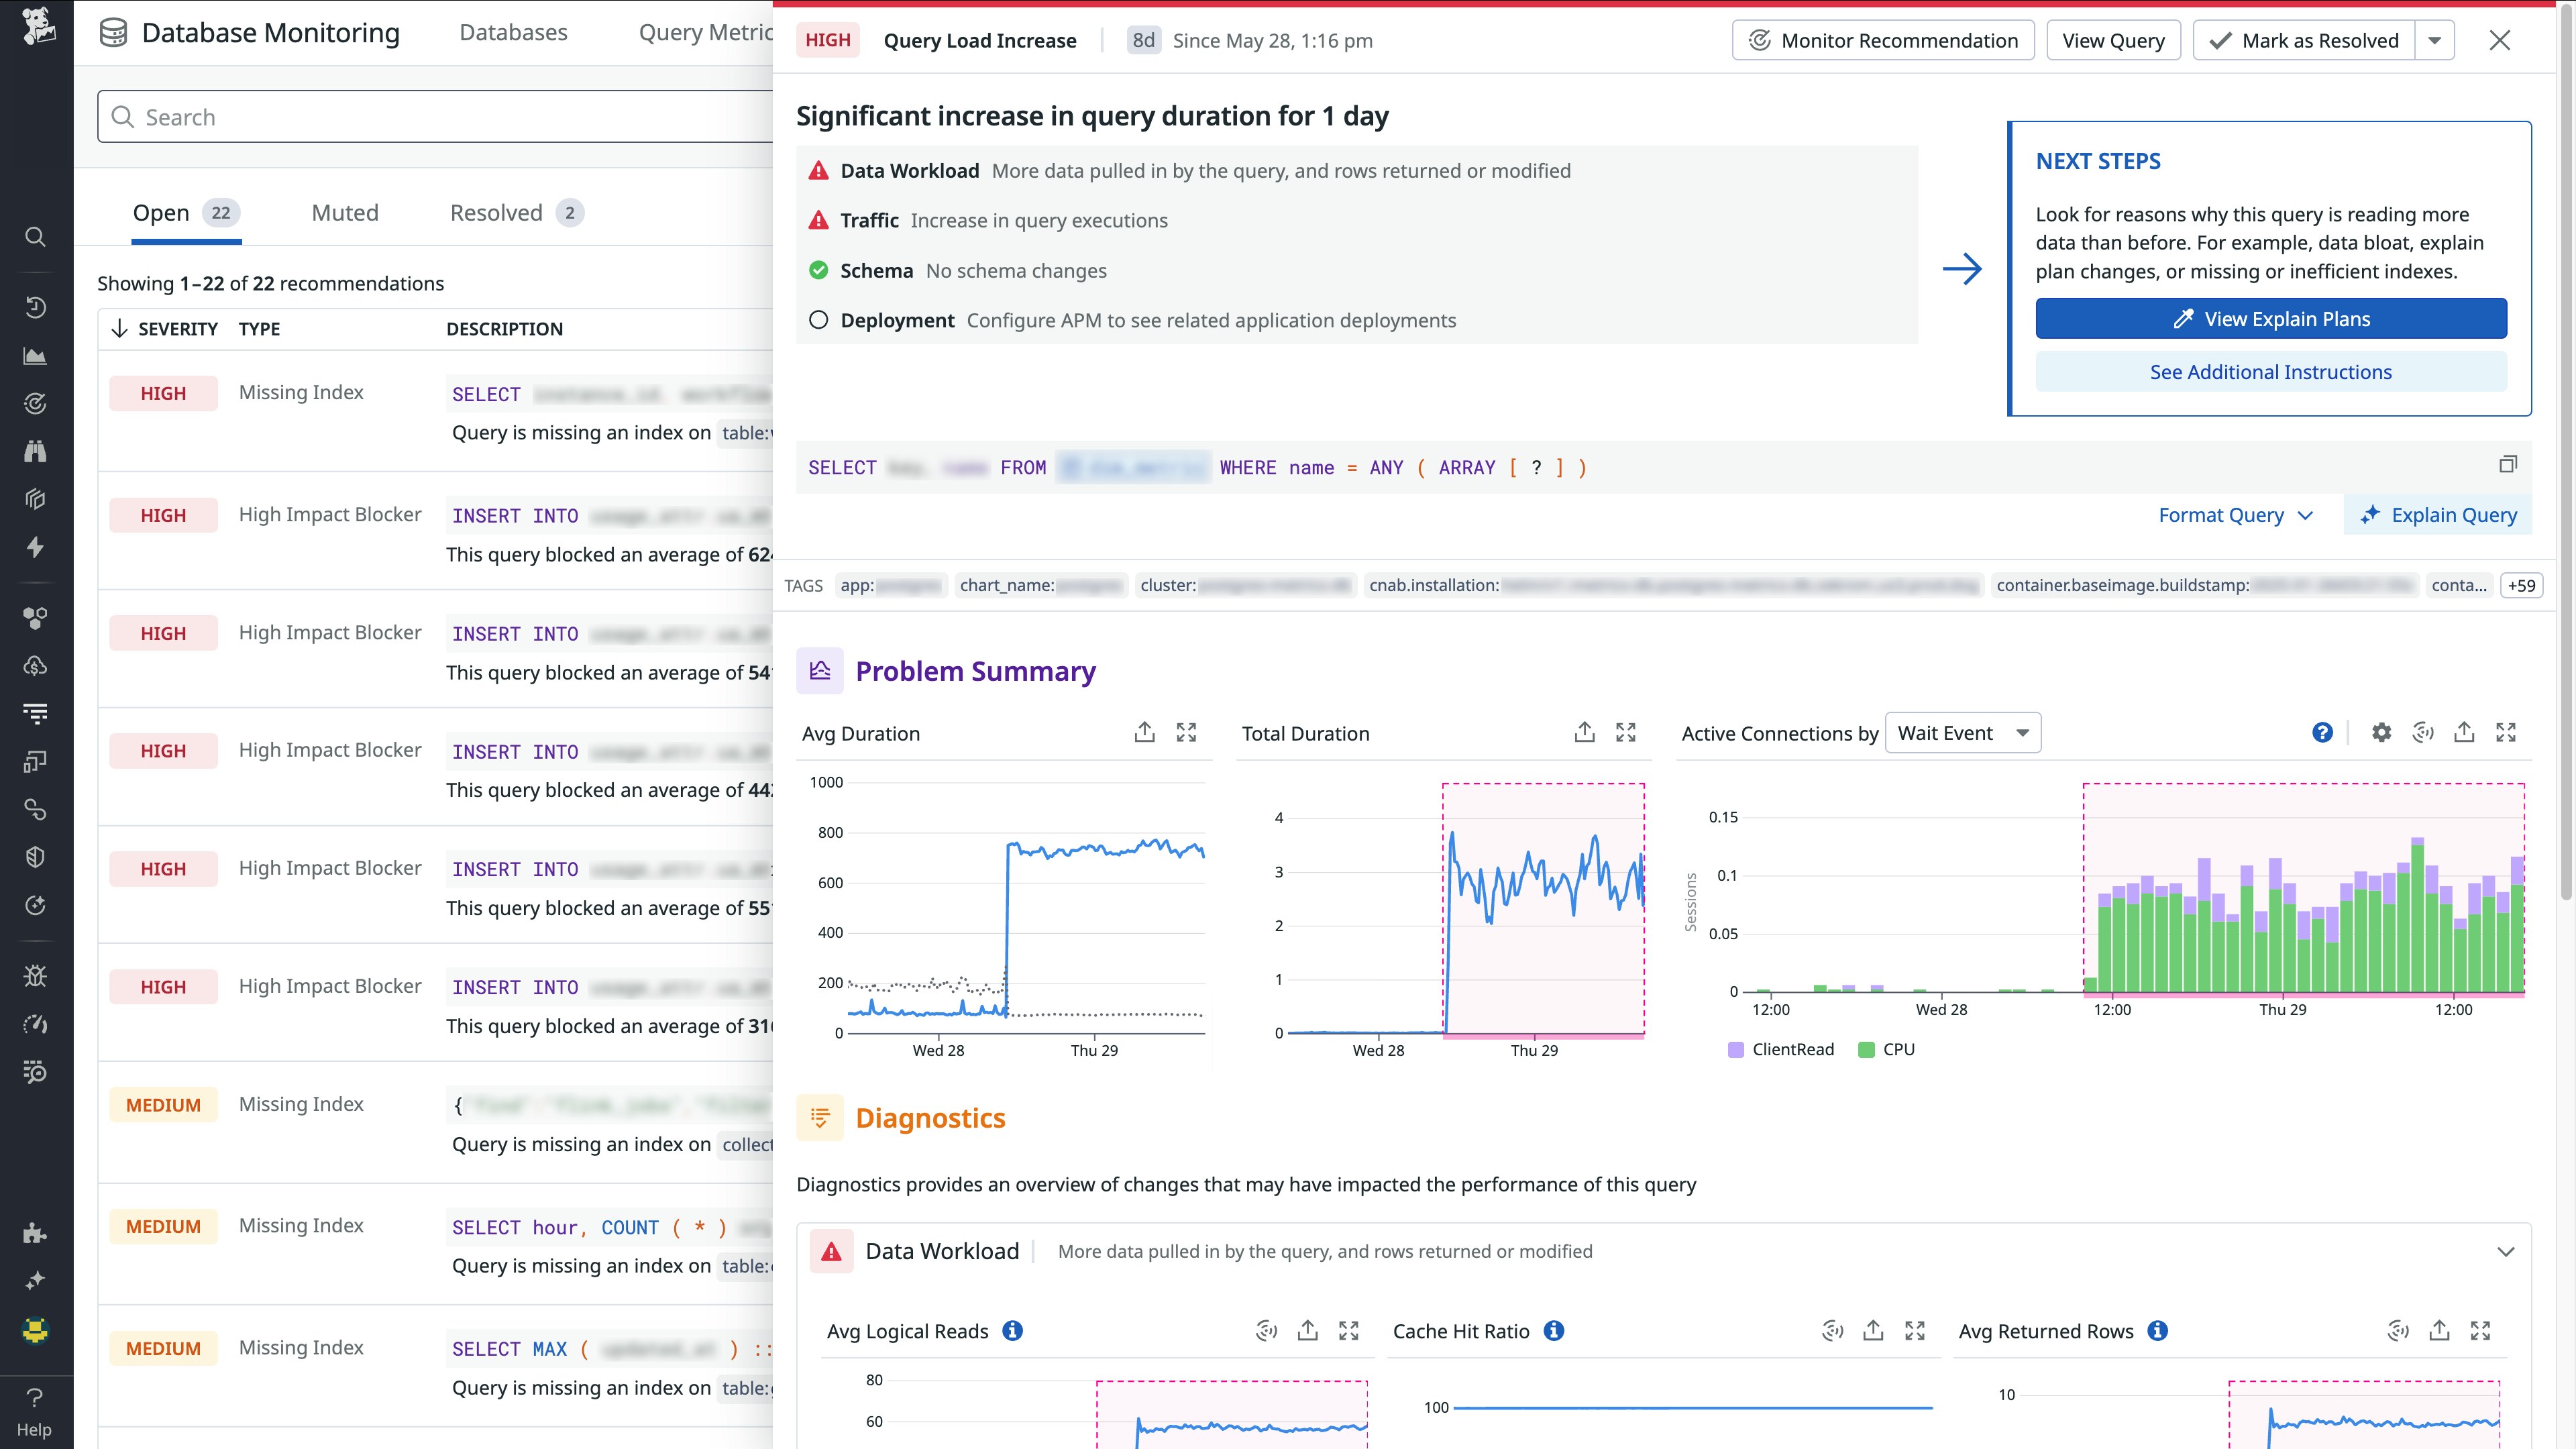
Query regressions, also known as unintended increases in query duration, can lead to delayed page loads, stalled analytics workloads, and system outages. Datadog Database Monitoring (DBM) now helps your teams proactively detect query regressions as they happen. By establishing historical baselines and using anomaly detection, Datadog DBM identifies performance regressions in your most commonly used queries and automatically runs through a set of diagnostics to help you quickly identify and resolve your issues. To learn more, check out our blog post.
Better navigate alert storms with Topological Correlation
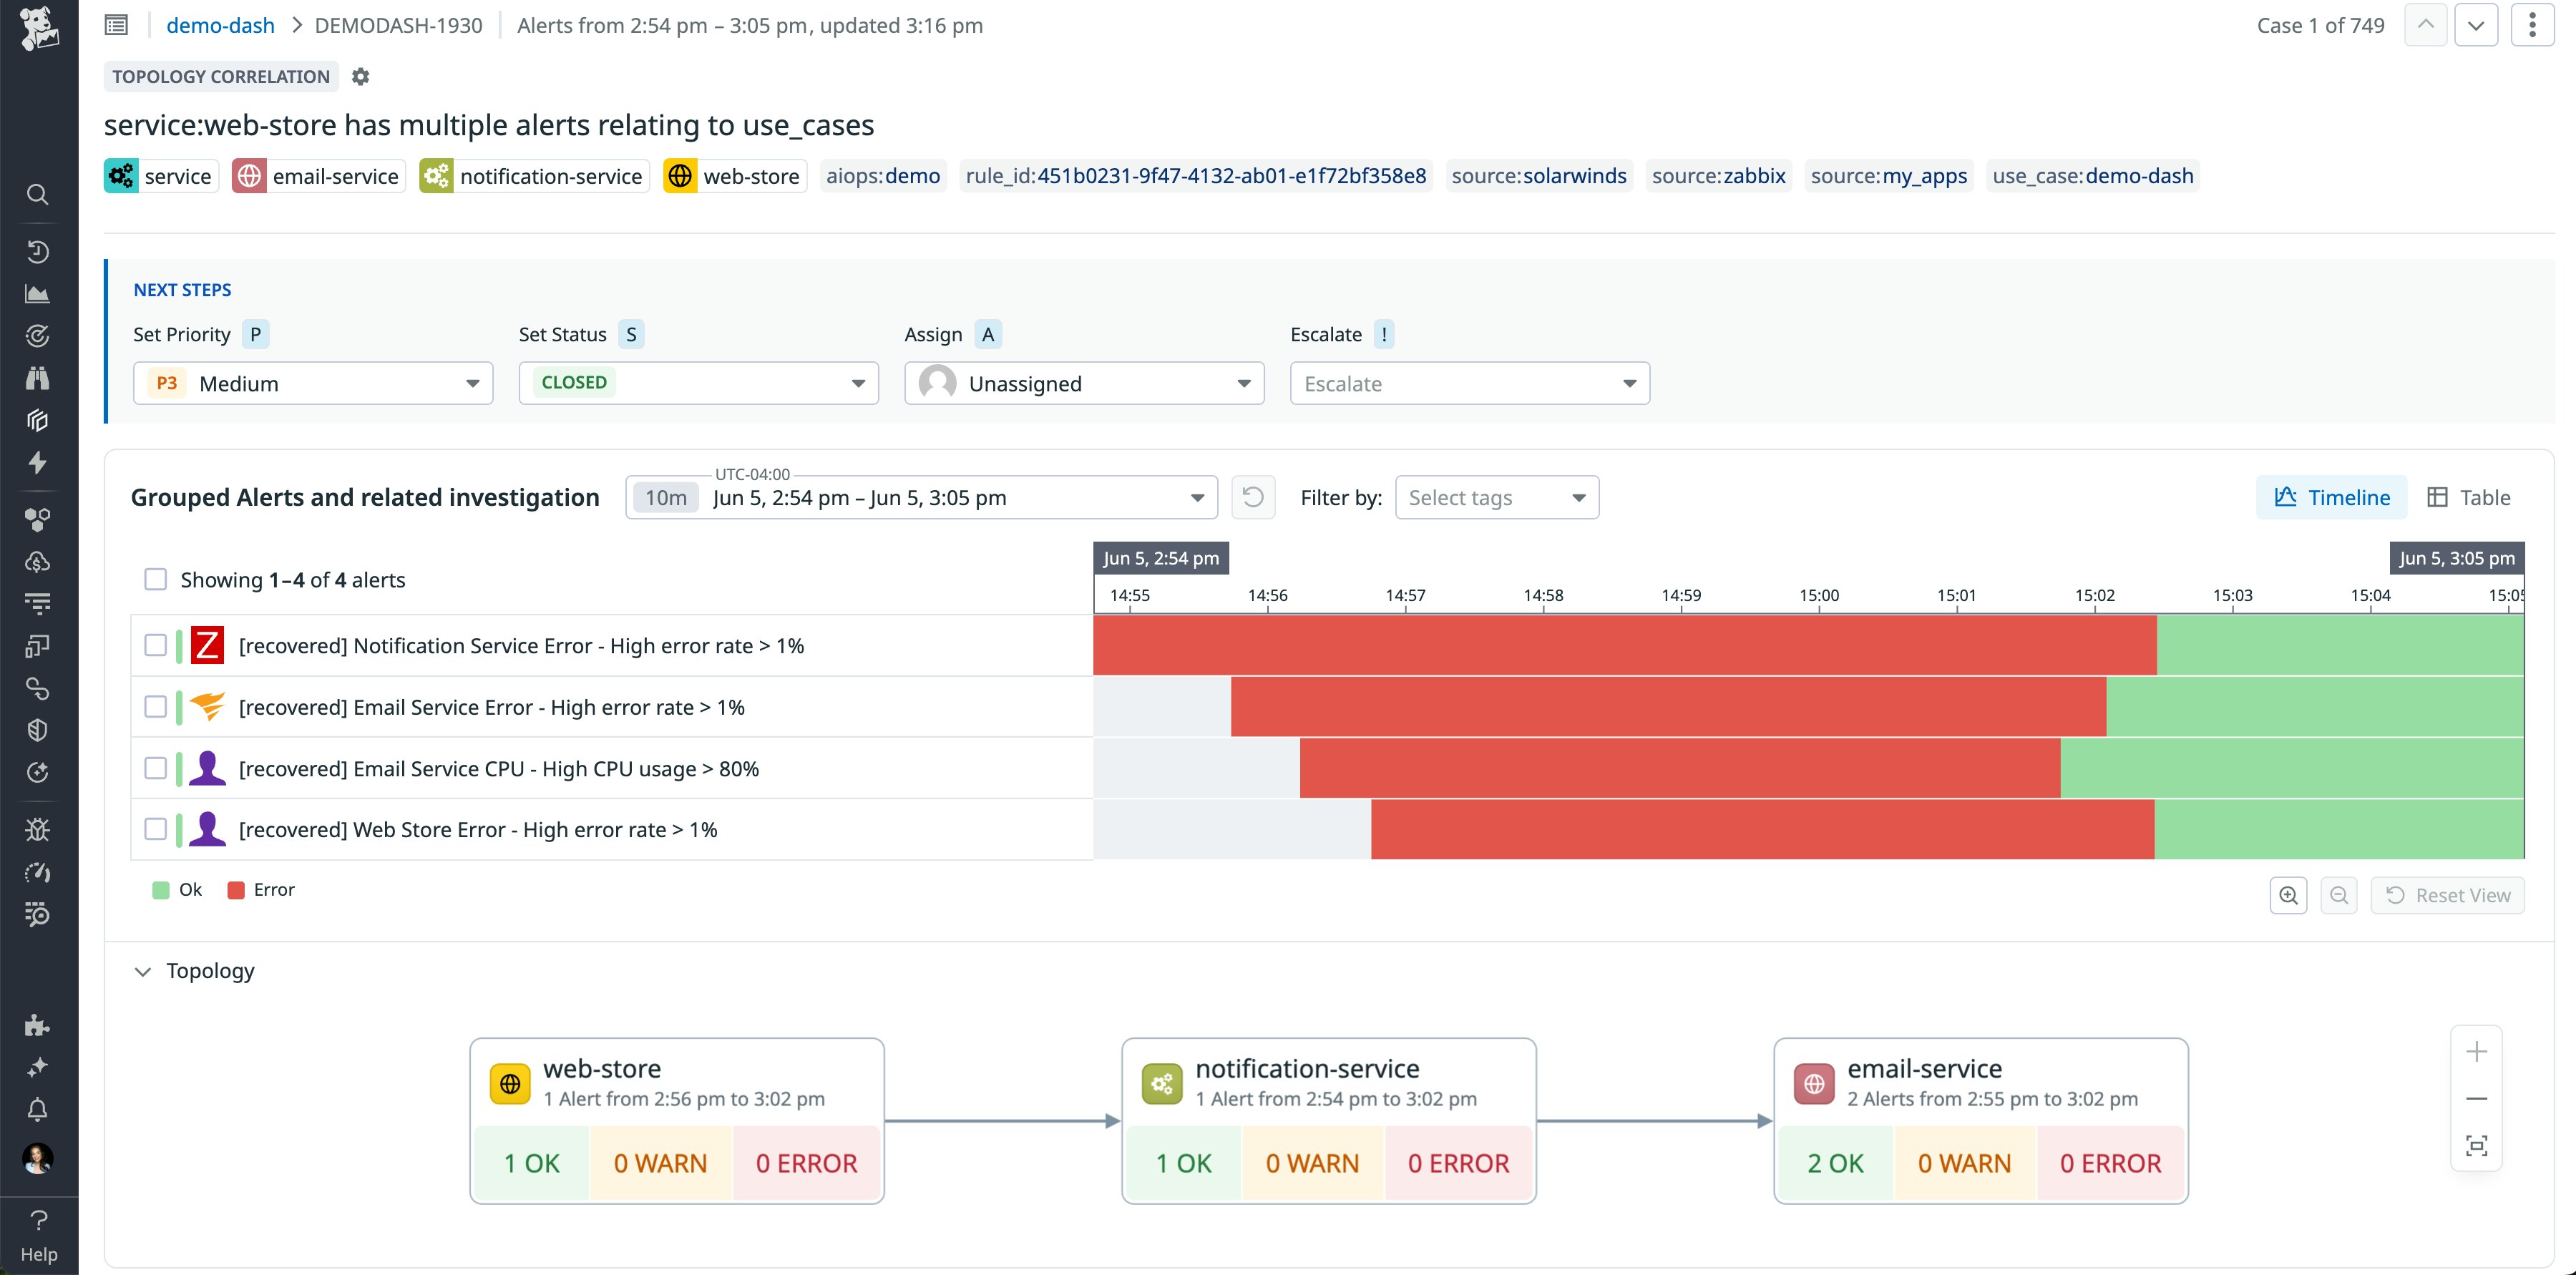
Alert storms can quickly overwhelm operations and development teams, especially when alerts are triggered across many related system assets. Now, teams can better navigate complex alert storms by using Topological Correlation in Datadog Event Management. By using imported system relationships, Topological Correlation intelligently groups alerts from dependent applications or infrastructure—for example, a cascade of application errors caused by a single server outage—into a consolidated case. This unified approach to triage reduces alert fatigue and accelerates incident resolution by orienting the team with a single work item that captures the complete breadth of the issue at hand. Topological Correlation is now available in Preview; you can contact your Customer Success representative to get started.
Make data-driven UX design decisions with Product Analytics
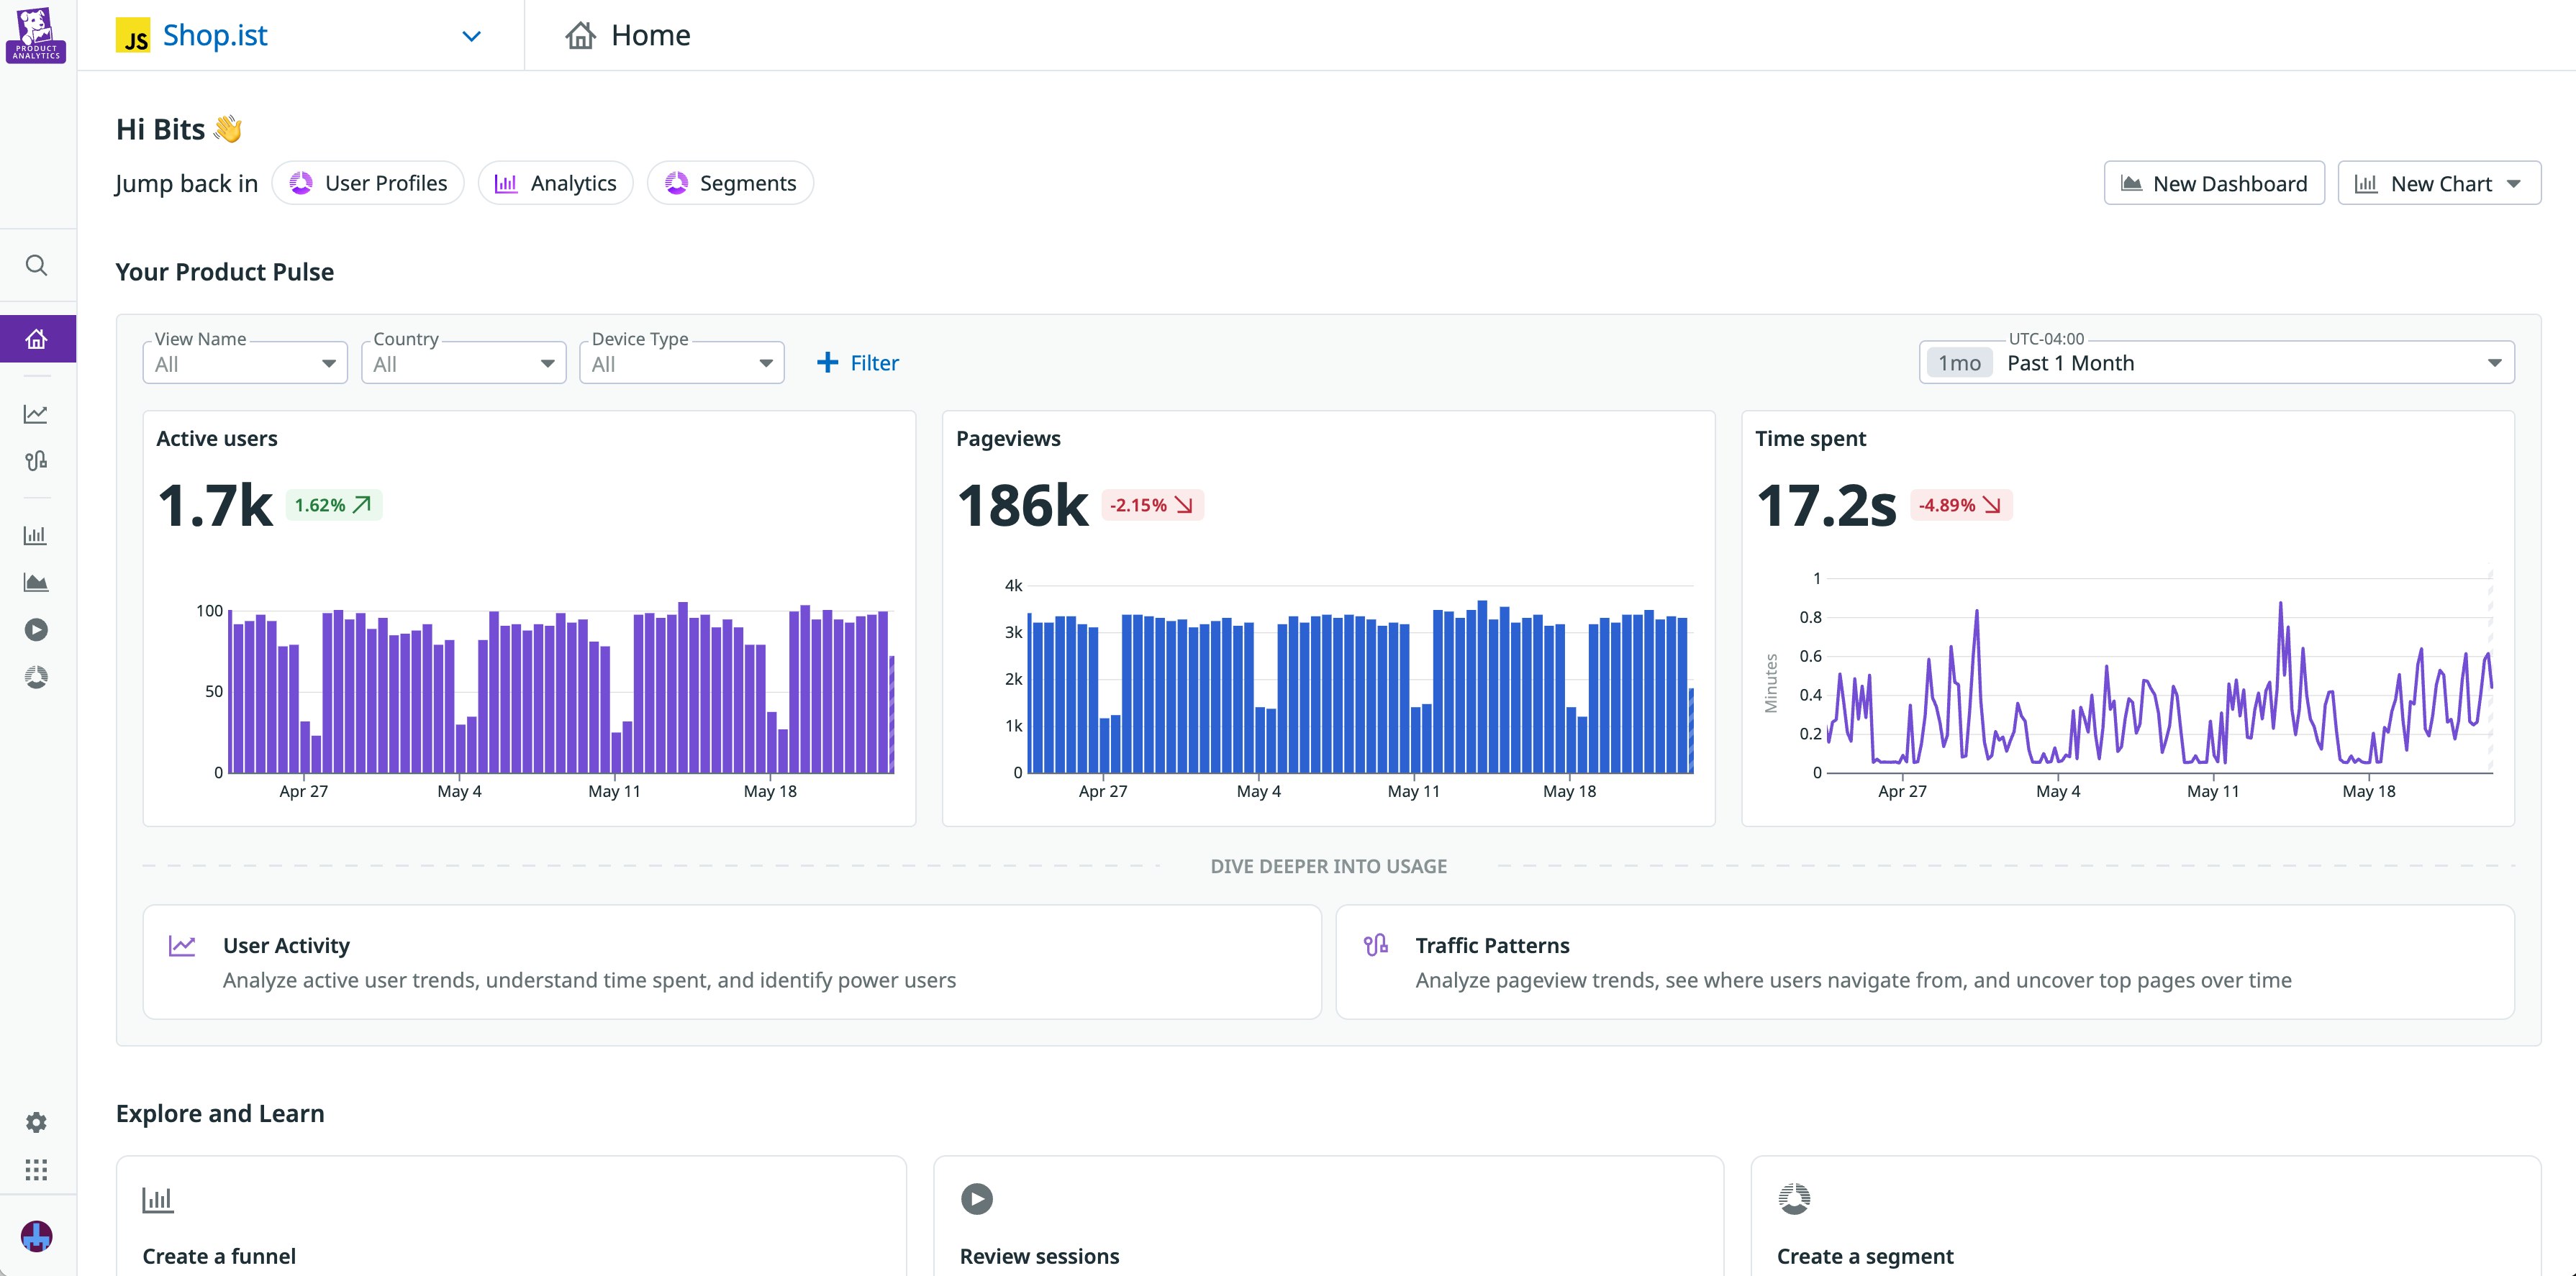
To understand any aspect of user behavior—from adoption and conversion rates to usage patterns and flows—you need to ground your insights in real user data. With Datadog Product Analytics, you can easily dig into user data from across your application and tailor your analyses based on the scope of your projects. You can visualize data on user engagement and interactions through a variety of features, including Heatmaps, Pathways, and Session Replay, helping you quickly assess your UX from multiple angles. Product Analytics is now generally available—to learn more, check out our blog post.
Foster an organization-wide culture of cost ownership with CCM budgets and ML-powered cost anomaly tracking
FinOps practitioners struggle to create an organization-wide culture of cost ownership due to the challenge of putting budgets in front of teams and collaborating with engineers on anomalies that may be taking them over budget. With budgets in Cloud Cost Management, FinOps teams can create budgets across cloud and SaaS providers, and engineering teams can see how they’re tracking against budget throughout the month or year. Machine learning-powered anomaly detection informs FinOps and engineering teams of unexpected cost changes across their accounts, especially anomalies taking them over budget, and makes it easy for FinOps to reach out to the specific teams or services causing the change. To learn more, check out our documentation.
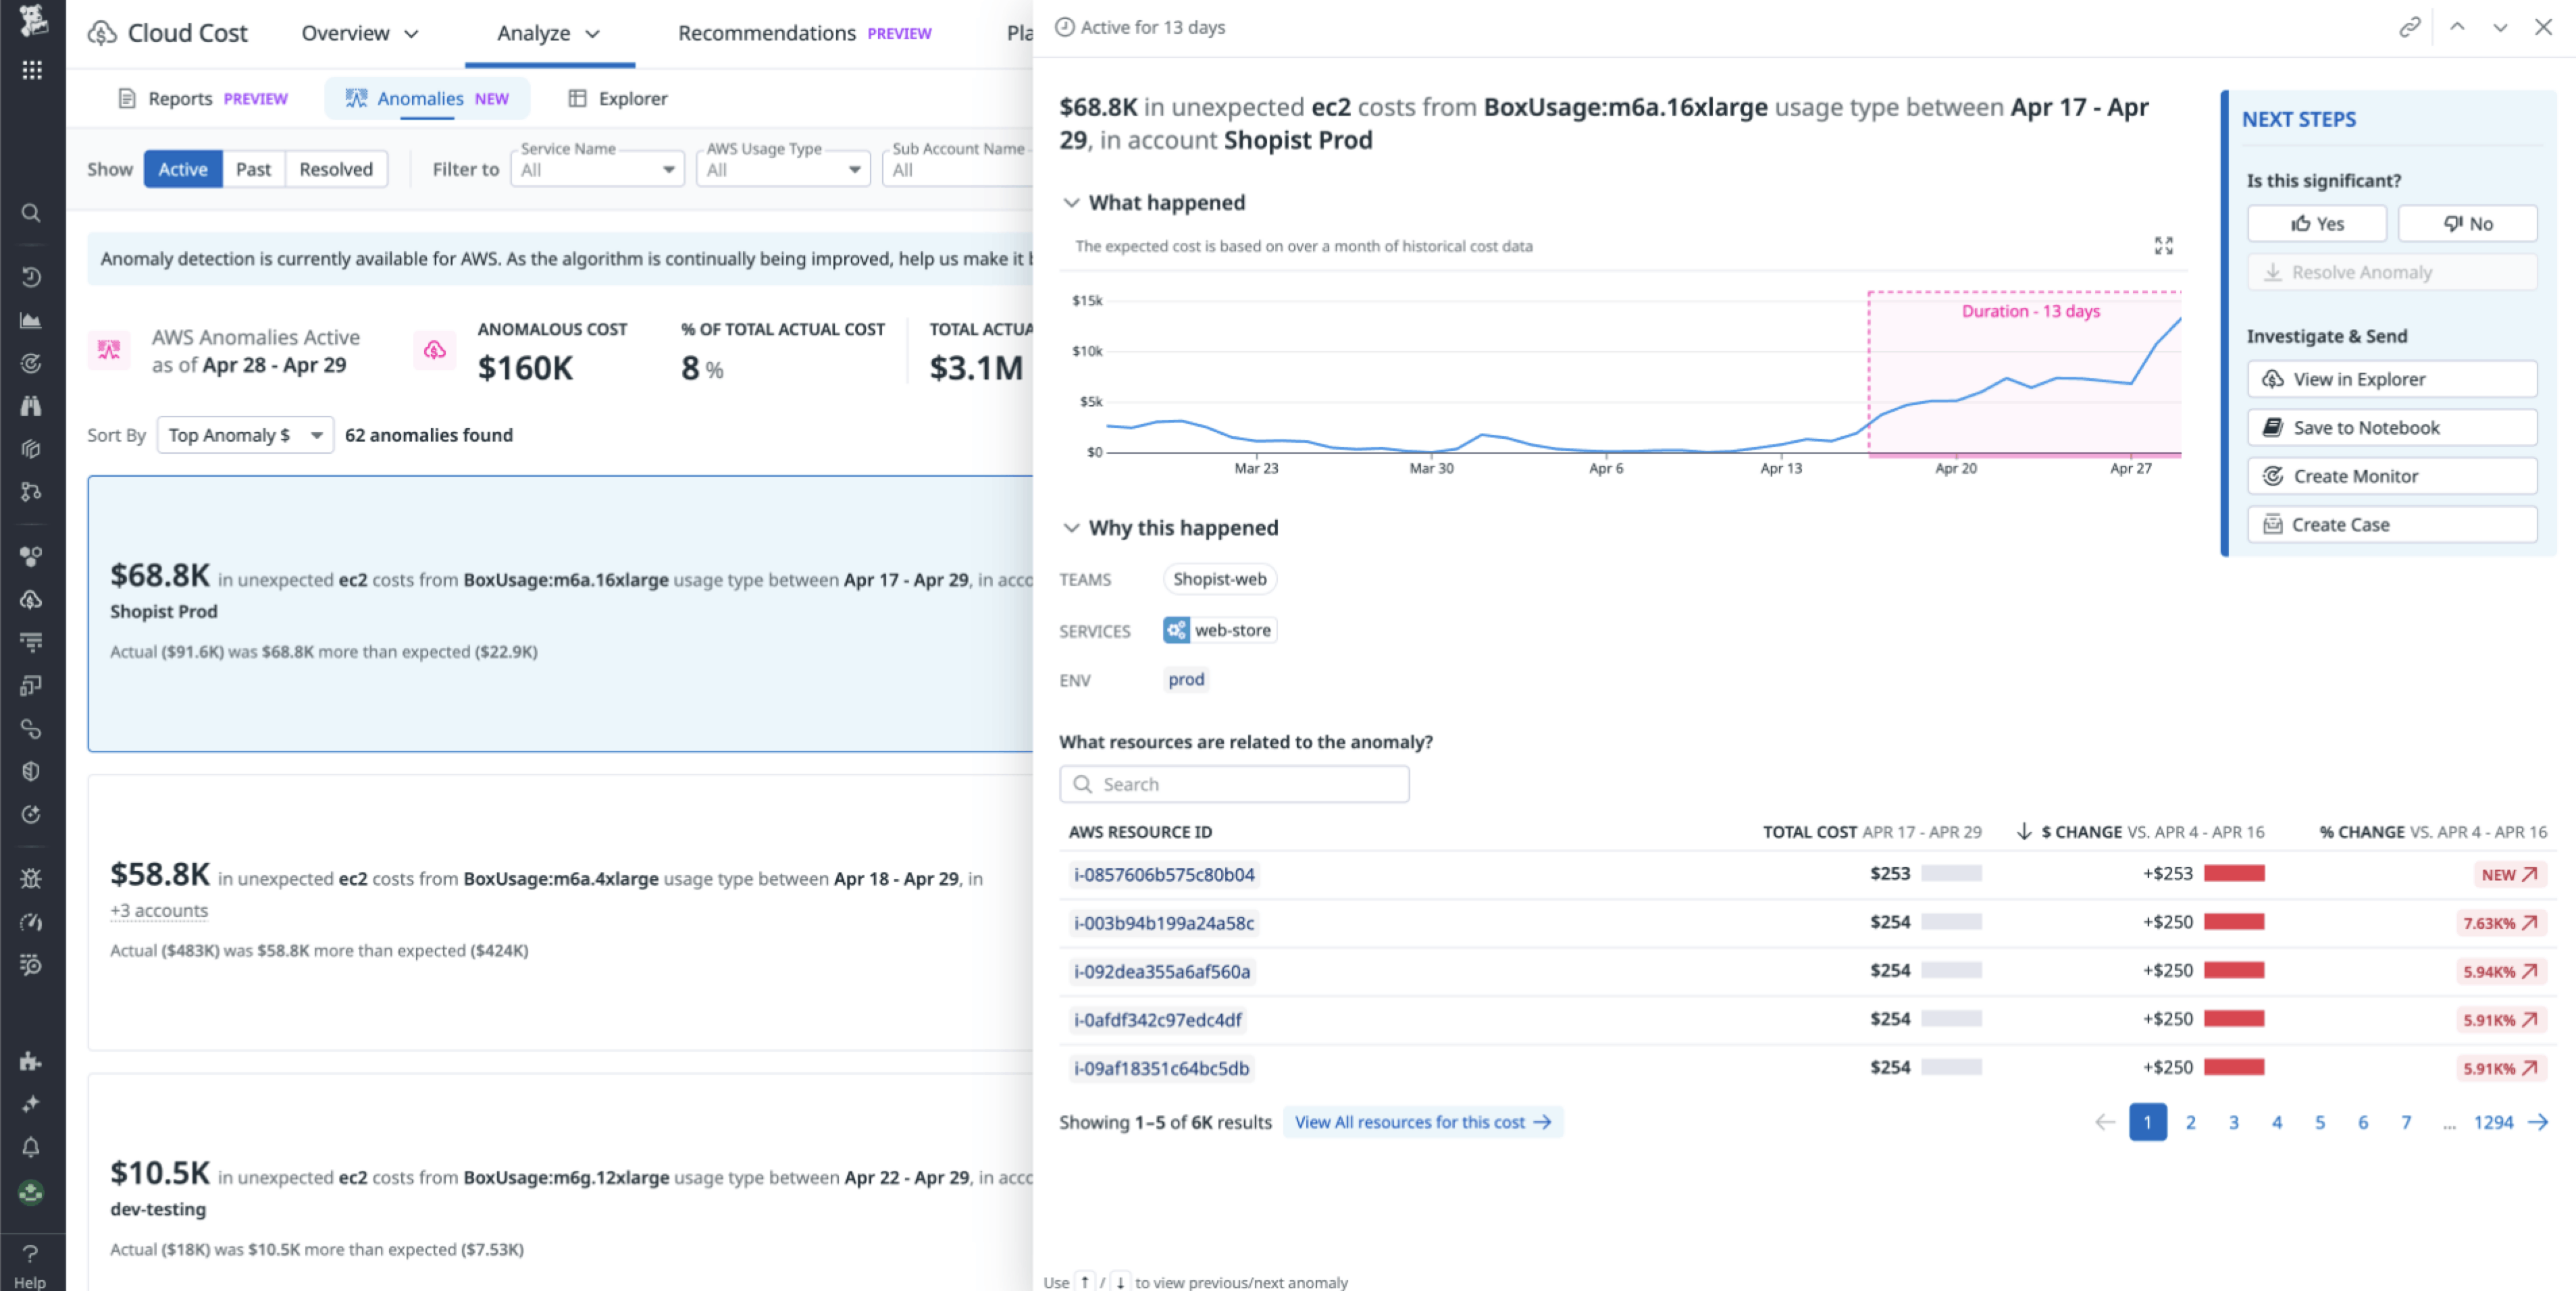
Customize cost recommendations to your business needs with CCM Recommendations
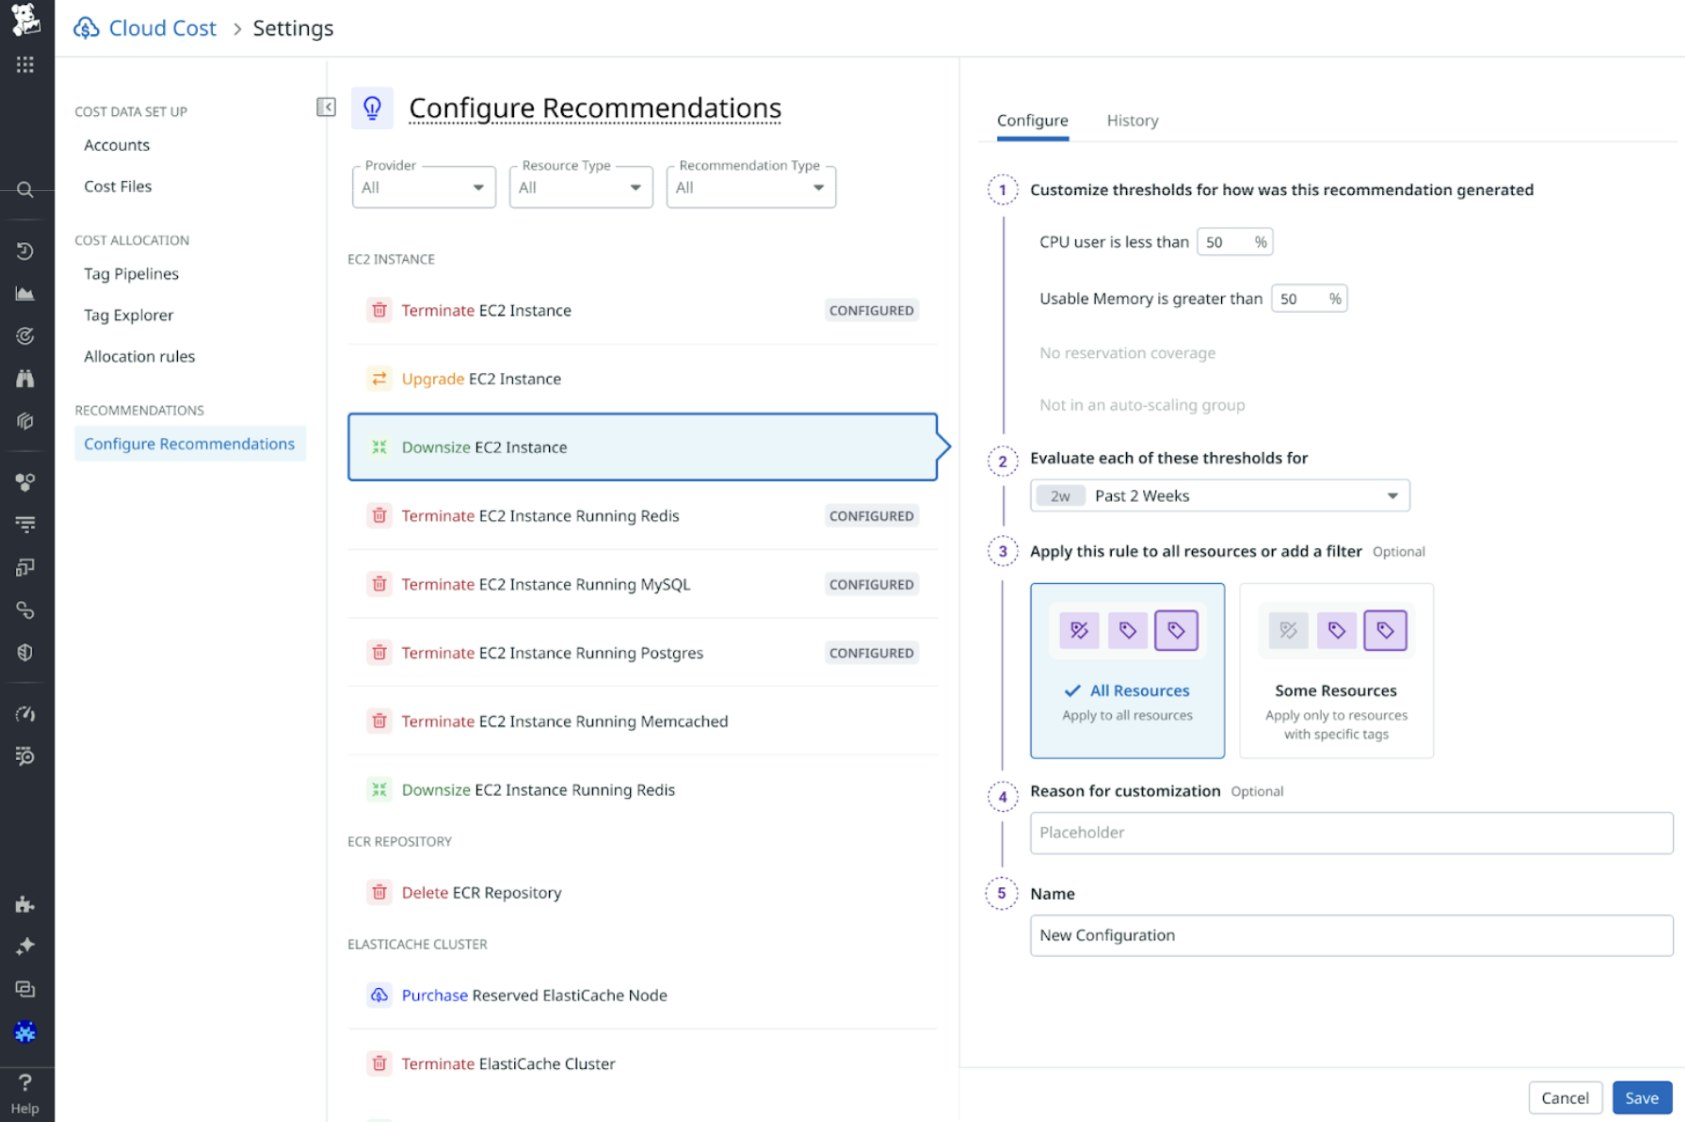
CCM Recommendations now allows you to customize cost recommendations and make them more business-relevant and catered to your needs. You can customize the metric thresholds used to make recommendations on resources, as well as the time frames used to evaluate those thresholds. These customizations can help you reduce noise, take action on recommendations faster, and more quickly realize cost savings across AWS, Azure, and Google Cloud. Sign up for the Preview to get started.
Instantly identify the cause of metric anomalies with Watchdog Explains
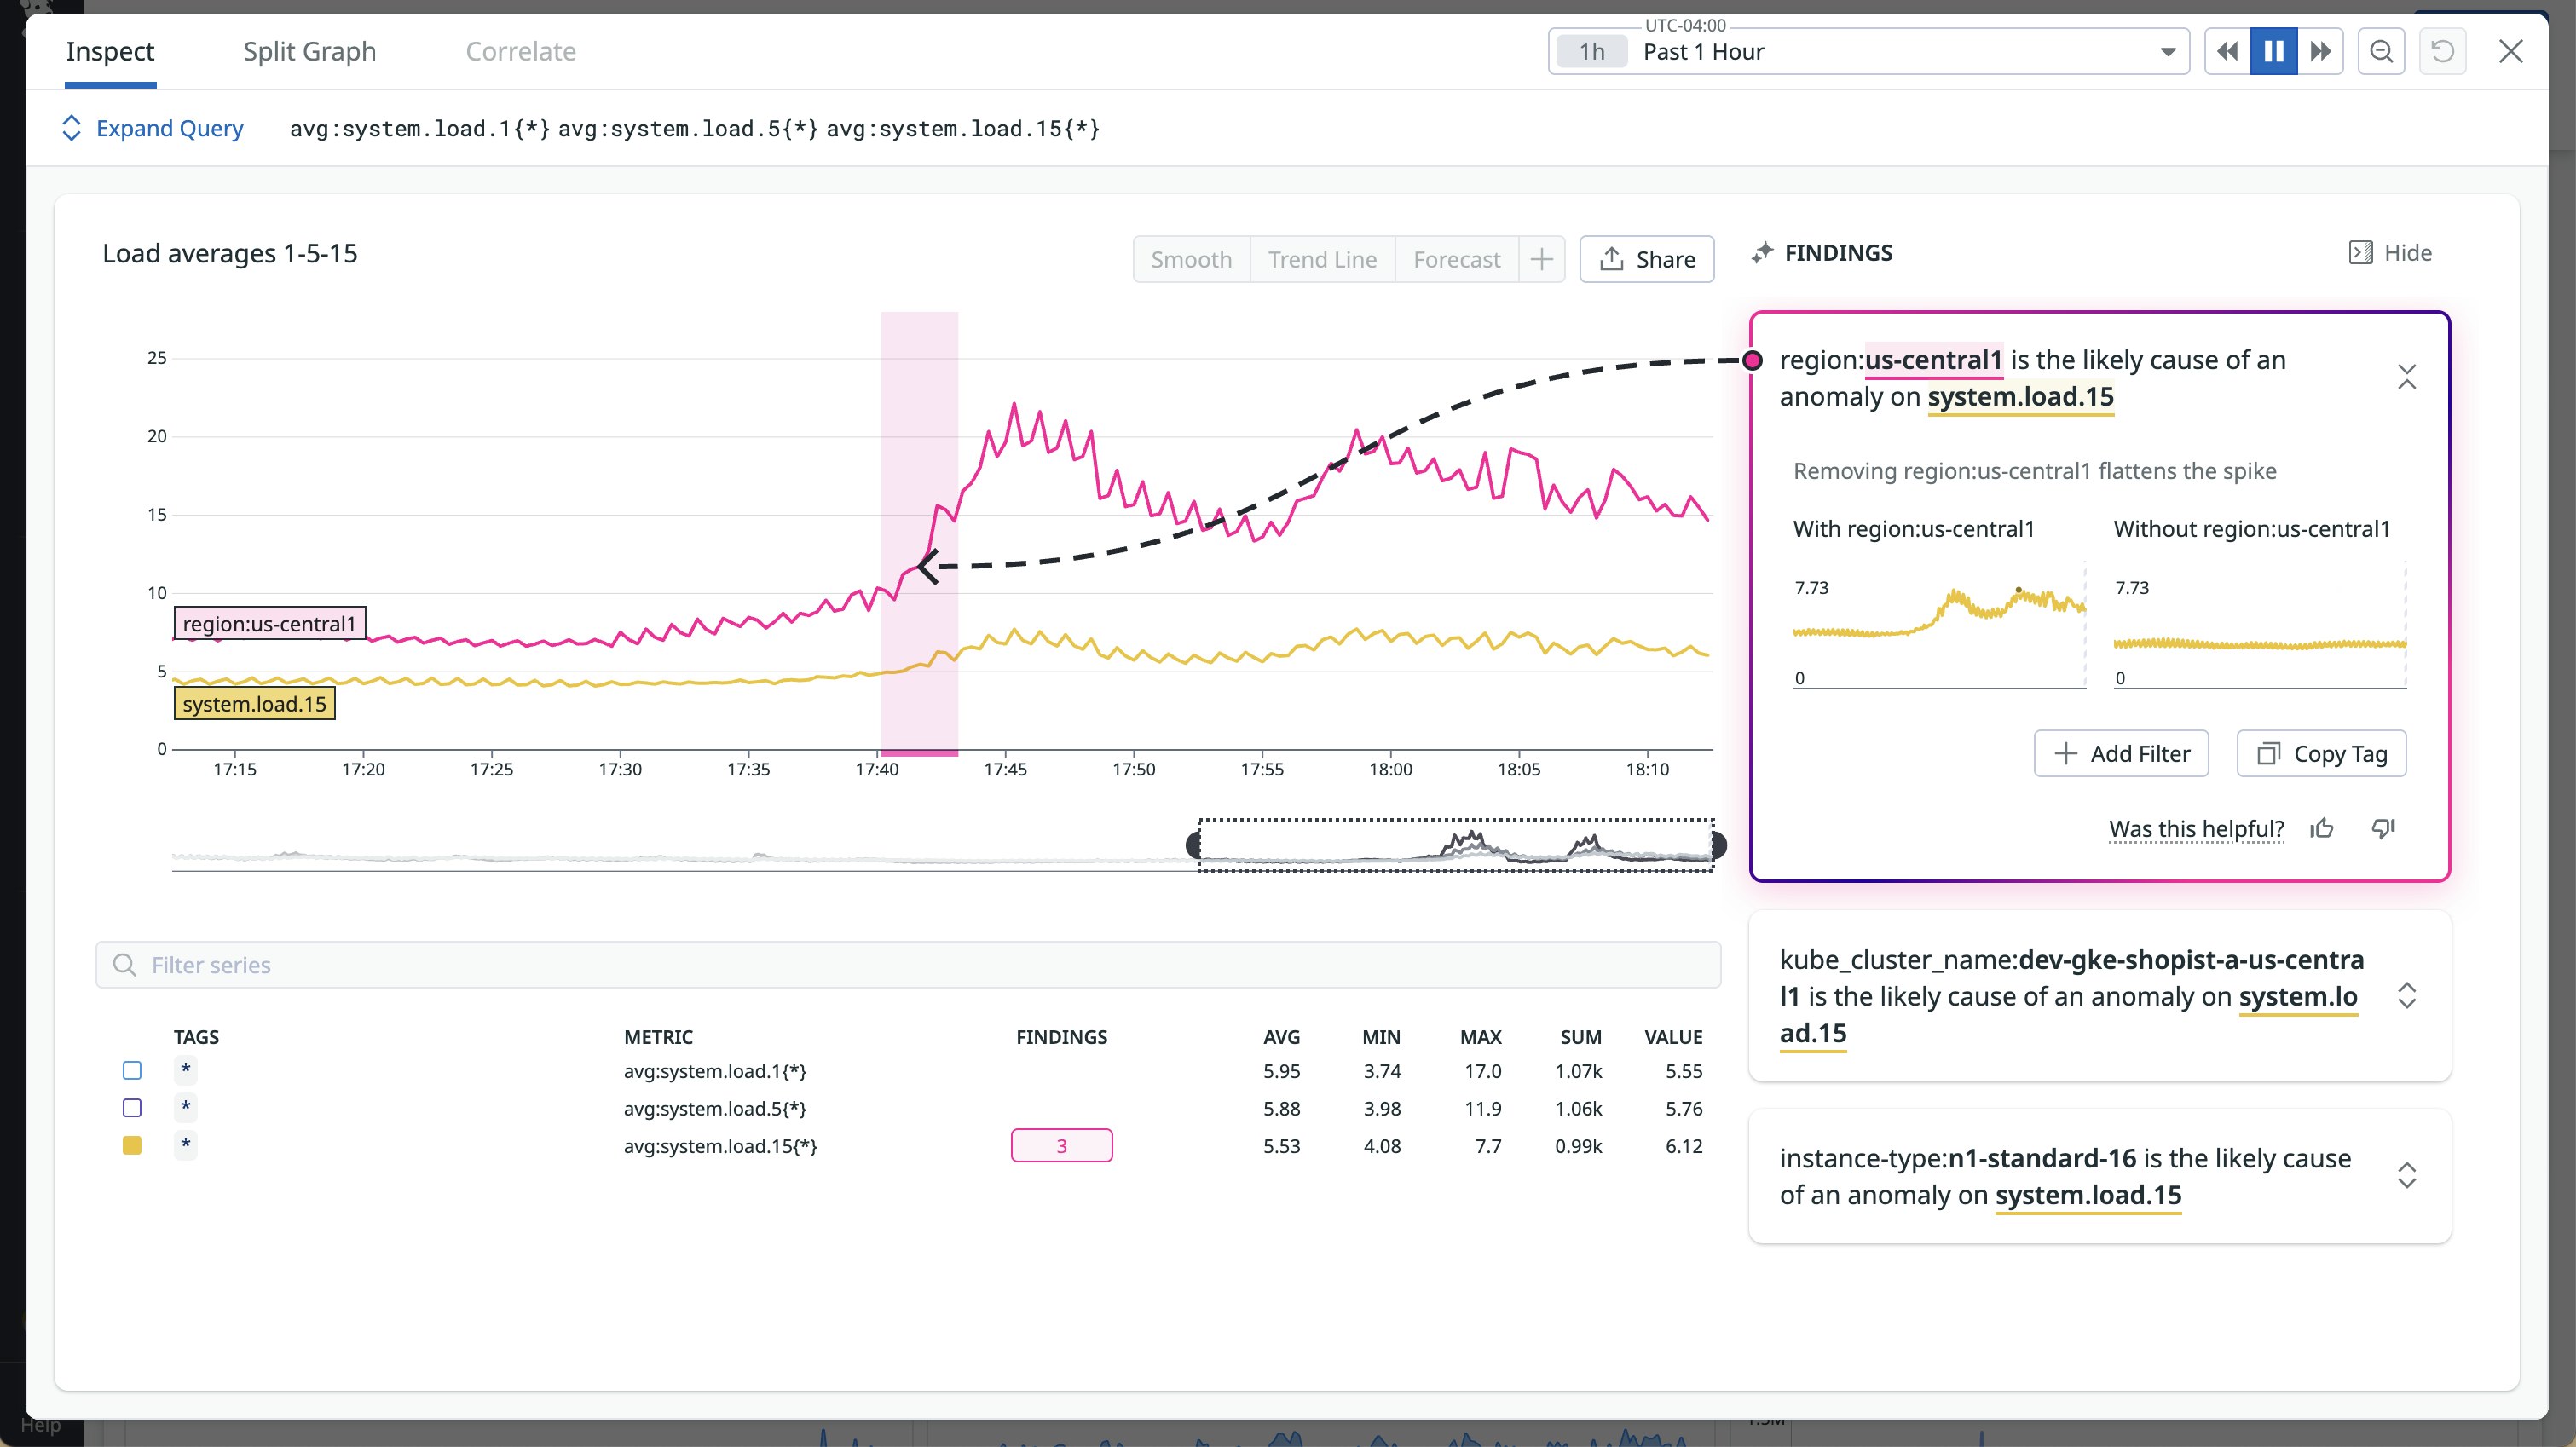
When latency spikes or error rates climb, pinpointing the root cause can take minutes of trial-and-error slicing across dimensions. Watchdog Explains reduces that process to seconds by scanning your graphs for anomalies and automatically identifying which tags are driving the change. By testing different tag key-value combinations, Watchdog Explains highlights the most statistically significant contributors to a metric—including regions, deployments, API routes, or hosts—so you can quickly focus your investigation on problematic areas of your infrastructure or software stack. This feature is available on metrics-based timeseries graphs in dashboards. Learn more in our documentation or try it out today.
Stay ahead of infrastructure changes and performance issues
Ensure health and performance of employee devices with End User Device Monitoring
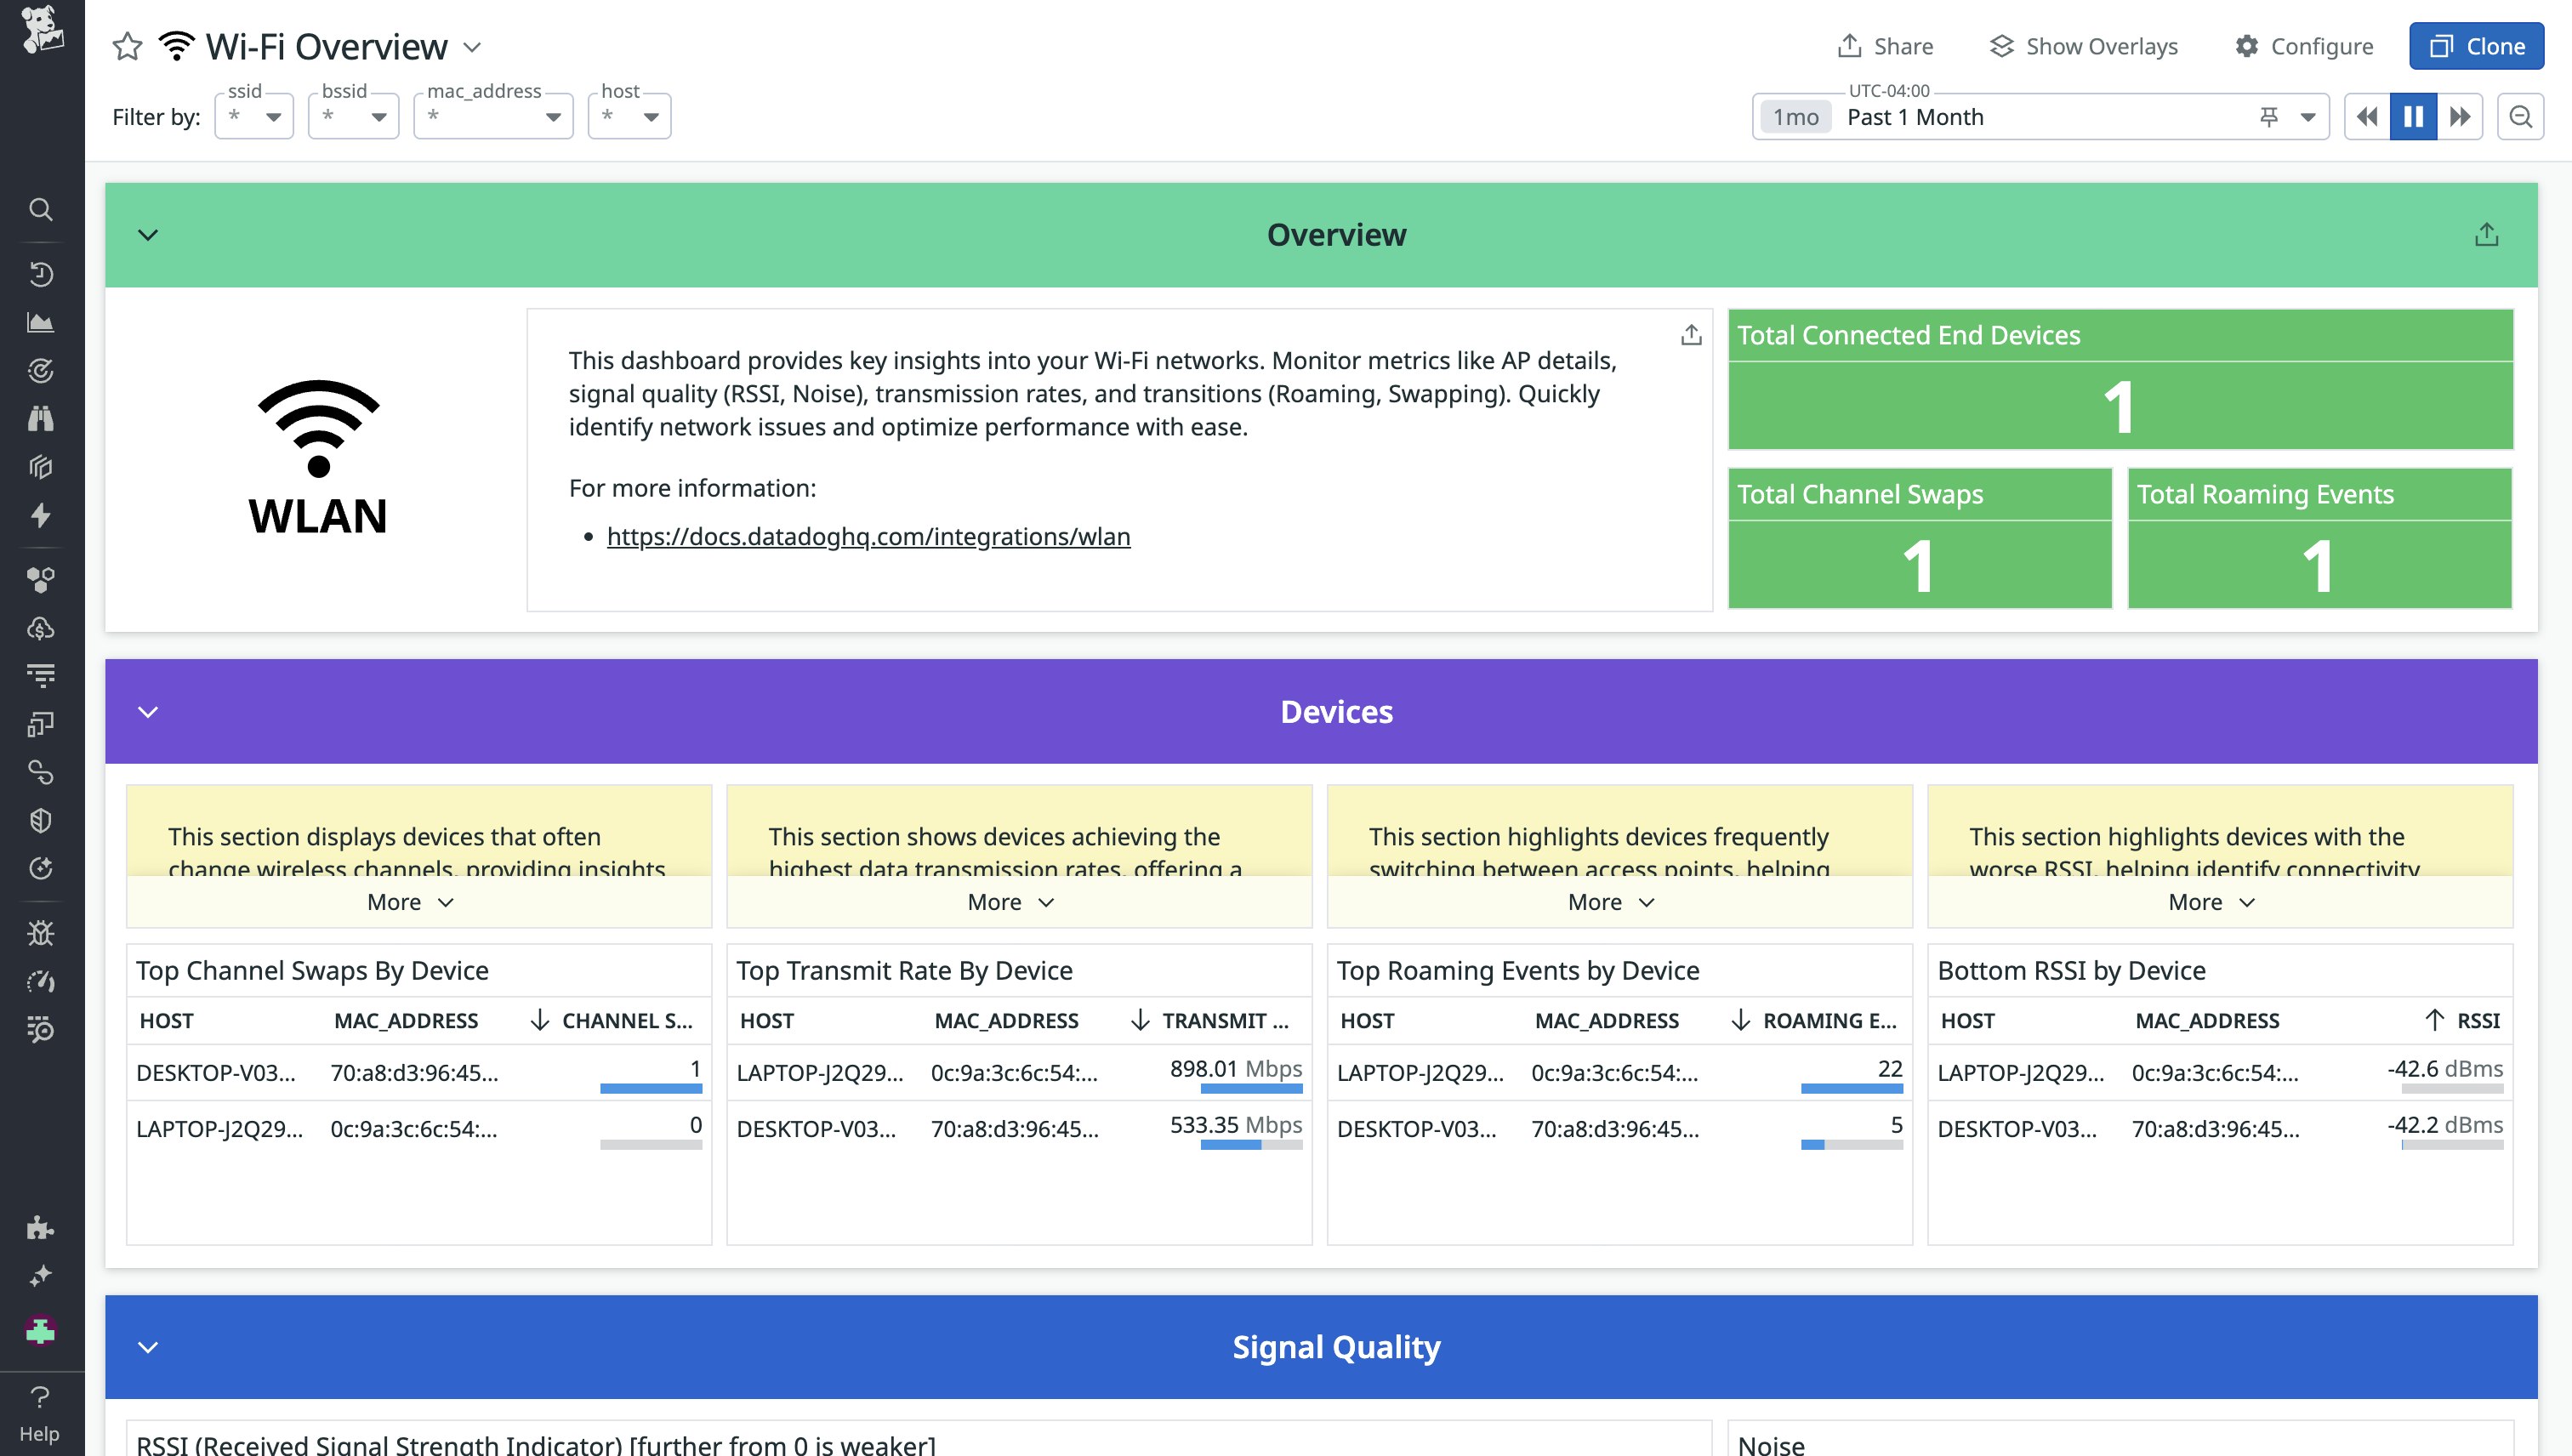
End user devices such as desktops, laptops, and workstations are essential tools that employees, contractors, and students use daily. In enterprise environments, it’s critical that these devices function reliably to avoid disruptions to productivity. IT administrators and Enterprise IT Operations and Endpoint Management teams all play a role in ensuring that company-issued hardware is always available and performing well. Datadog End User Device Monitoring provides visibility into device health and performance. It helps IT teams quickly diagnose and resolve issues such as slow performance or network connectivity problems before they impact users. With built-in checks for disk, memory, CPU, uptime, services, and processes, teams can efficiently troubleshoot device issues. Out-of-the-box integrations offer alerts for critical events like Blue Screens of Death (BSODs), while Wi-Fi and Network Path monitoring help pinpoint and resolve connectivity problems. See it in action—sign up for the Preview today.
Ensure continuous monitoring of your network devices with high availability support of the Datadog Agent for NDM
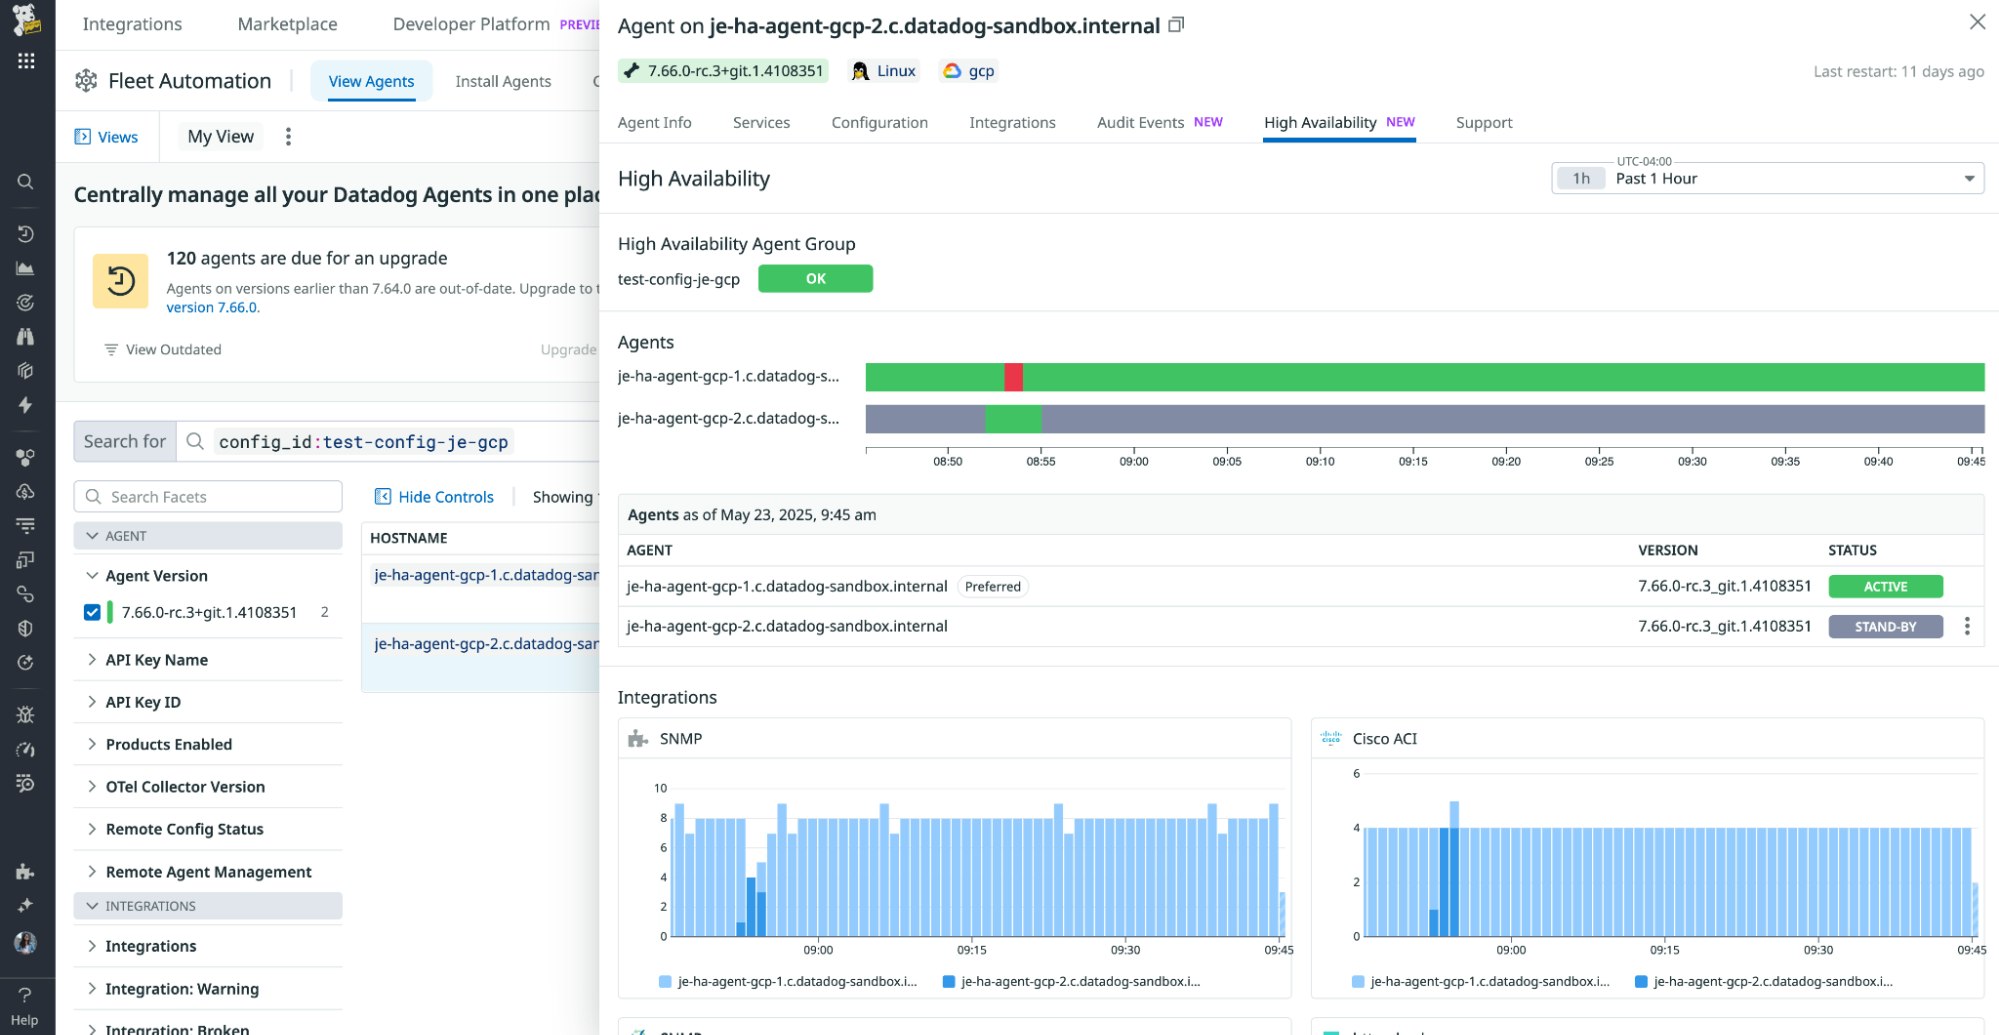
High Availability (HA) support of the Datadog Agent is now generally available for Network Device Monitoring (NDM). If a designated active Datadog Agent becomes unavailable, HA support enables seamless failover to a standby Agent. HA support ensures continuous monitoring of your network devices during planned maintenance periods (for example OS updates or Agent patches) or unexpected incidents. When an active Agent that is monitoring network devices is down, the standby Agent will automatically take over monitoring of the respective network devices within 90 seconds, becoming the active Agent.
See our documentation for more information about HA support of the Datadog Agent.
Monitor every process on your hosts without any code with Full Host Profiling
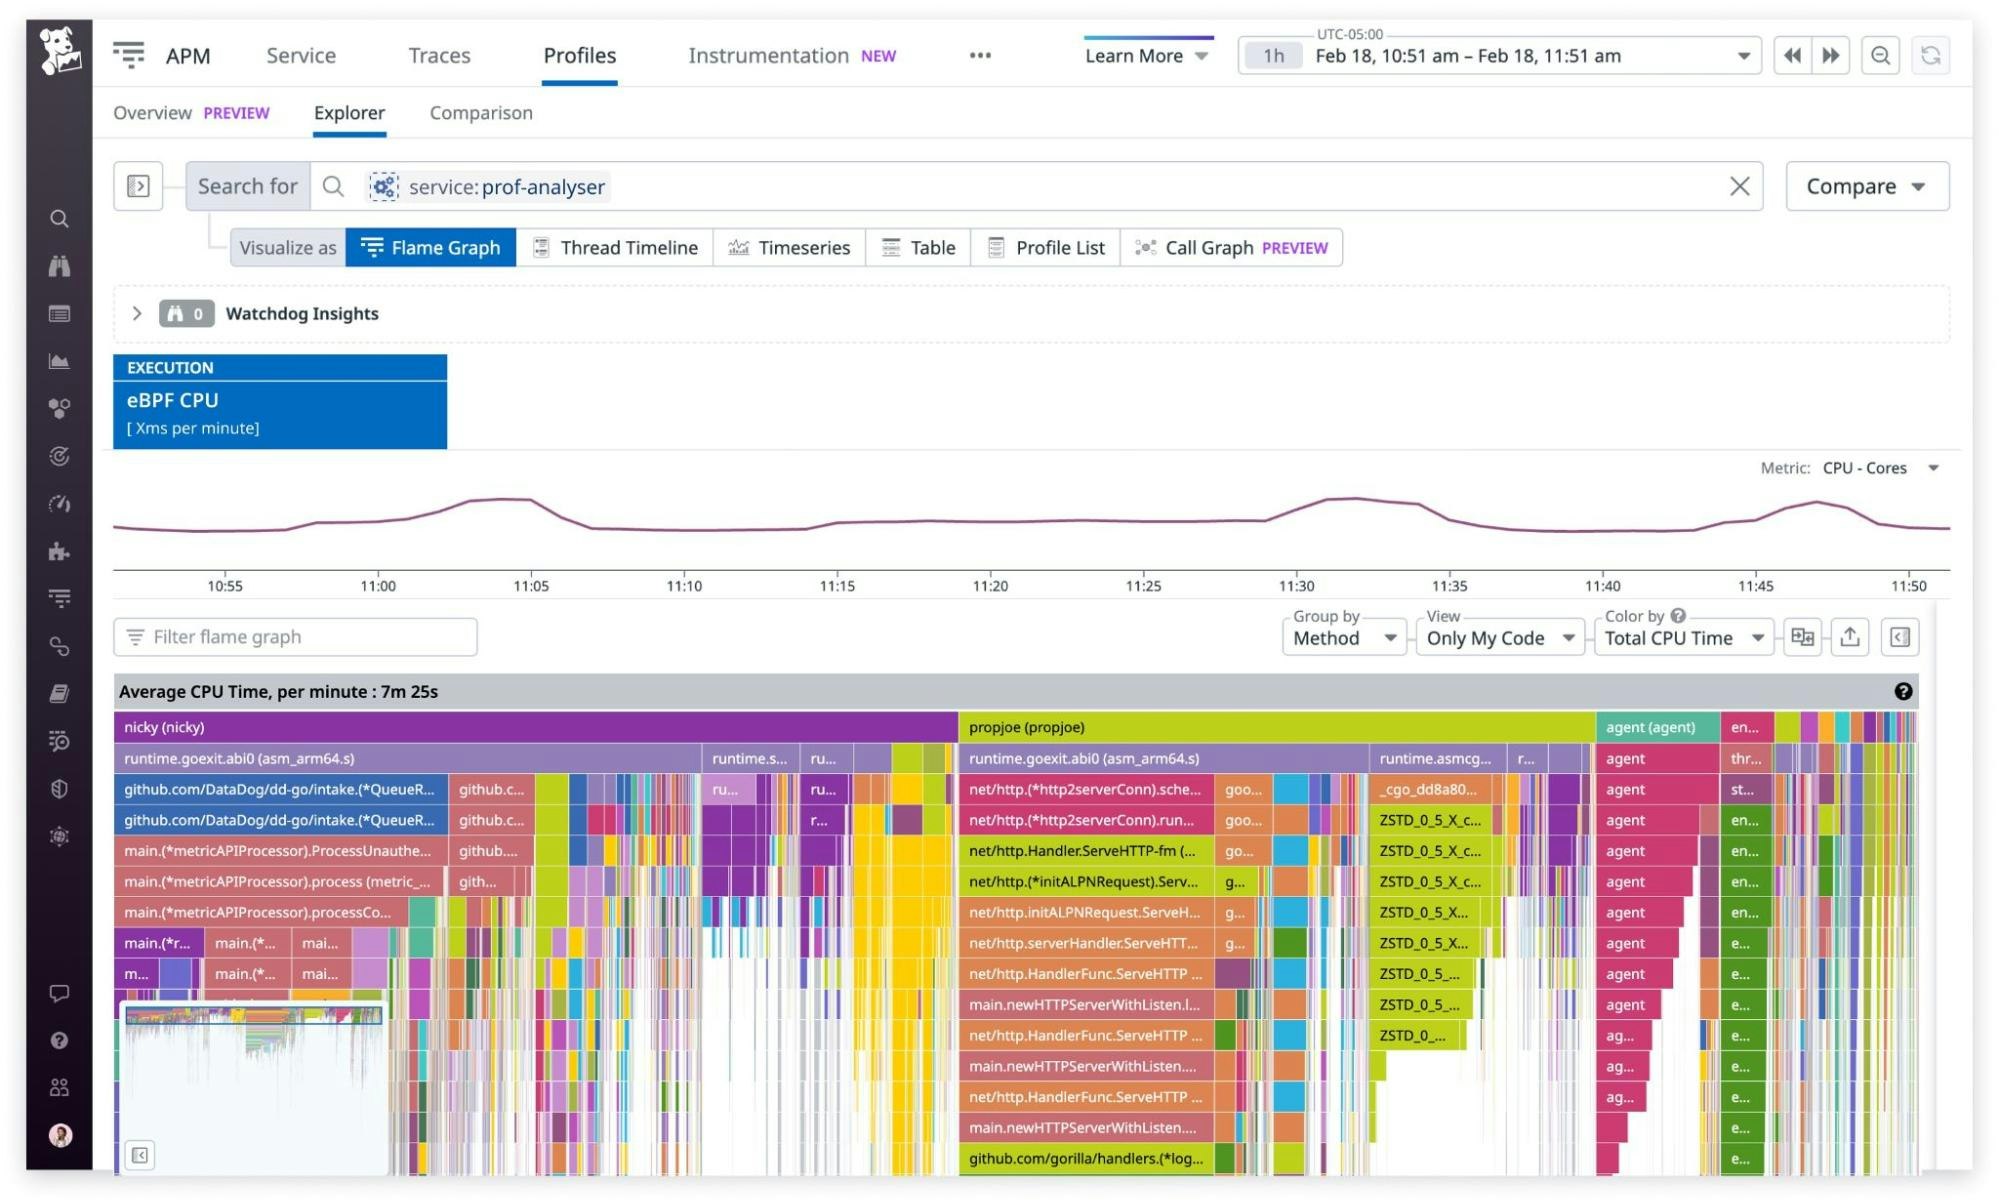
Datadog Full Host Profiling brings always-on, zero-code visibility into every process running on your hosts (including databases, system services, and even the kernel) without modifying your application code. Built on eBPF and OpenTelemetry, Full Host Profiling captures high-fidelity performance data from all runtimes with minimal overhead, so you can safely use it in production environments at scale. Whether you’re troubleshooting a CPU spike or trying to optimize system-level performance, Full Host Profiling gives you the deep context you need, all without writing a single line of code. Sign up for the Preview here.
Diagnose frontend issues faster by connecting user experience data to backend performance with Browser Profiler
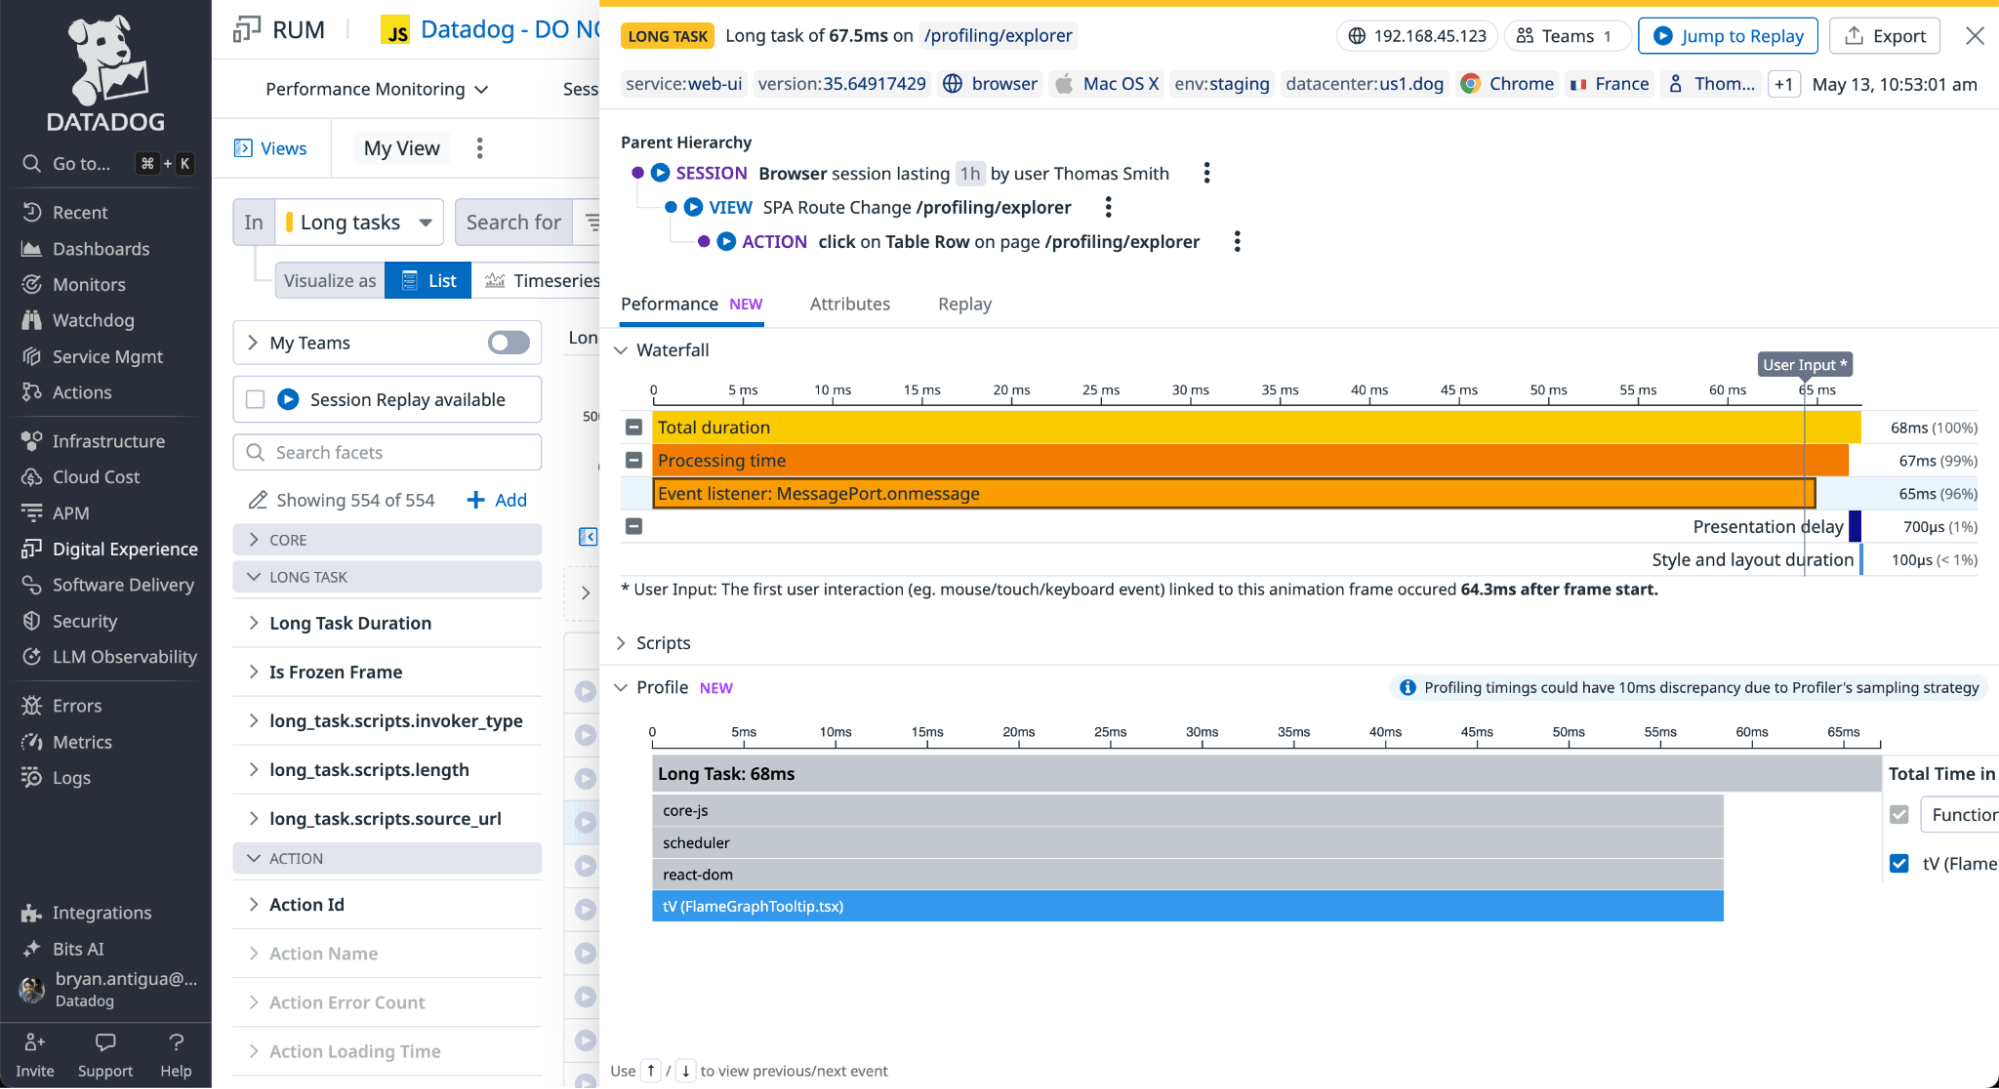
Datadog now makes it easier to understand not just what users are experiencing, but why. Browser Profiler combines Real User Monitoring (RUM) with Continuous Profiler to give teams complete visibility into application performance, from frontend interactions to backend bottlenecks.
RUM highlights where users are facing issues such as slow load times, unresponsive pages, or degraded interactions. Continuous Profiler then reveals the underlying cause, showing exactly which code paths, methods, or dependencies are driving the problem. This end-to-end view accelerates root cause analysis, shortens time to resolution, and helps teams deliver faster, more reliable experiences with confidence.
With RUM and Continuous Profiler working together, you can proactively improve performance across your entire stack. Request access to the Preview here.
Manage your Datadog spend with Datadog cost data in Cloud Cost Management
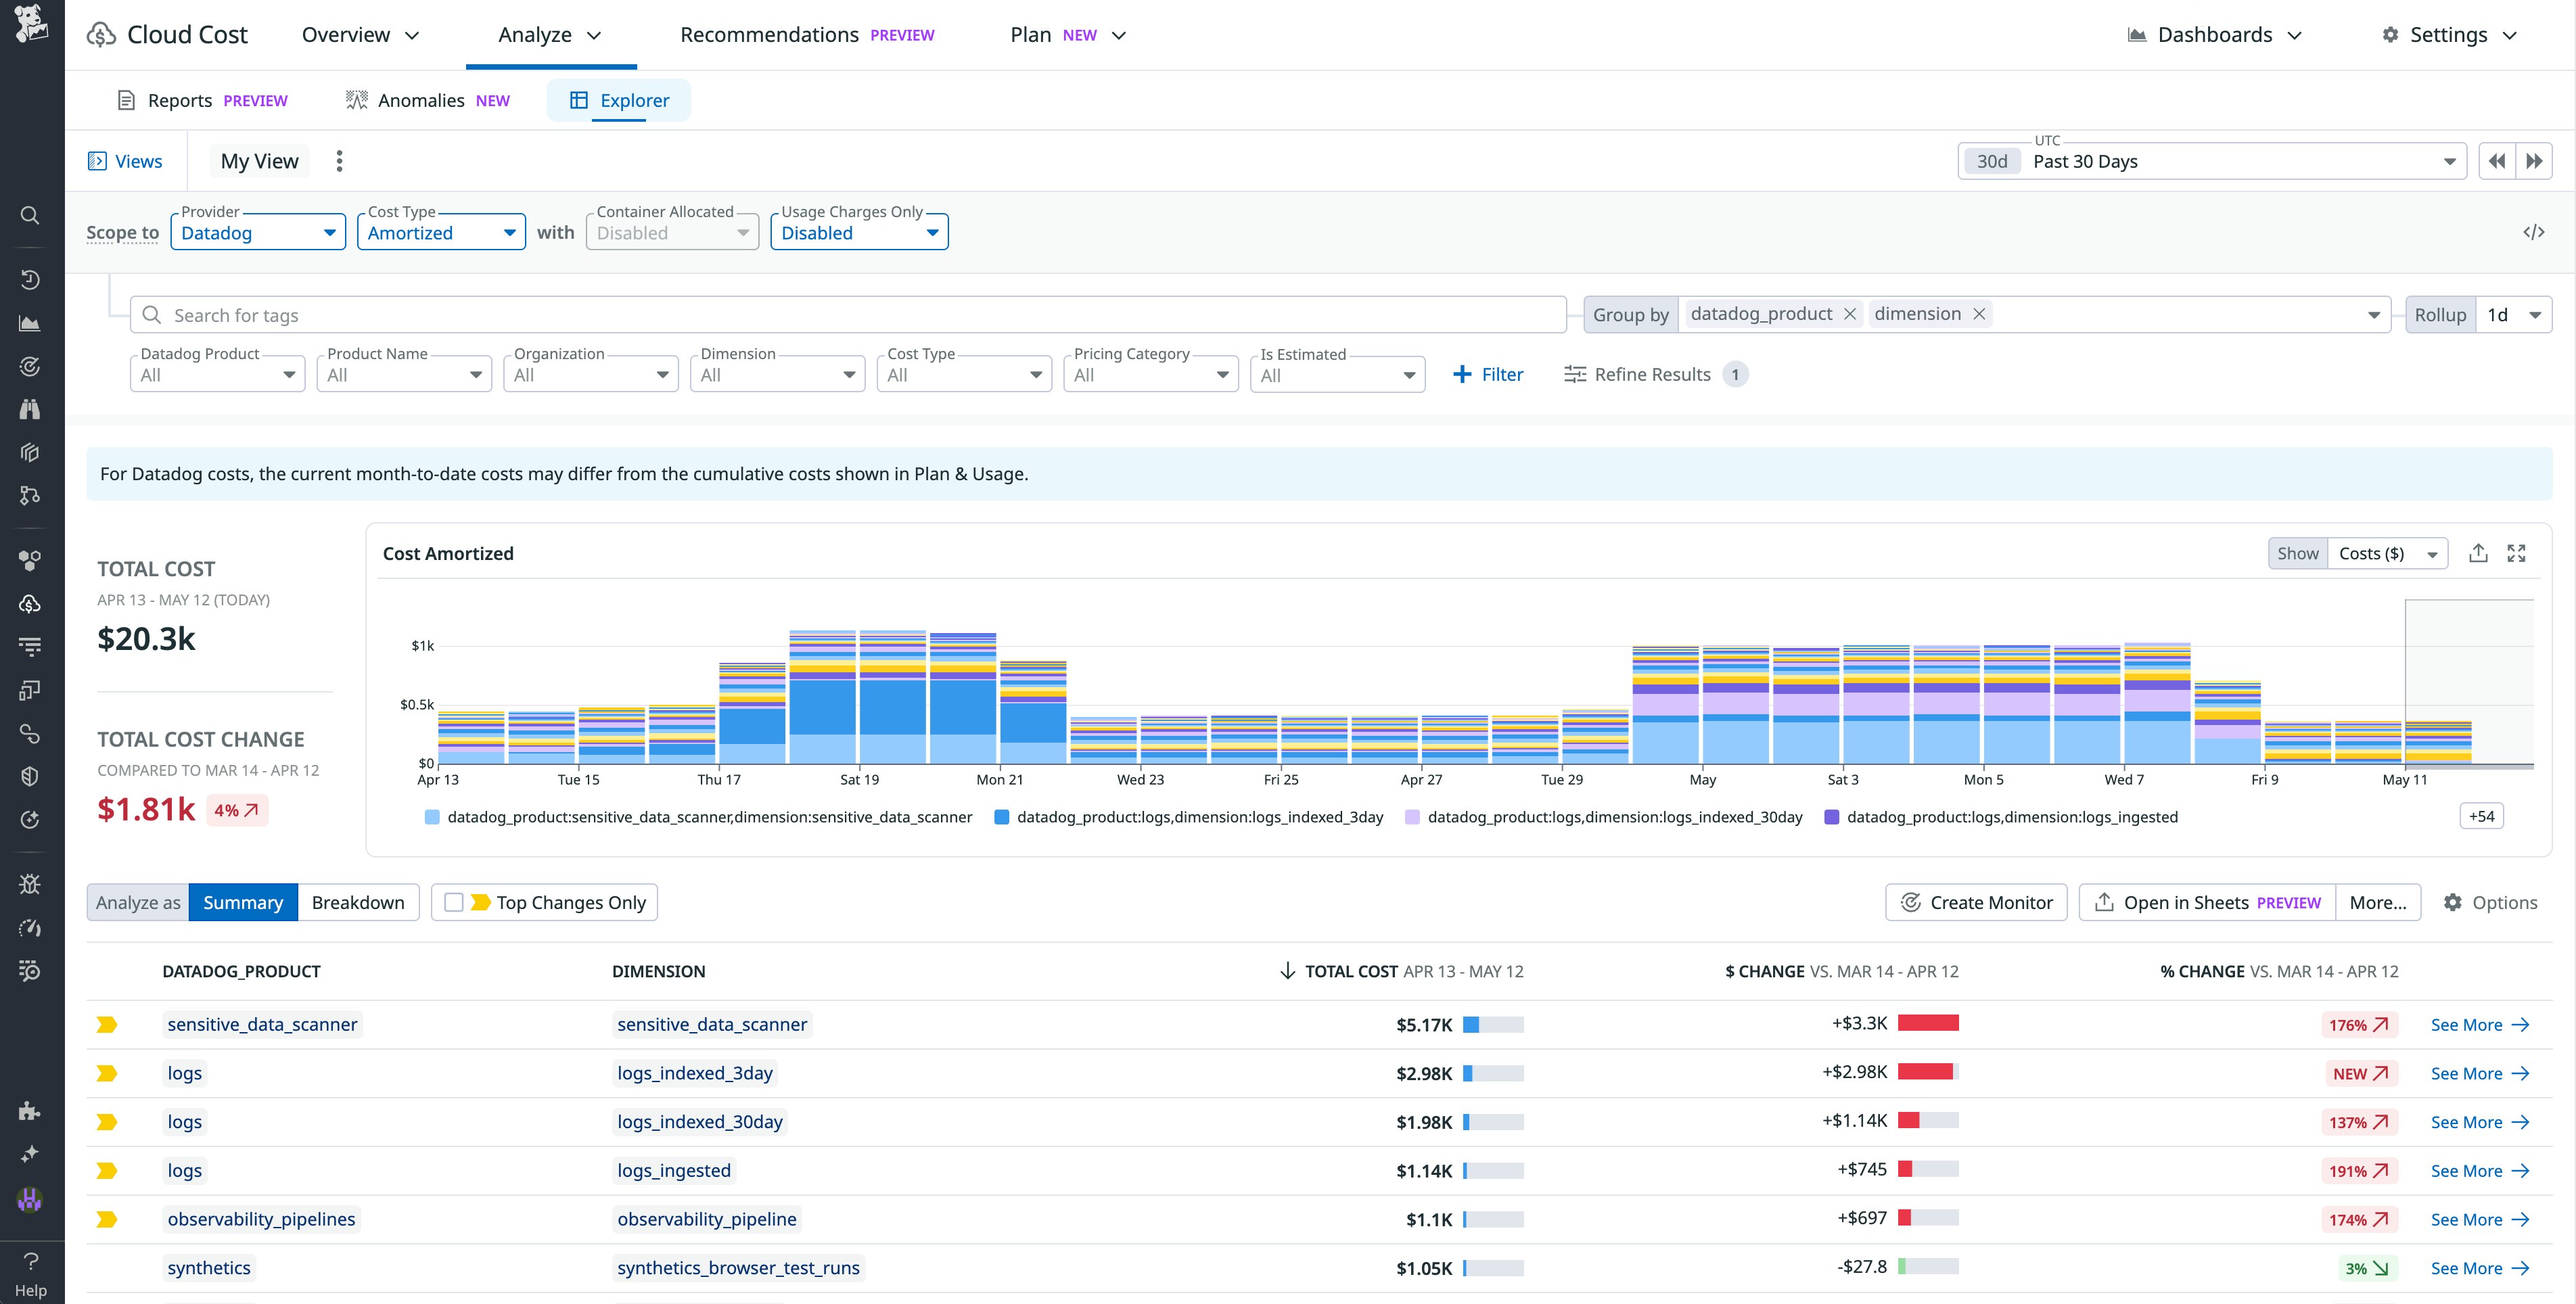
As your organization scales its Datadog footprint, you want to understand what’s driving cost changes and promote cost awareness. But to take meaningful action, you need more than a monthly bill—you need real-time, contextualized cost data tied to services and teams. With Datadog cost data in Cloud Cost Management (CCM), you can now understand how much it costs to run your Datadog services, allocate spend to the right teams, and proactively manage spend. Datadog cost metrics are available across CCM Explorer, dashboards, notebooks, and monitors, so your teams can prioritize cost in their daily activities. To learn more about this feature, which is in Limited Availability, check out our blog post and documentation.
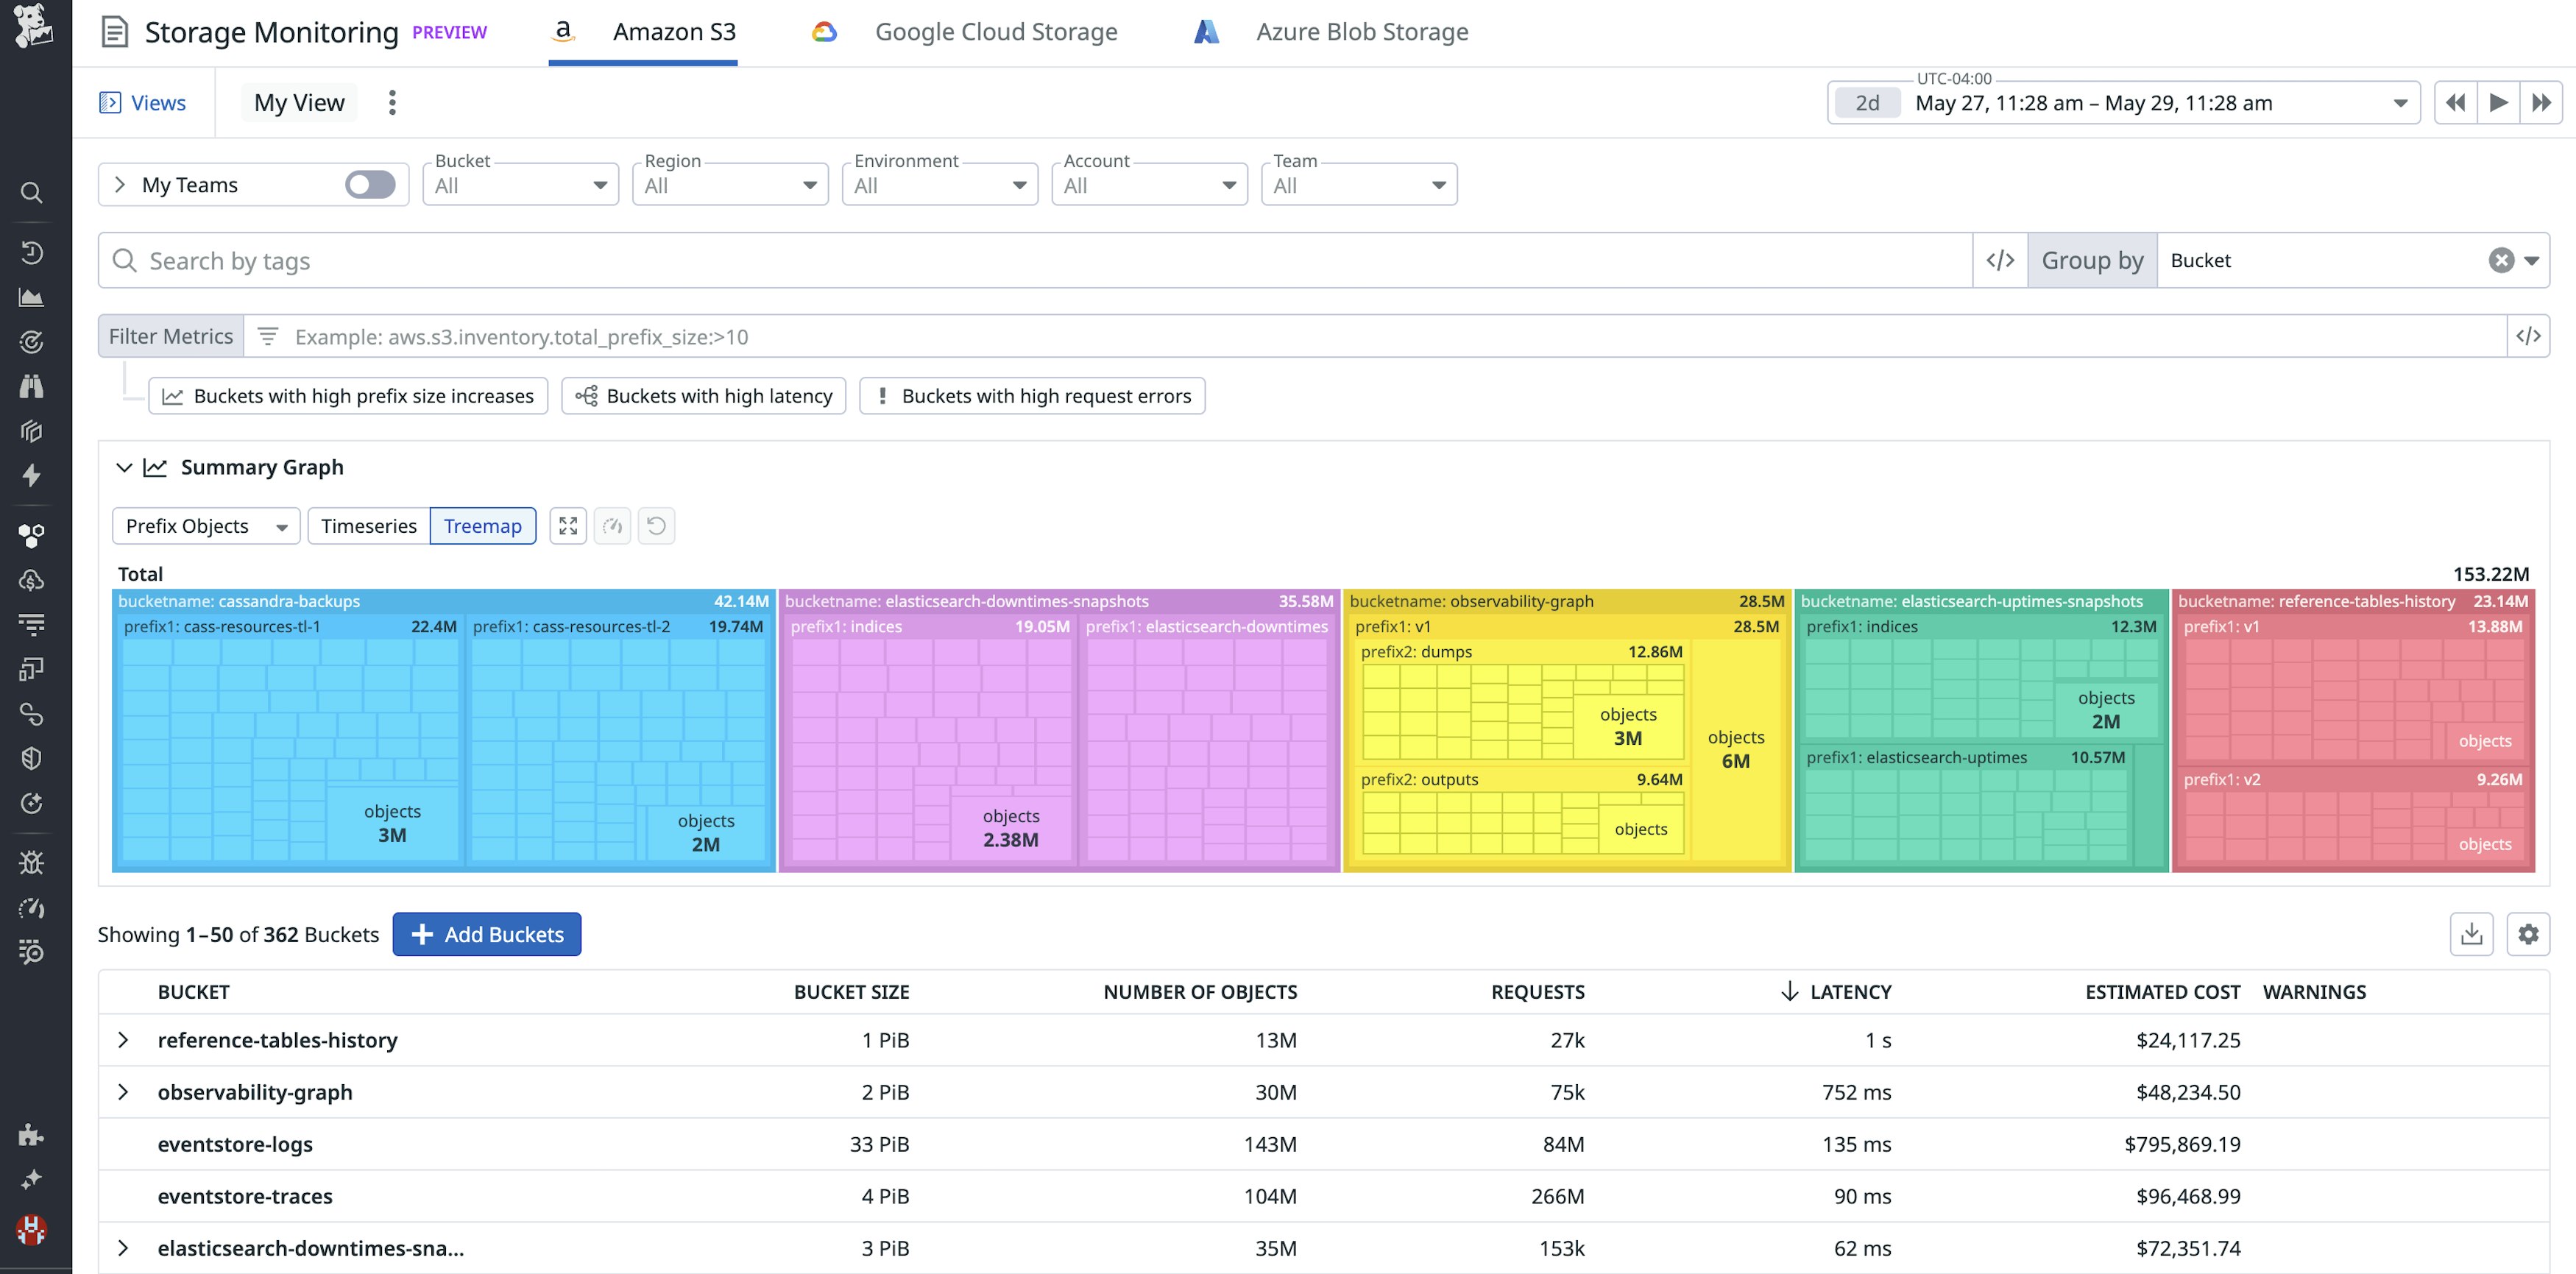
Reduce storage costs and improve efficiency with Datadog Storage Monitoring for Amazon S3, Google Cloud Storage, and Azure Blob Storage
Datadog’s new Storage Monitoring capabilities help organizations reduce cloud storage costs and improve efficiency by offering granular visibility into usage across Amazon S3, Google Cloud Storage, and Azure Blob Storage. As data-intensive workloads like those generated by AI apps continue to grow, even minor inefficiencies in object storage can lead to significant cost and performance challenges. Storage Monitoring’s S3 prefix-level metrics and visibility into bucket-level lifecycle and retention policies help you identify cold data for archival storage, pinpoint performance bottlenecks caused by hot prefixes, and manage lifecycle policies more effectively. Storage Monitoring for S3 is available today in Preview, along with prefix-level usage metrics for Google Cloud Storage and Azure Blob Storage. Request-related metrics for Google Cloud Storage and Azure Blob Storage are coming soon.
Sign up for the Preview and read more in our blog post.
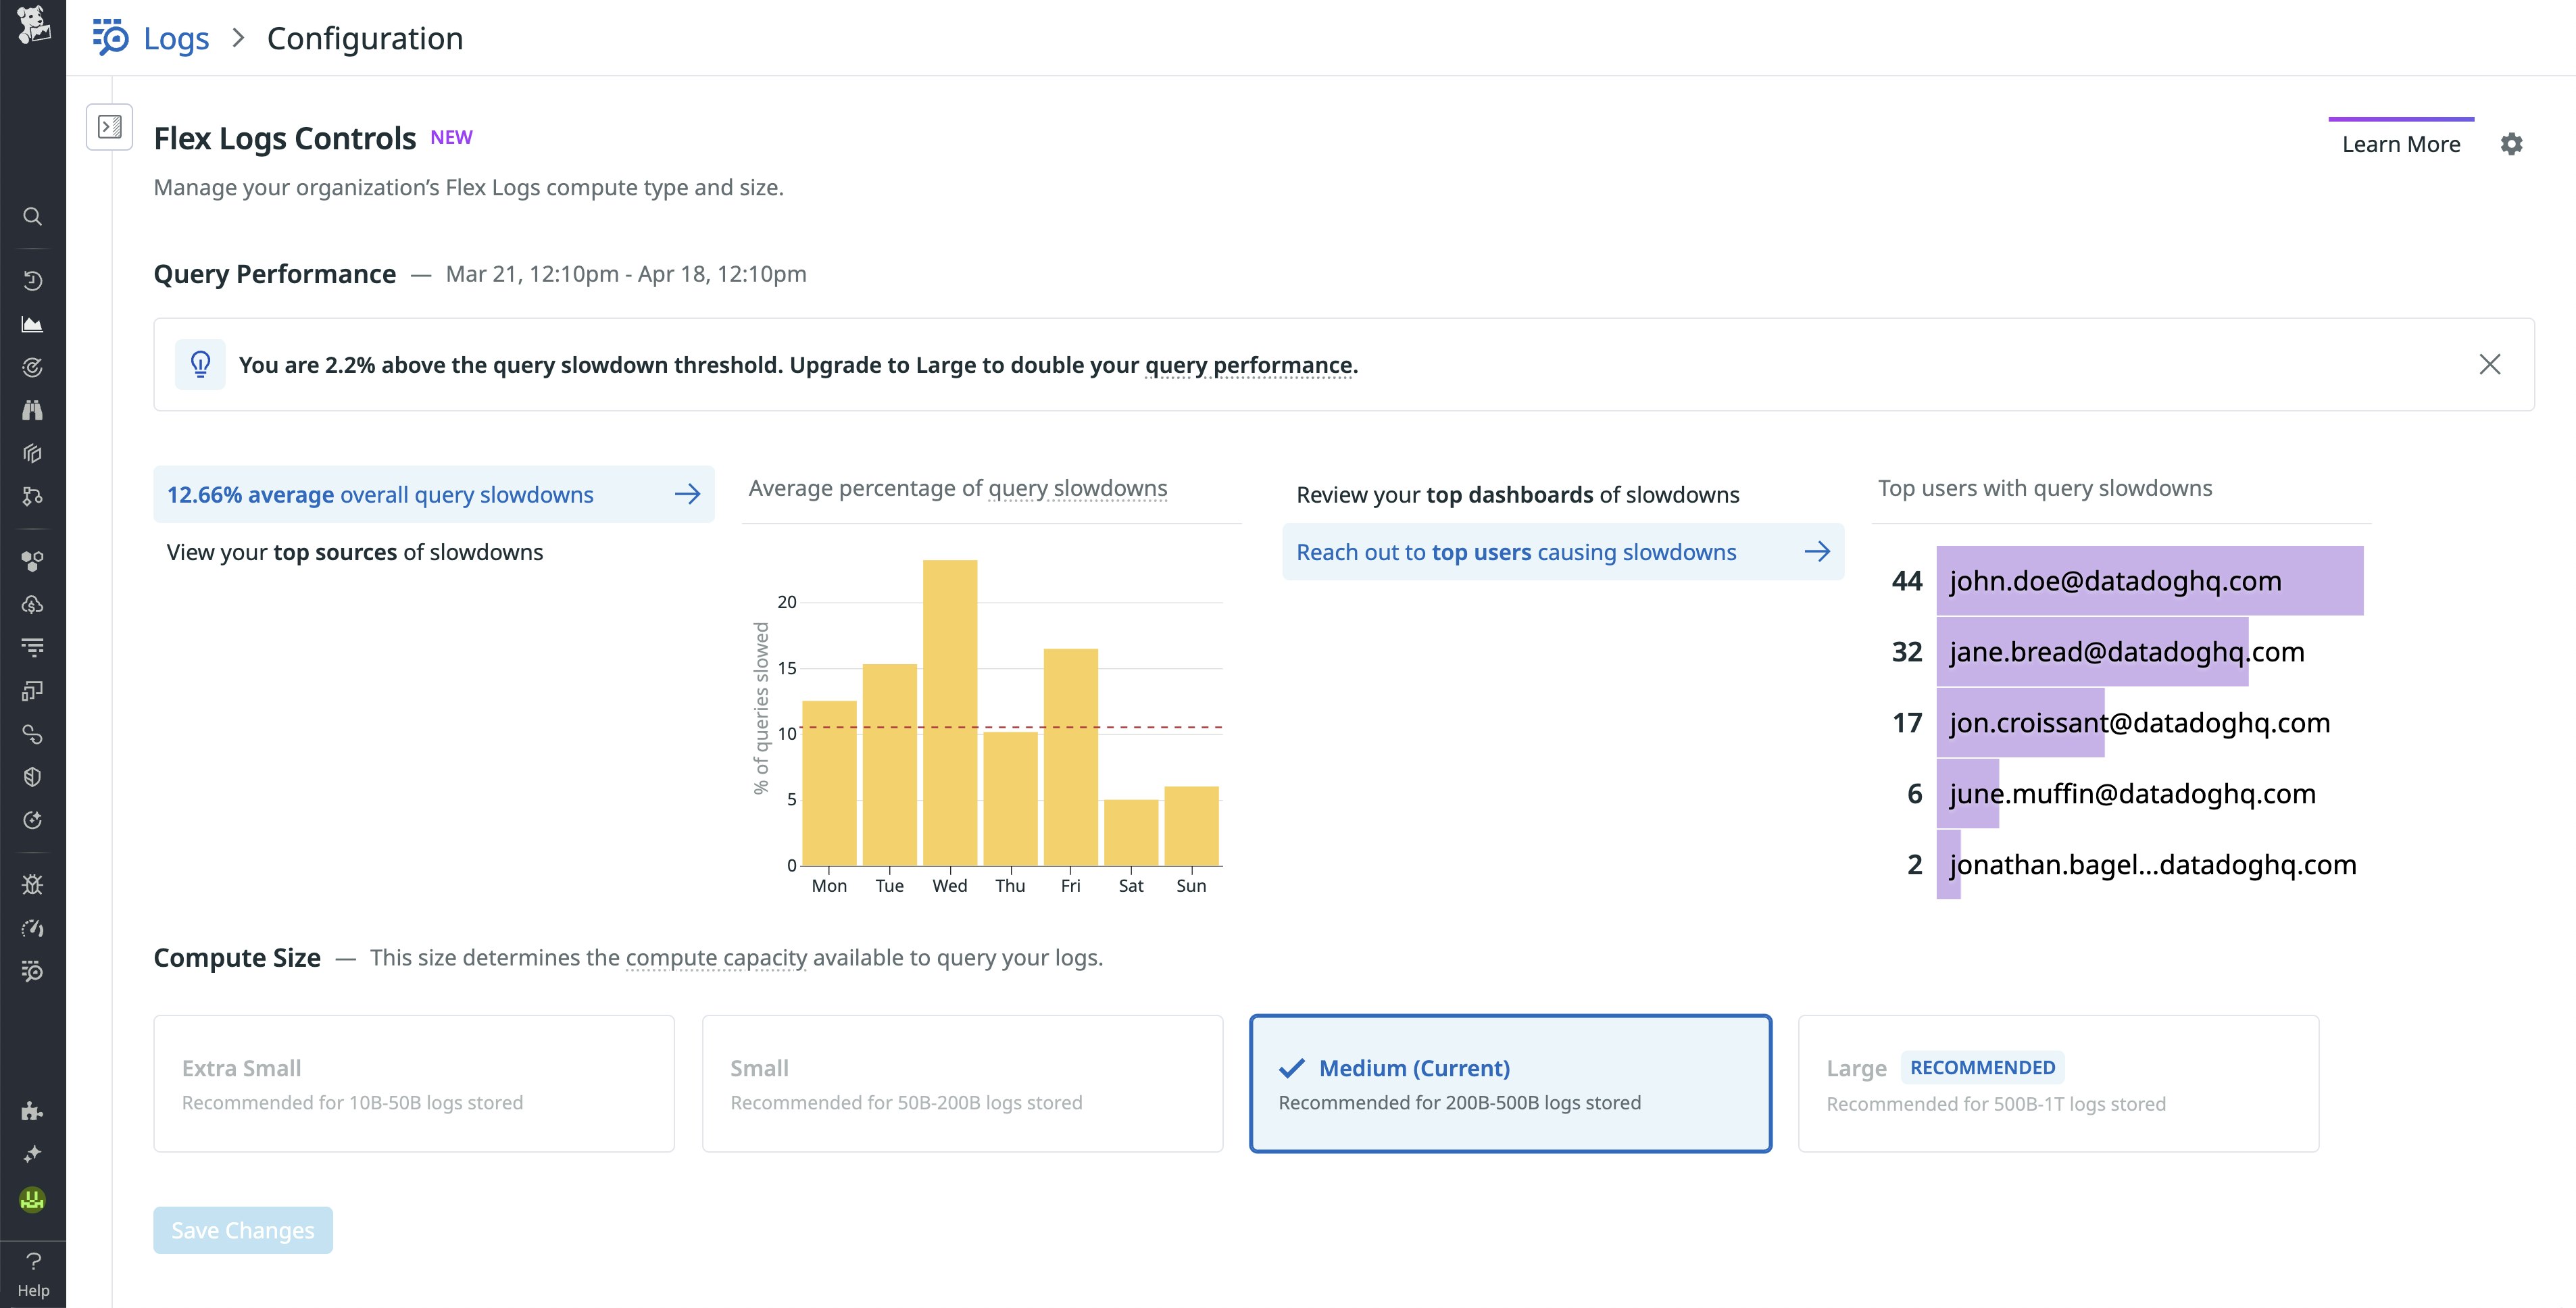
Monitor and optimize your Flex Logs compute usage
Datadog’s Flex Logs now includes compute usage visualizations that give teams deeper insight into how their query workloads impact performance. These new graphs on the Flex Logs Controls page show when throttling occurs, which queries are affected, and who’s driving usage, making it easier to troubleshoot slowdowns and optimize configurations. Teams can use this data to tune dashboards, refine query behavior, or scale compute capacity as needed. With these updates, Flex Logs provides even more control over cost and performance for high-volume log workloads. Read more in our blog post.
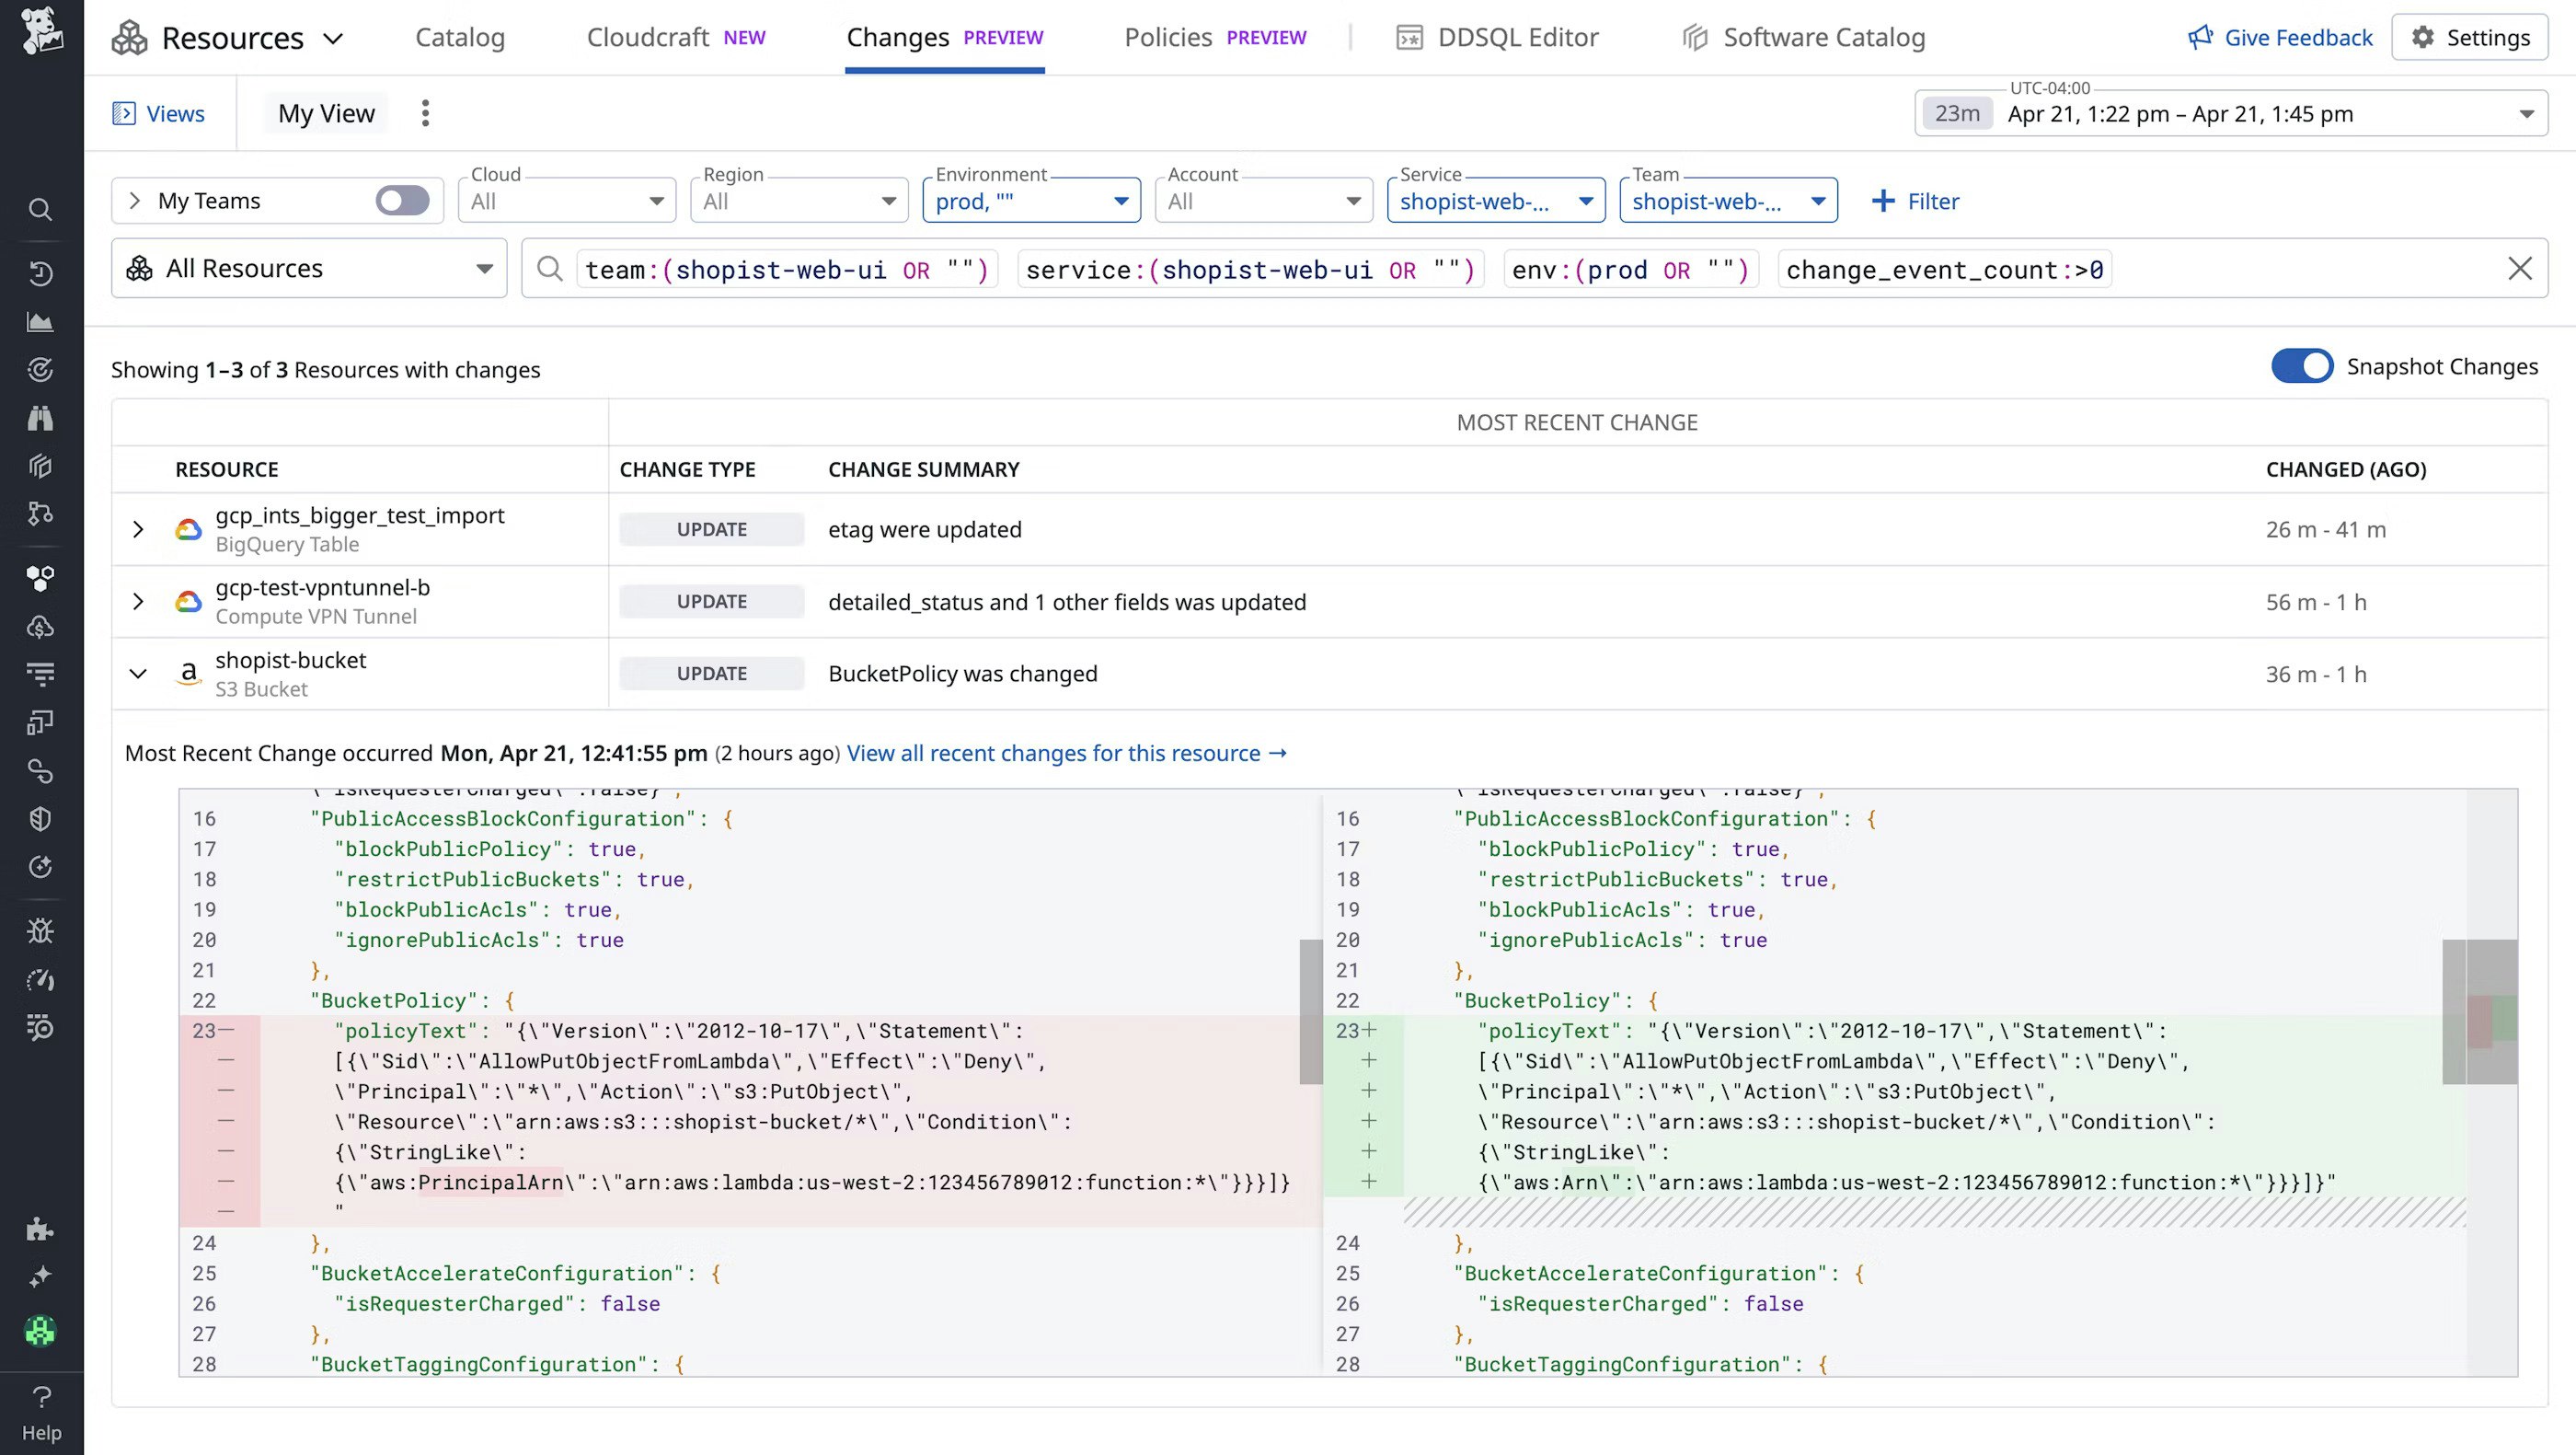
Automatically surface infra configuration changes with Resource Changes
In modern multi-cloud environments, even a small configuration change can ripple across dozens of services and make it hard to answer the key question during incidents: What changed? To address this, Datadog Resource Changes automatically surfaces infrastructure configuration changes across AWS, Google Cloud, and Azure cloud resources into your existing workflows.
When a monitor alerts, you are linked directly to the Resource Changes page carrying over the incident context from the alert, such as the relevant time frame and associated tags. When you click into a resource change, you can view the configuration change history for up to one week with rich side-by-side differences in configurations as well as related change logs. This centralized page for cloud resource changes makes it easier to identify probable root causes and who made the change, and take action to remediate sooner. Learn more in our blog post.
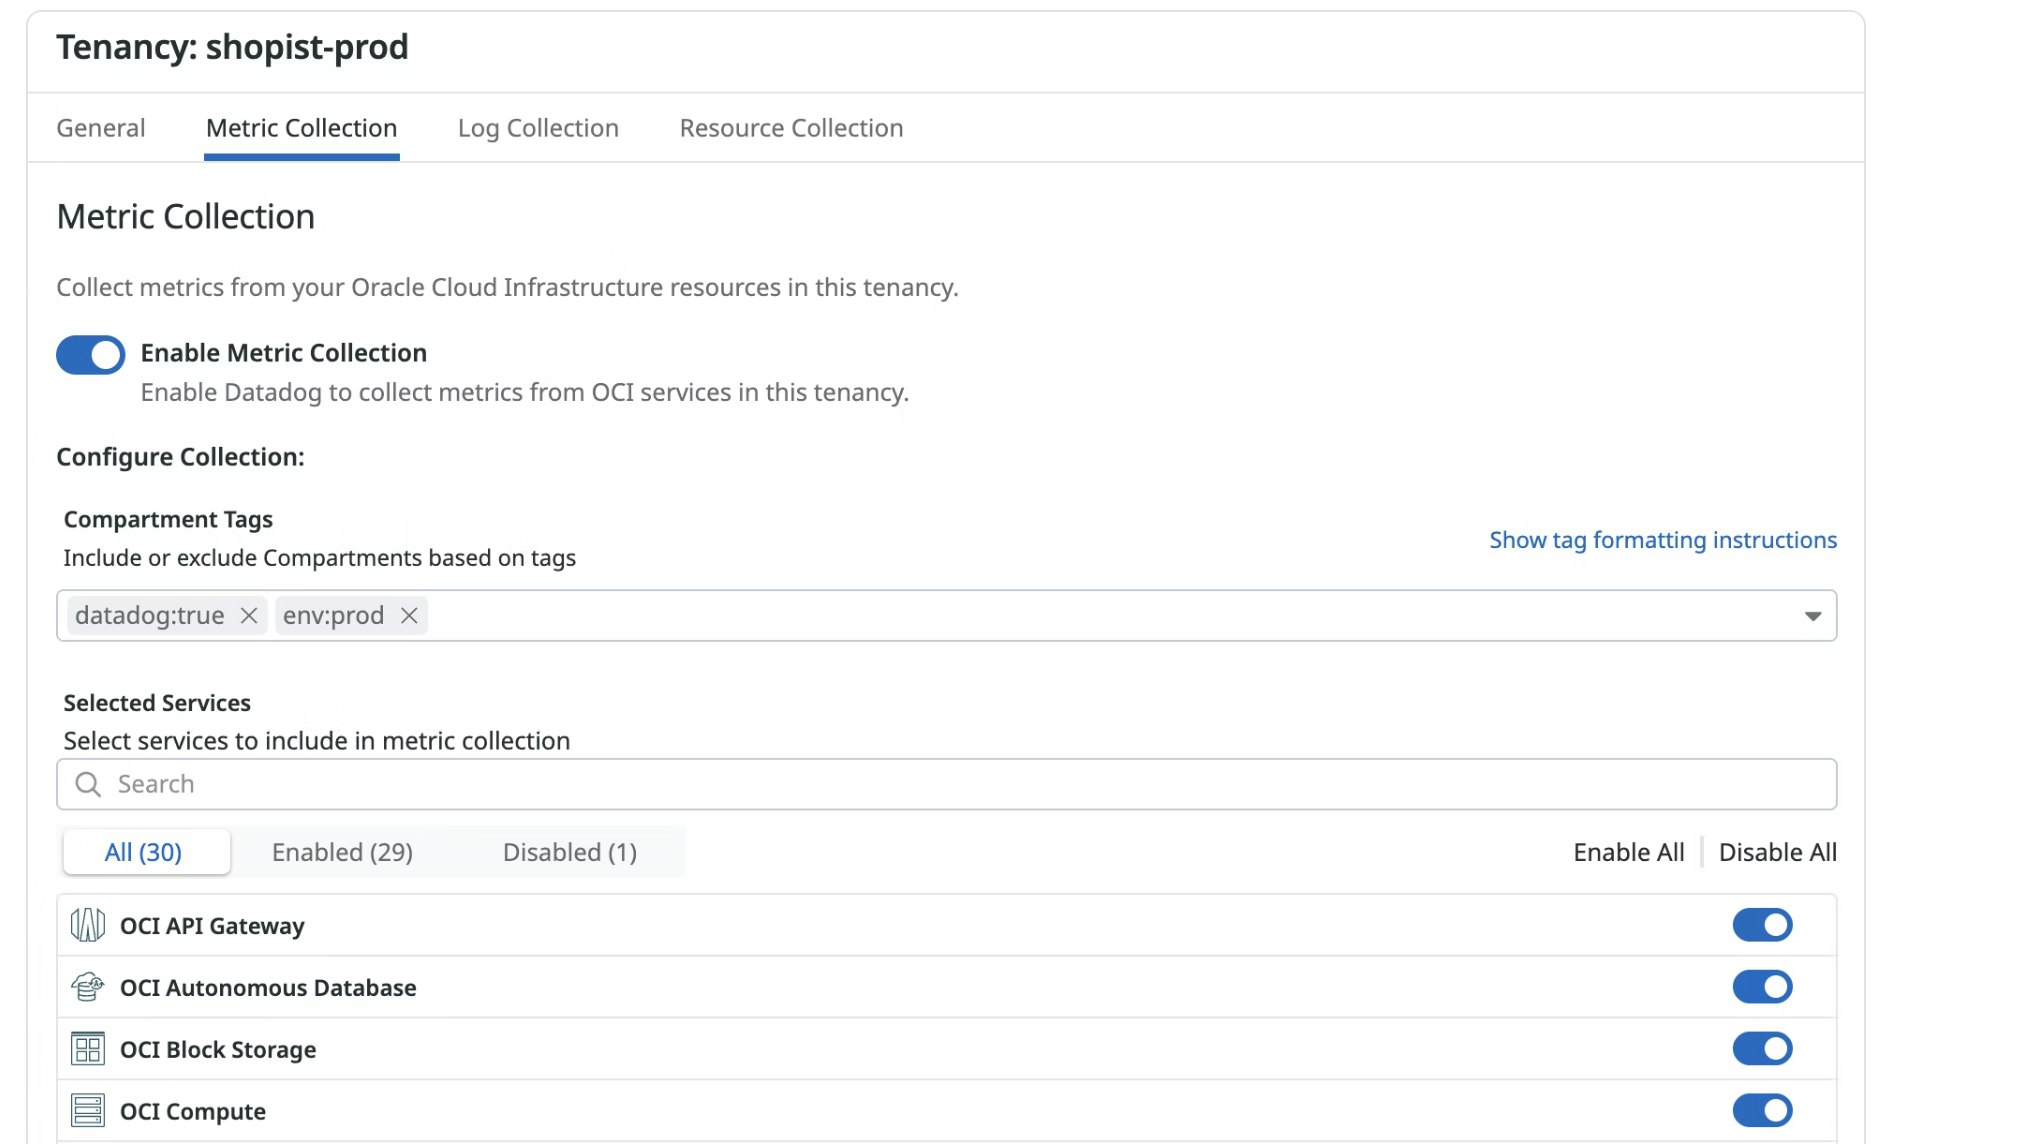
Monitor your entire OCI environment in minutes with Datadog’s fully automated QuickStart setup
Datadog’s new Oracle CIoud Infrastructure (OCI) QuickStart offers a fast, fully managed way to monitor your entire OCI environment in just a few clicks. With built-in support for metrics, logs, and more than 30 OCI services, QuickStart gives you immediate, unified visibility across your infrastructure. It automatically discovers and monitors new resources and compartments as your cloud environment evolves. You can also collect detailed resource metadata for deeper context in the Resource Catalog, helping accelerate troubleshooting and improve operational efficiency.
The new OCI QuickStart is available in Preview. To get started, request access today. To learn more, read our blog post. Visit the integration documentation or the OCI tile in your Datadog account for more resources.
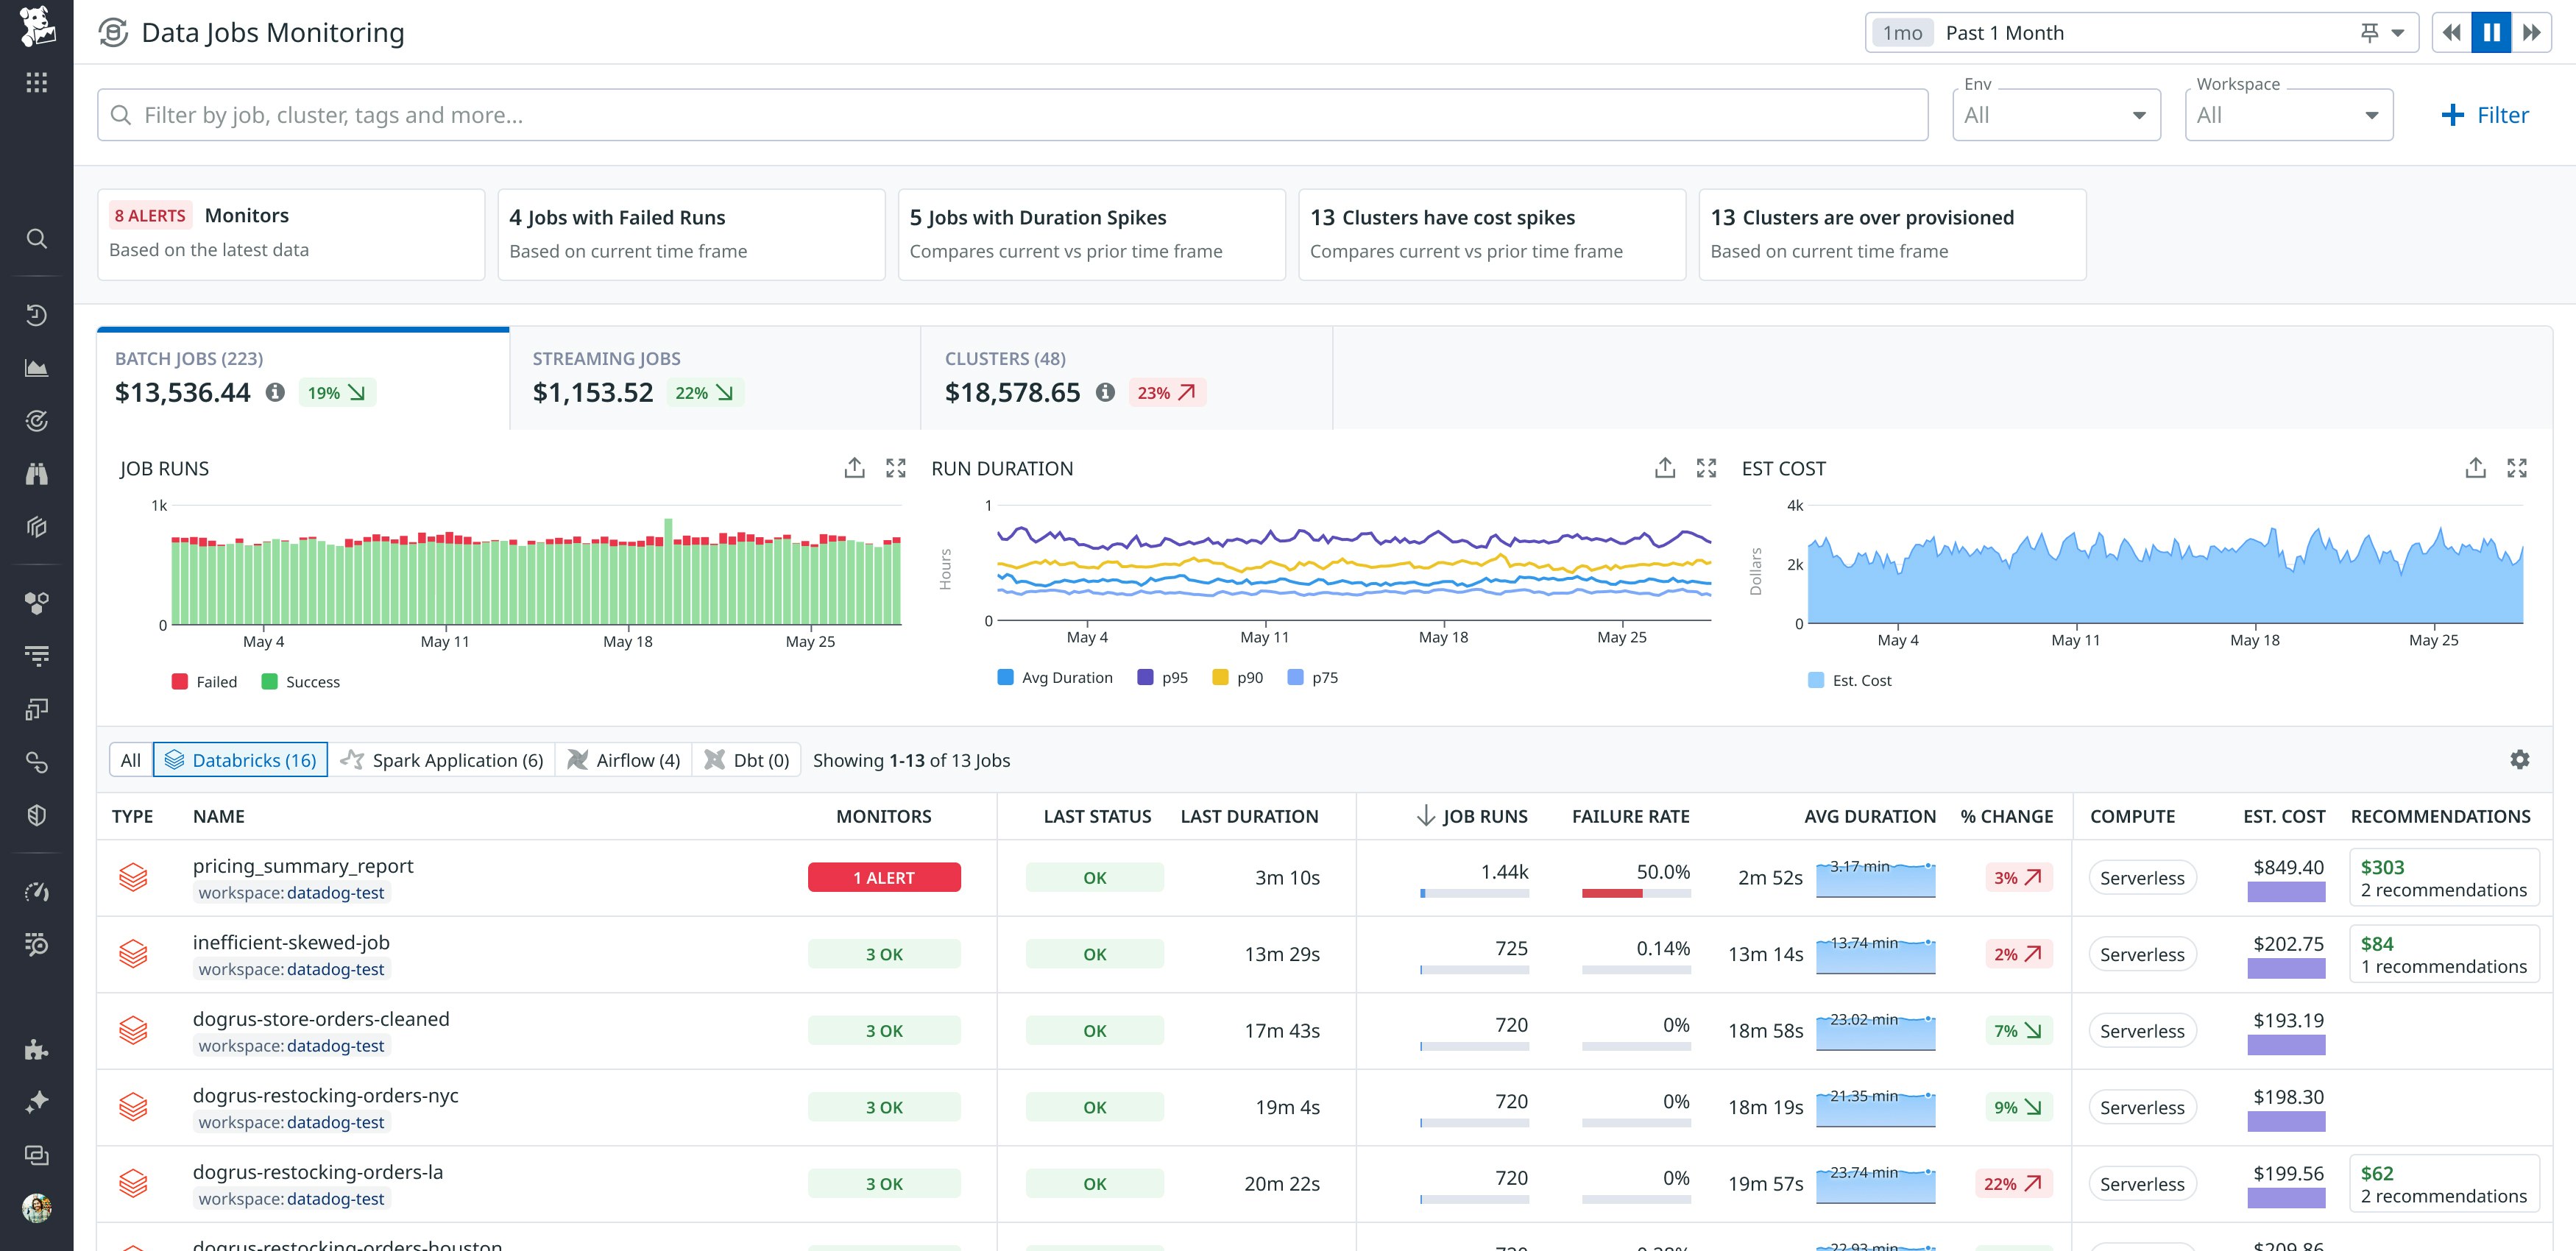
Track and optimize Databricks serverless jobs with Data Jobs Monitoring
Databricks serverless compute offers faster startup times and simplified infrastructure management for Databricks workloads, driving widespread adoption among teams looking to improve performance and reduce costs. Unlike traditional clusters that require host-level monitoring, serverless workloads demand observability focused on job-level performance, efficiency, and cost. Datadog now supports monitoring for Databricks serverless jobs—including serverless SQL warehouses—directly within Data Jobs Monitoring (DJM). This lets teams track latency, errors, and usage trends across both serverless and cluster-based jobs in one unified view, helping them optimize processing pipelines without sacrificing visibility. To learn more, check out our dedicated blog post.
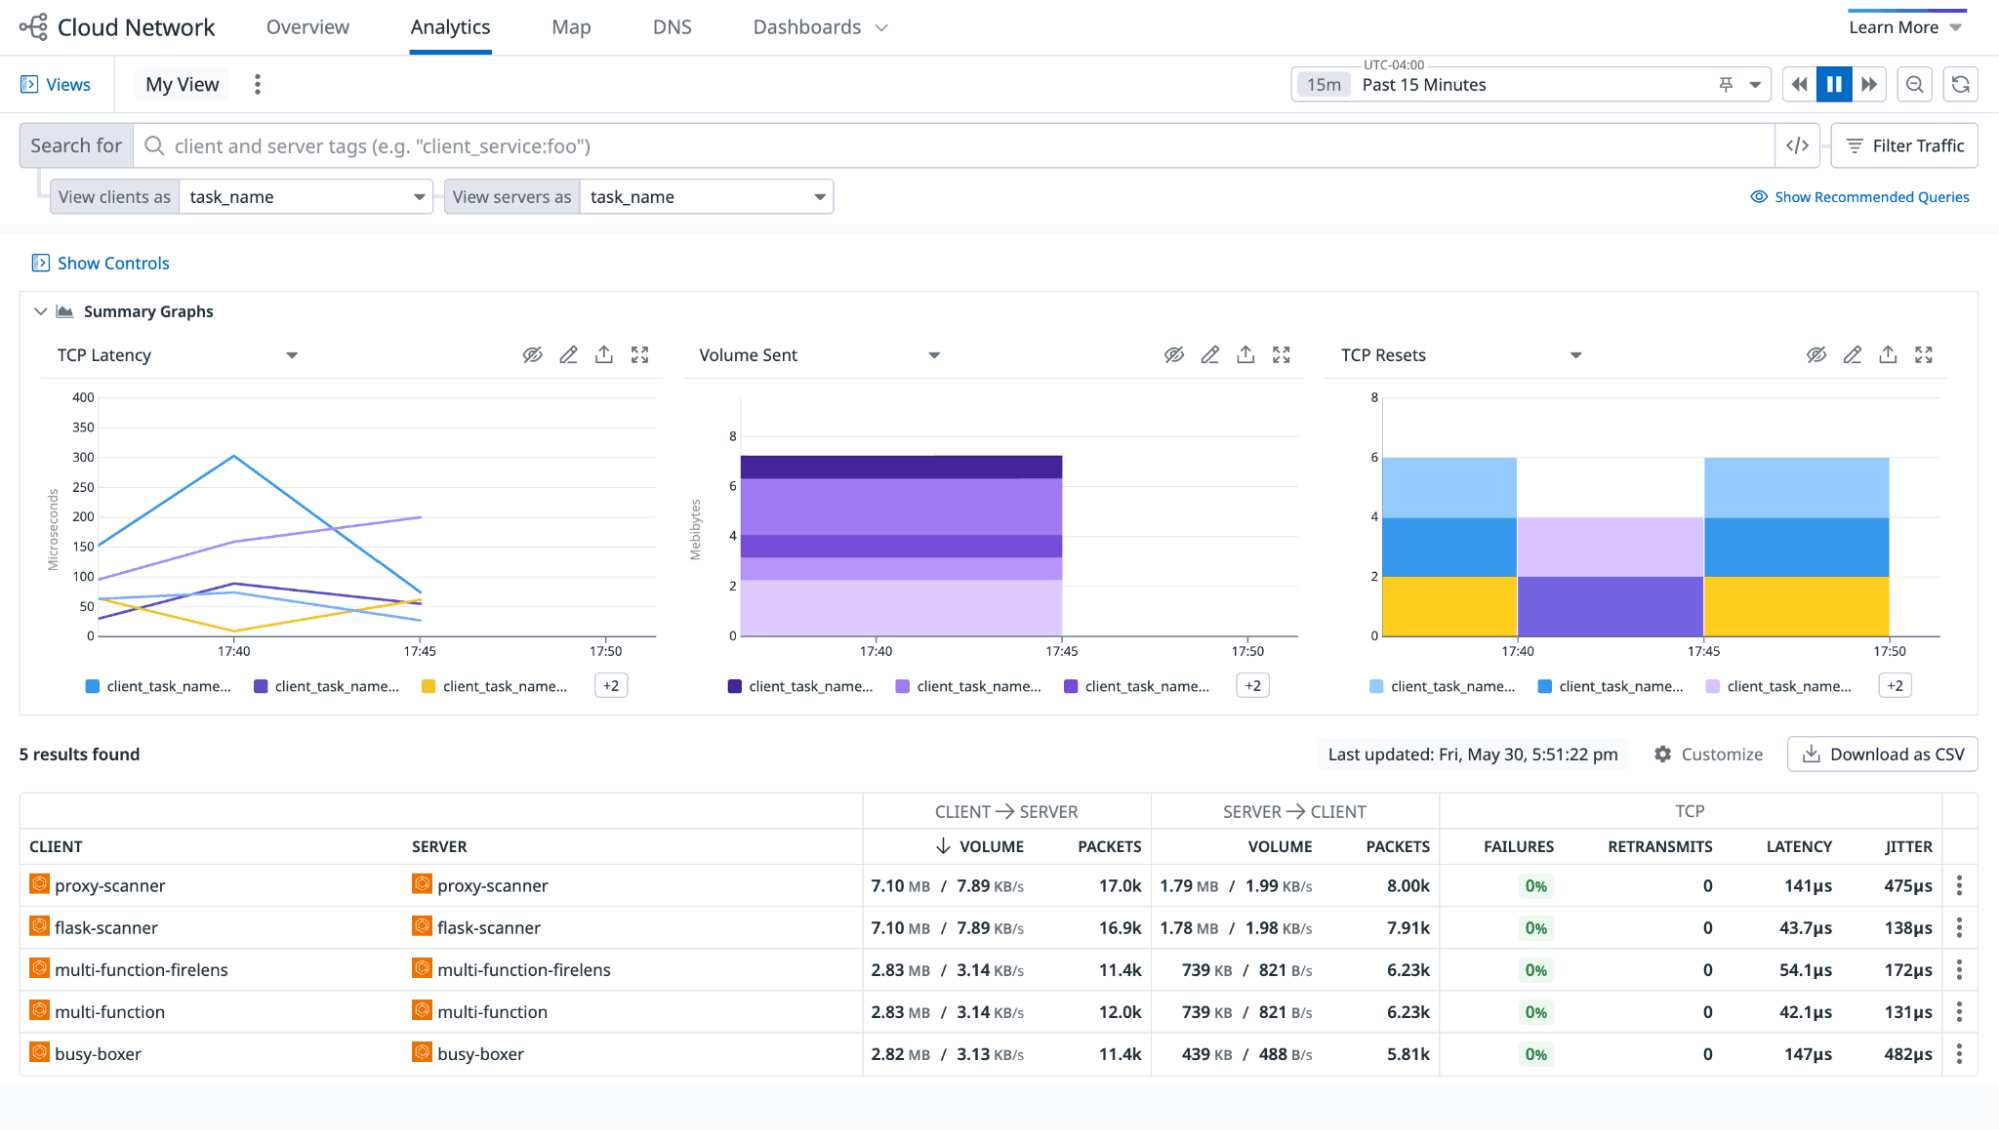
Monitor network activity for ECS Fargate tasks with Cloud Network Monitoring
Visibility into network health for workloads running on serverless platforms like ECS Fargate can be challenging, since your team does not manage the associated infrastructure. Datadog Cloud Network Monitoring (CNM) now supports ECS Fargate tasks, enabling you to collect all the valuable network metrics between these tasks, as well as from Fargate to any other entity, such as domains, hosts, or services. With network metrics like failed TCP connection count, retransmits, and latency, you can easily identify if the network is at fault between your Fargate tasks. See our documentation to get started.
Structure, visualize, and explore your data
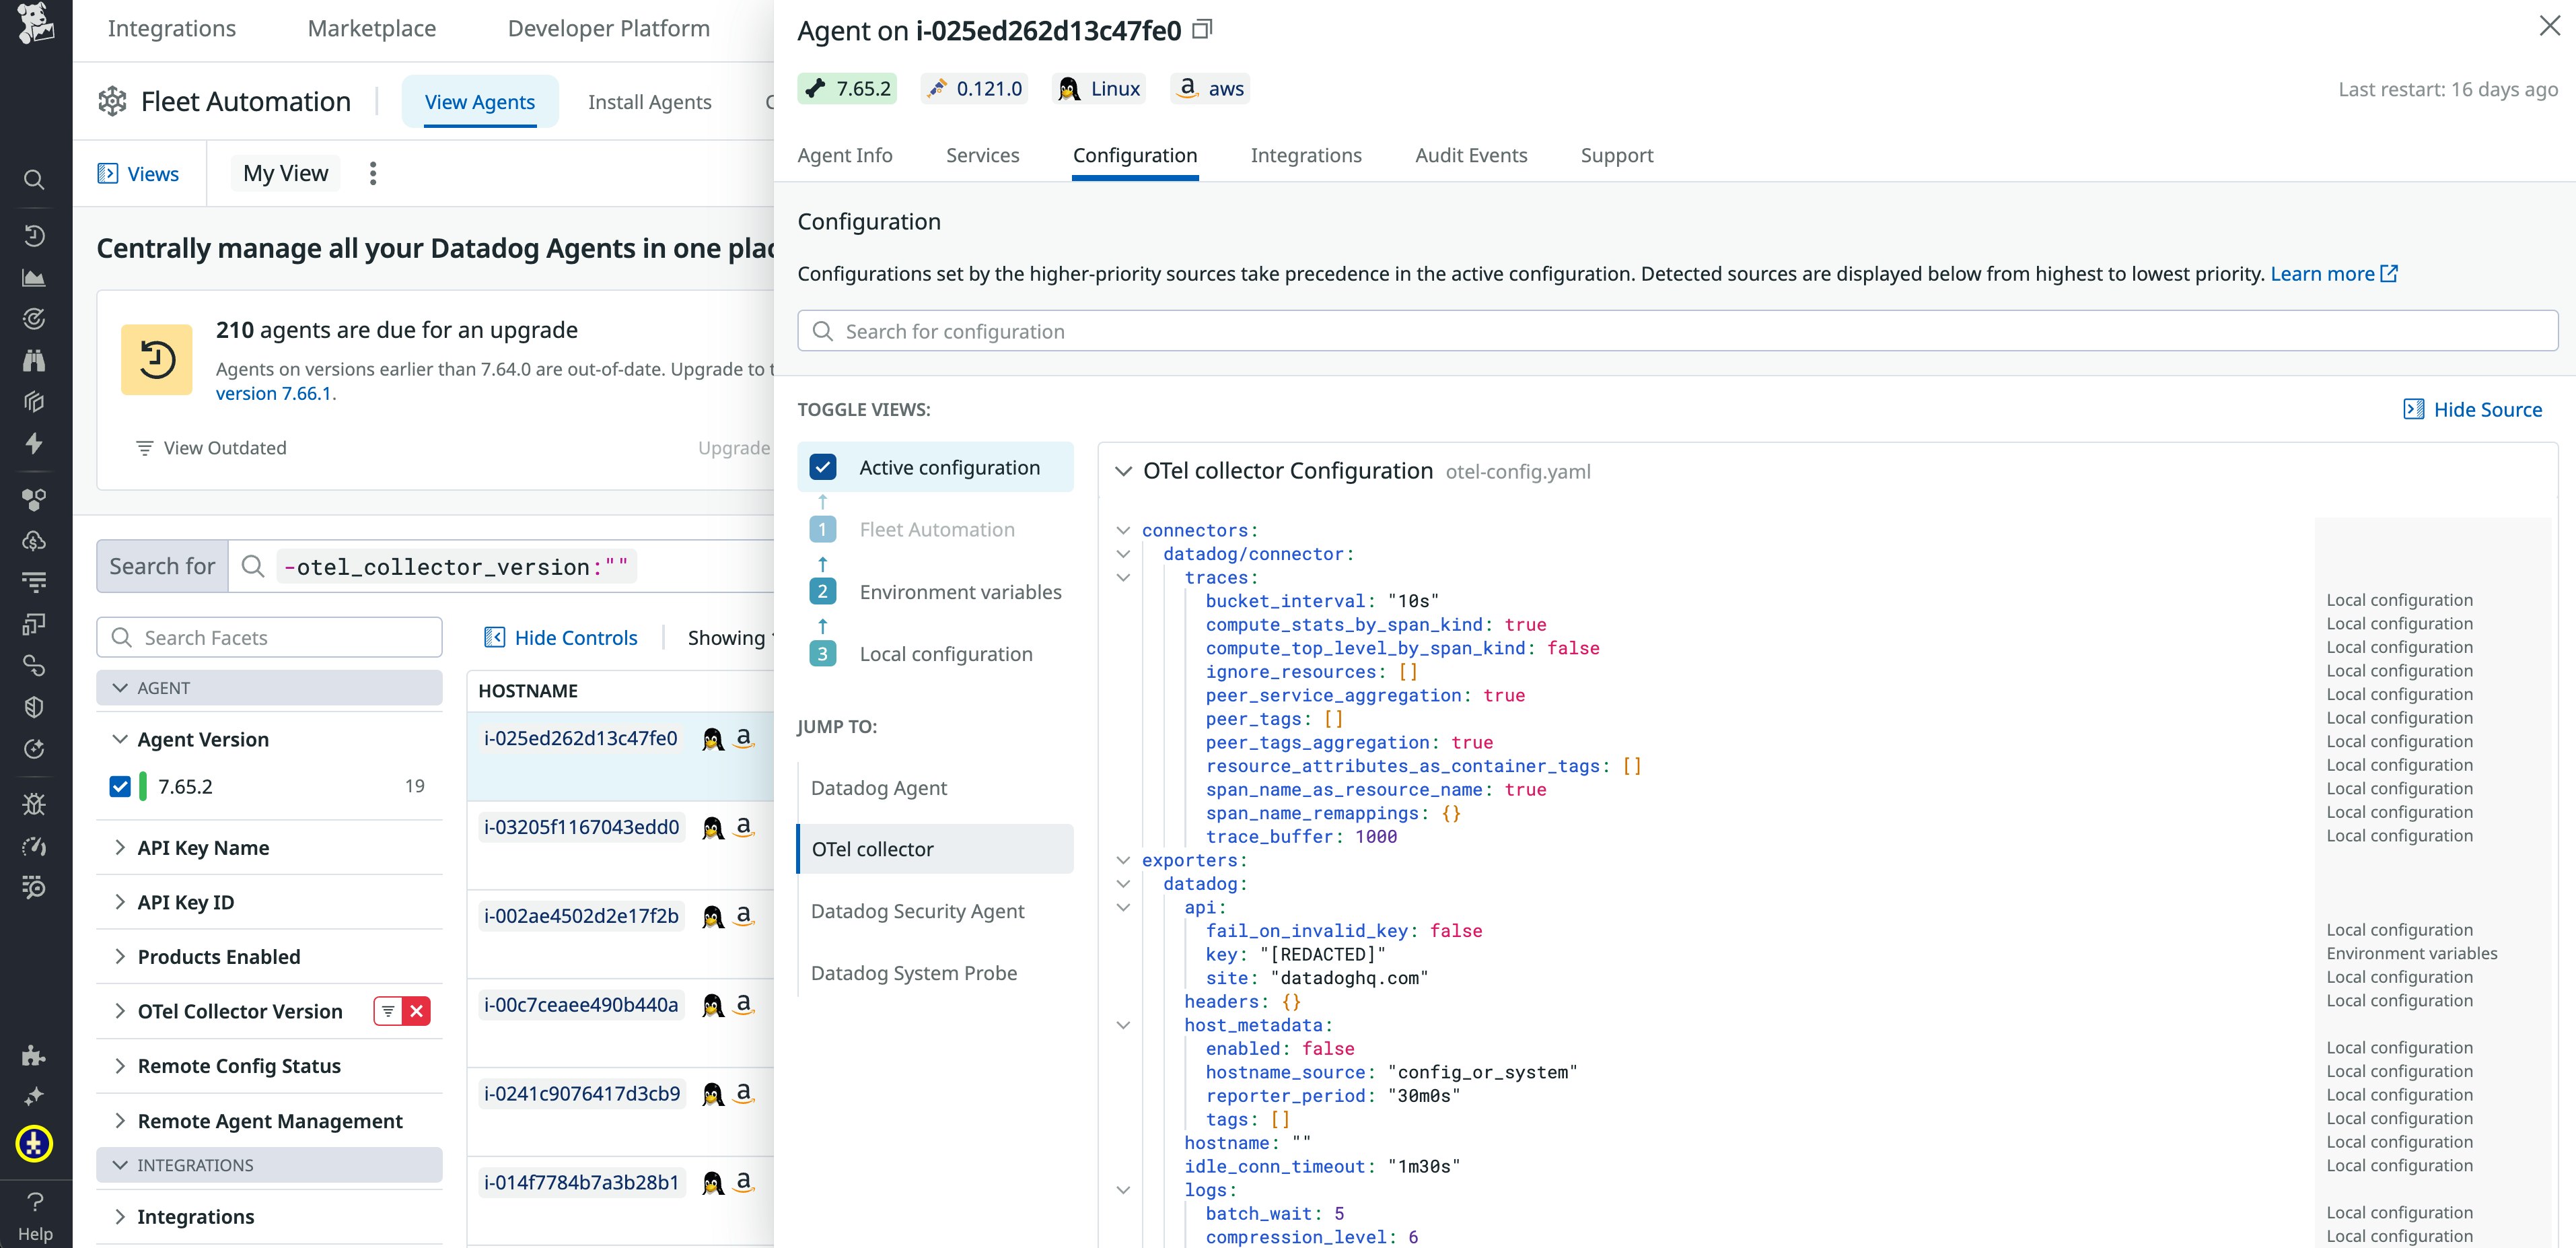
Unify OpenTelemetry and Datadog with the Datadog Distribution of the OTel (DDOT) Collector
OpenTelemetry (OTel) provides a standardized, open source framework for collecting and exporting telemetry data—such as traces, metrics, and logs—in a vendor-neutral format across distributed systems. The Datadog Distribution of the OTel Collector (DDOT Collector) combines OTel’s flexibility with Datadog’s advanced observability, security, and automation features directly into the Datadog Agent. With support for native OTLP configurations, the DDOT Collector allows users to easily process telemetry data and extend observability capabilities with custom OTel components. The DDOT Collector simplifies operational overhead, enabling scalable management and fast issue resolution within Datadog’s monitoring ecosystem. Learn more by reading our blog post and visiting our documentation.
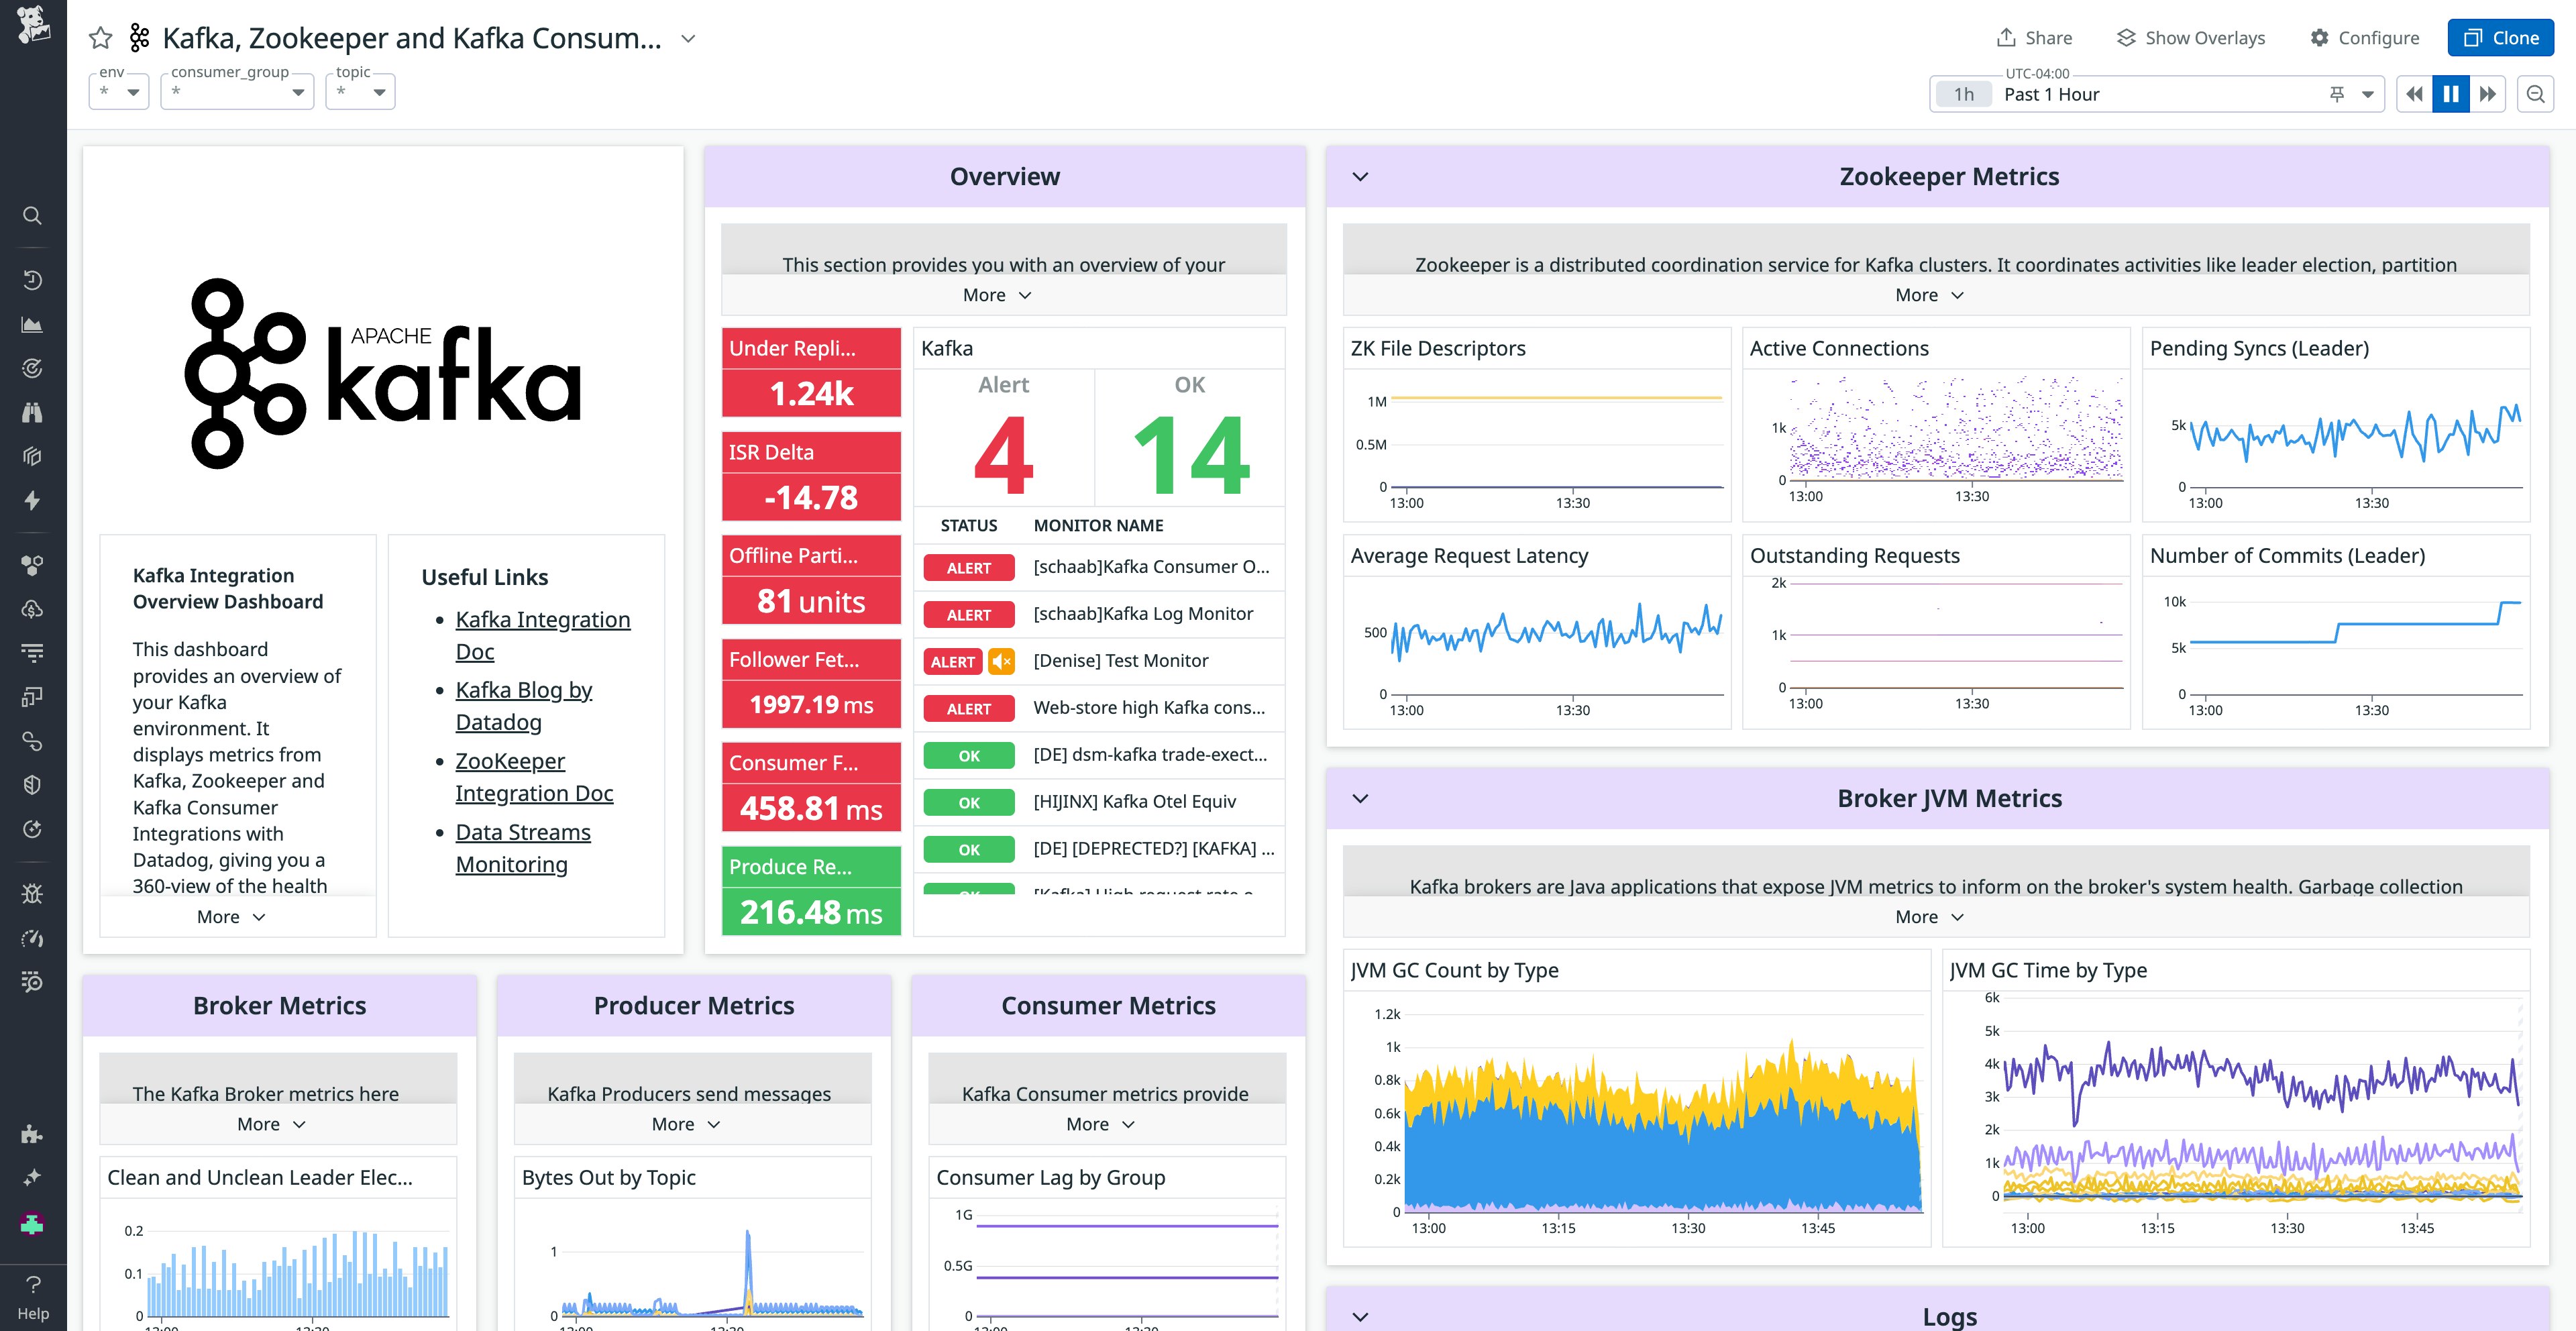
Power the Datadog platform with OpenTelemetry-native semantics
OpenTelemetry (OTel) is emerging as the industry standard for collecting and transmitting observability data. Datadog supports several ways to send and accept OTel-native data, while also continuing to support its own native telemetry format. To provide a consistent monitoring experience, Datadog now supports using OTel-native metrics right alongside Datadog-native metrics across dashboards, queries, and core visualizations in Datadog. You can now view OTel-native metrics in out-of-the-box (OOTB) Datadog integration dashboards with no additional configuration, and easily write your own queries to monitor across Datadog and OTel data.
This results in a unified observability experience whether you’re sending data via OpenTelemetry, the Datadog Agent, or a combination of both, and gives teams the flexibility to adopt OTel at their own pace without disrupting existing monitoring workflows. Explore compatibility between Datadog and OpenTelemetry metric semantics now by reading our blog post or signing up for the Preview.
Access all of your infrastructure data through SQL queries with DDSQL Editor
DDSQL Editor lets you access all of your infrastructure data through SQL queries. By joining your AWS, Azure, and Google Cloud tables, hosts with Datadog Agents, containers, and Kubernetes clusters, you can write queries to get answers to complex questions about your environment. For example, you can easily write queries to list all of your Java libraries across services or to count the number of hosts per Agent version and per region. In addition, you can use AI to write your queries using natural language and send queries to dashboards to visualize and report findings. Read more in our blog post and documentation.
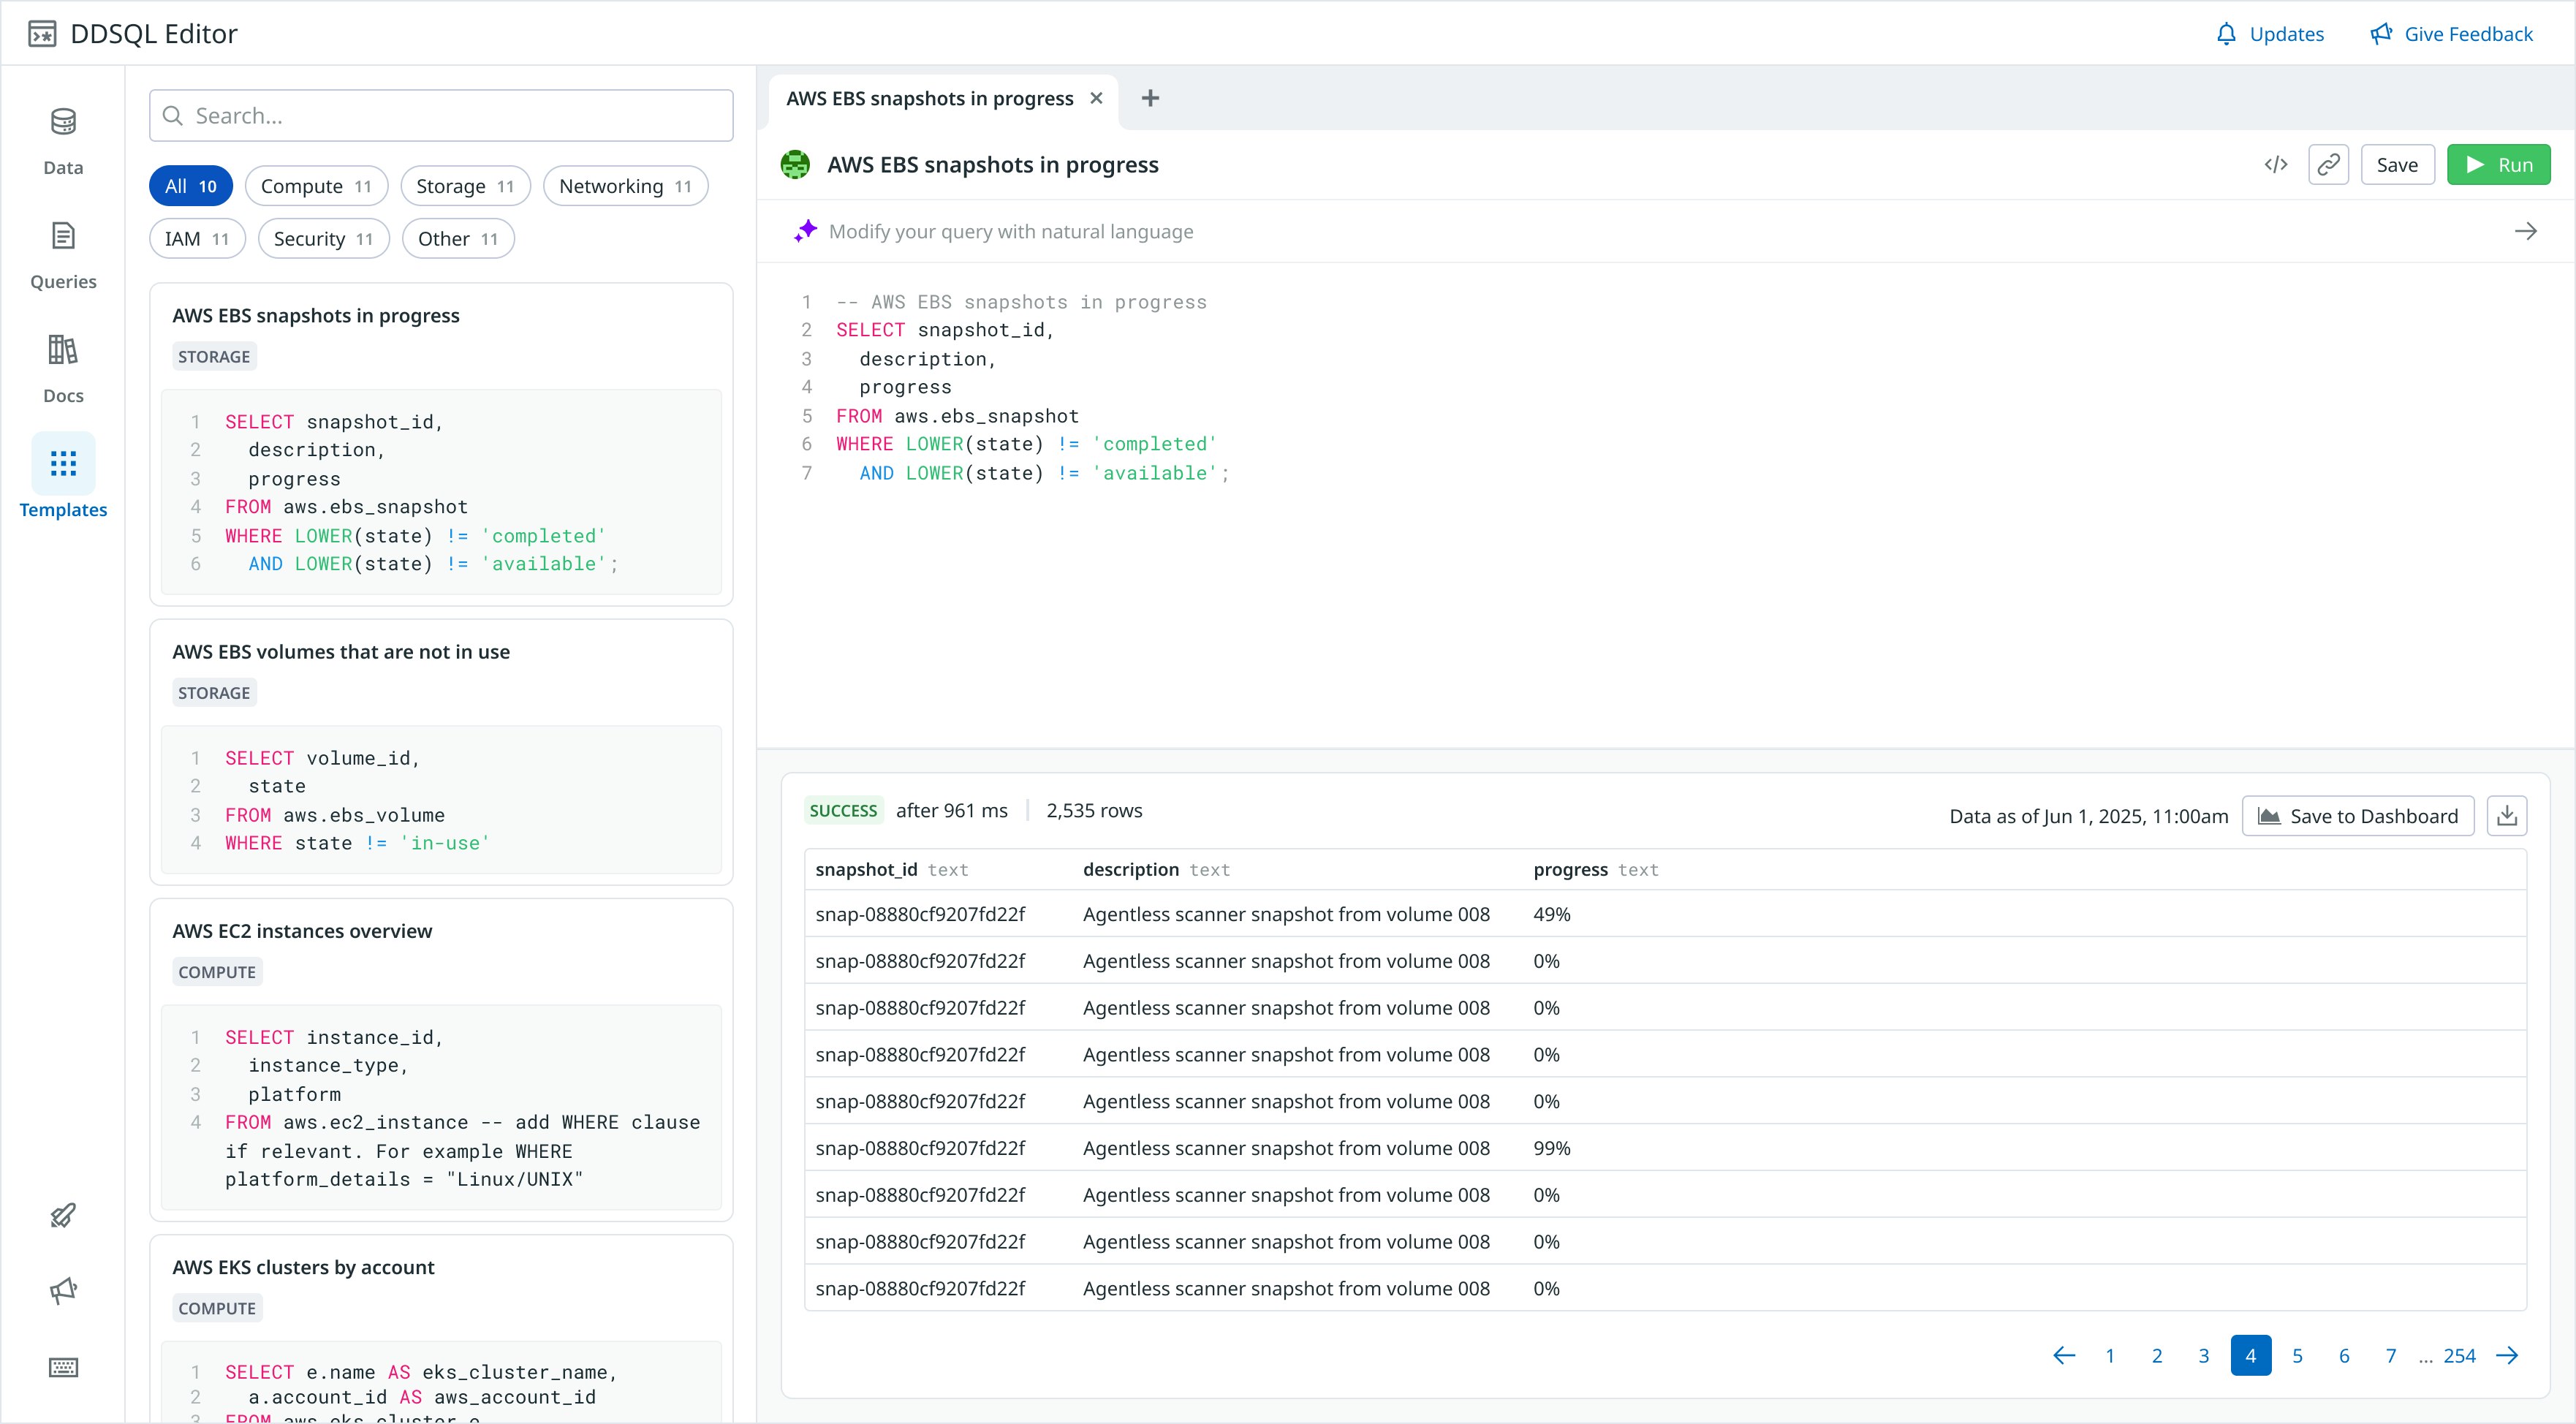
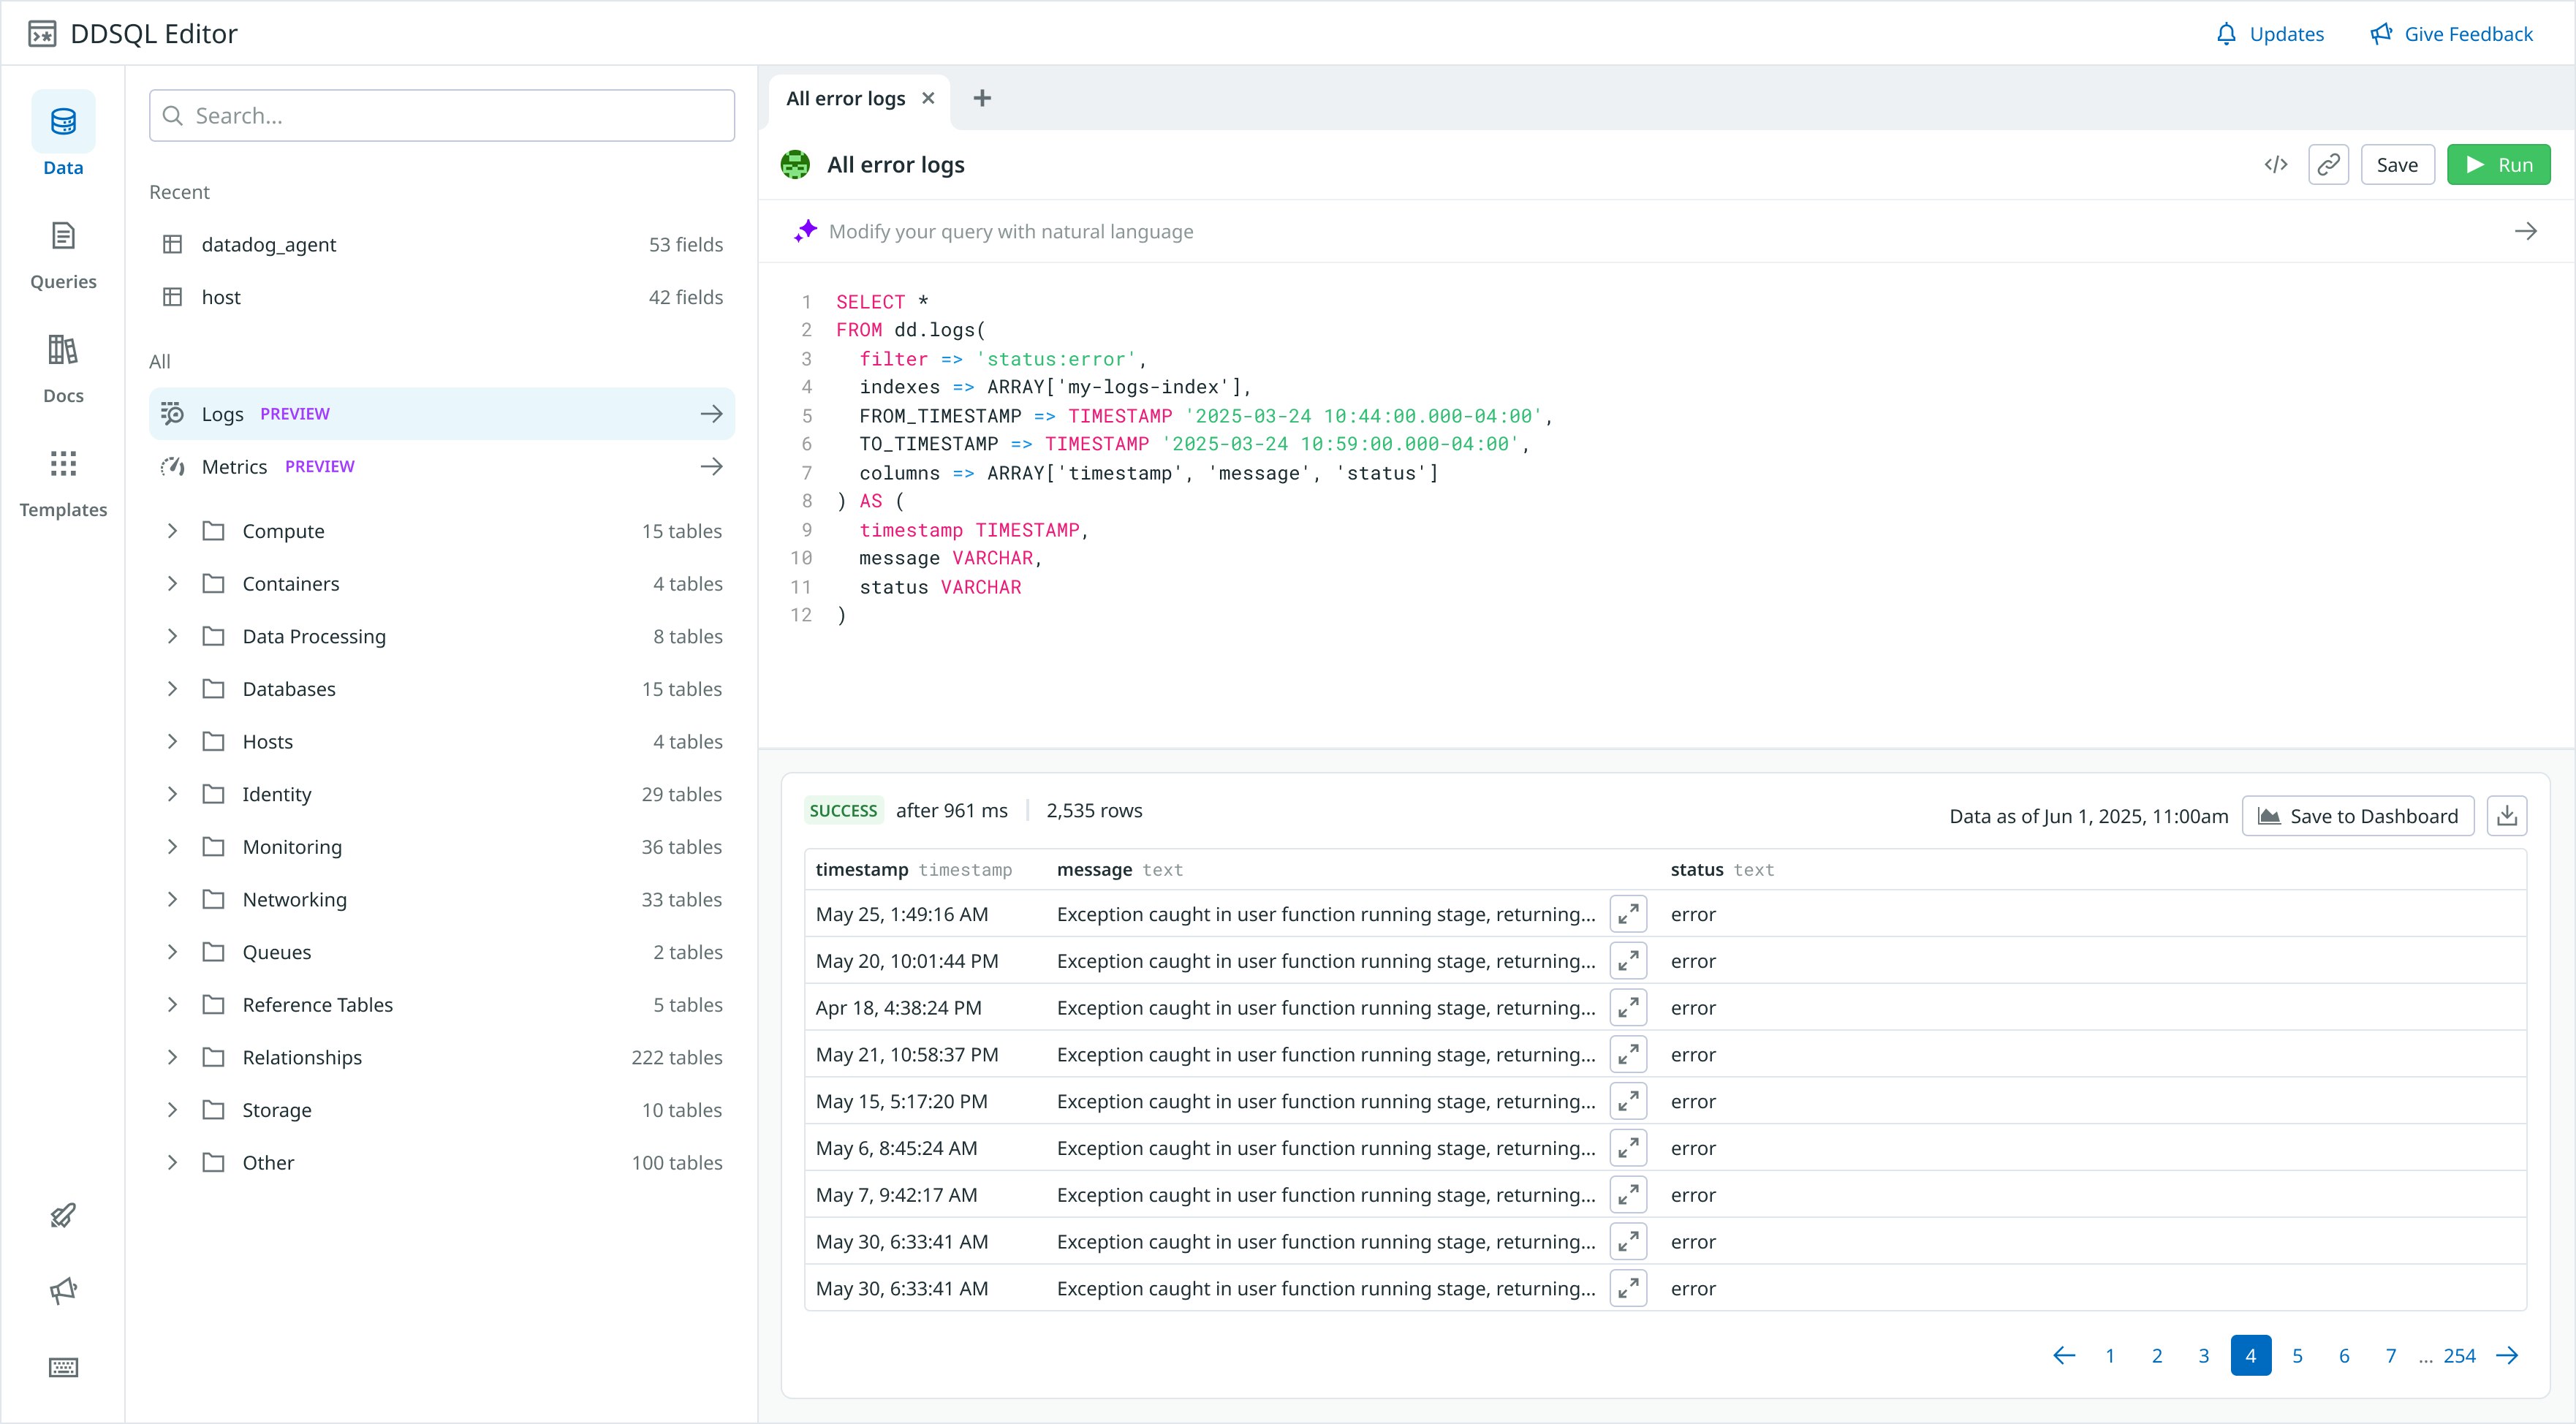
Query and join against your logs and metrics in DDSQL Editor
DDSQL Editor lets you access all of your infrastructure data through SQL queries, and now you can also query and join against your logs and scalar metrics. For example, you can join your error logs with specific containers to identify the root cause of a recent incident. By offering the ability to query logs and metrics, you can perform more complex investigations without having to context switch. You can also create visualizations to help you govern your telemetry beyond just your infrastructure. Read more in our blog post, or join our Preview by filling out this form.
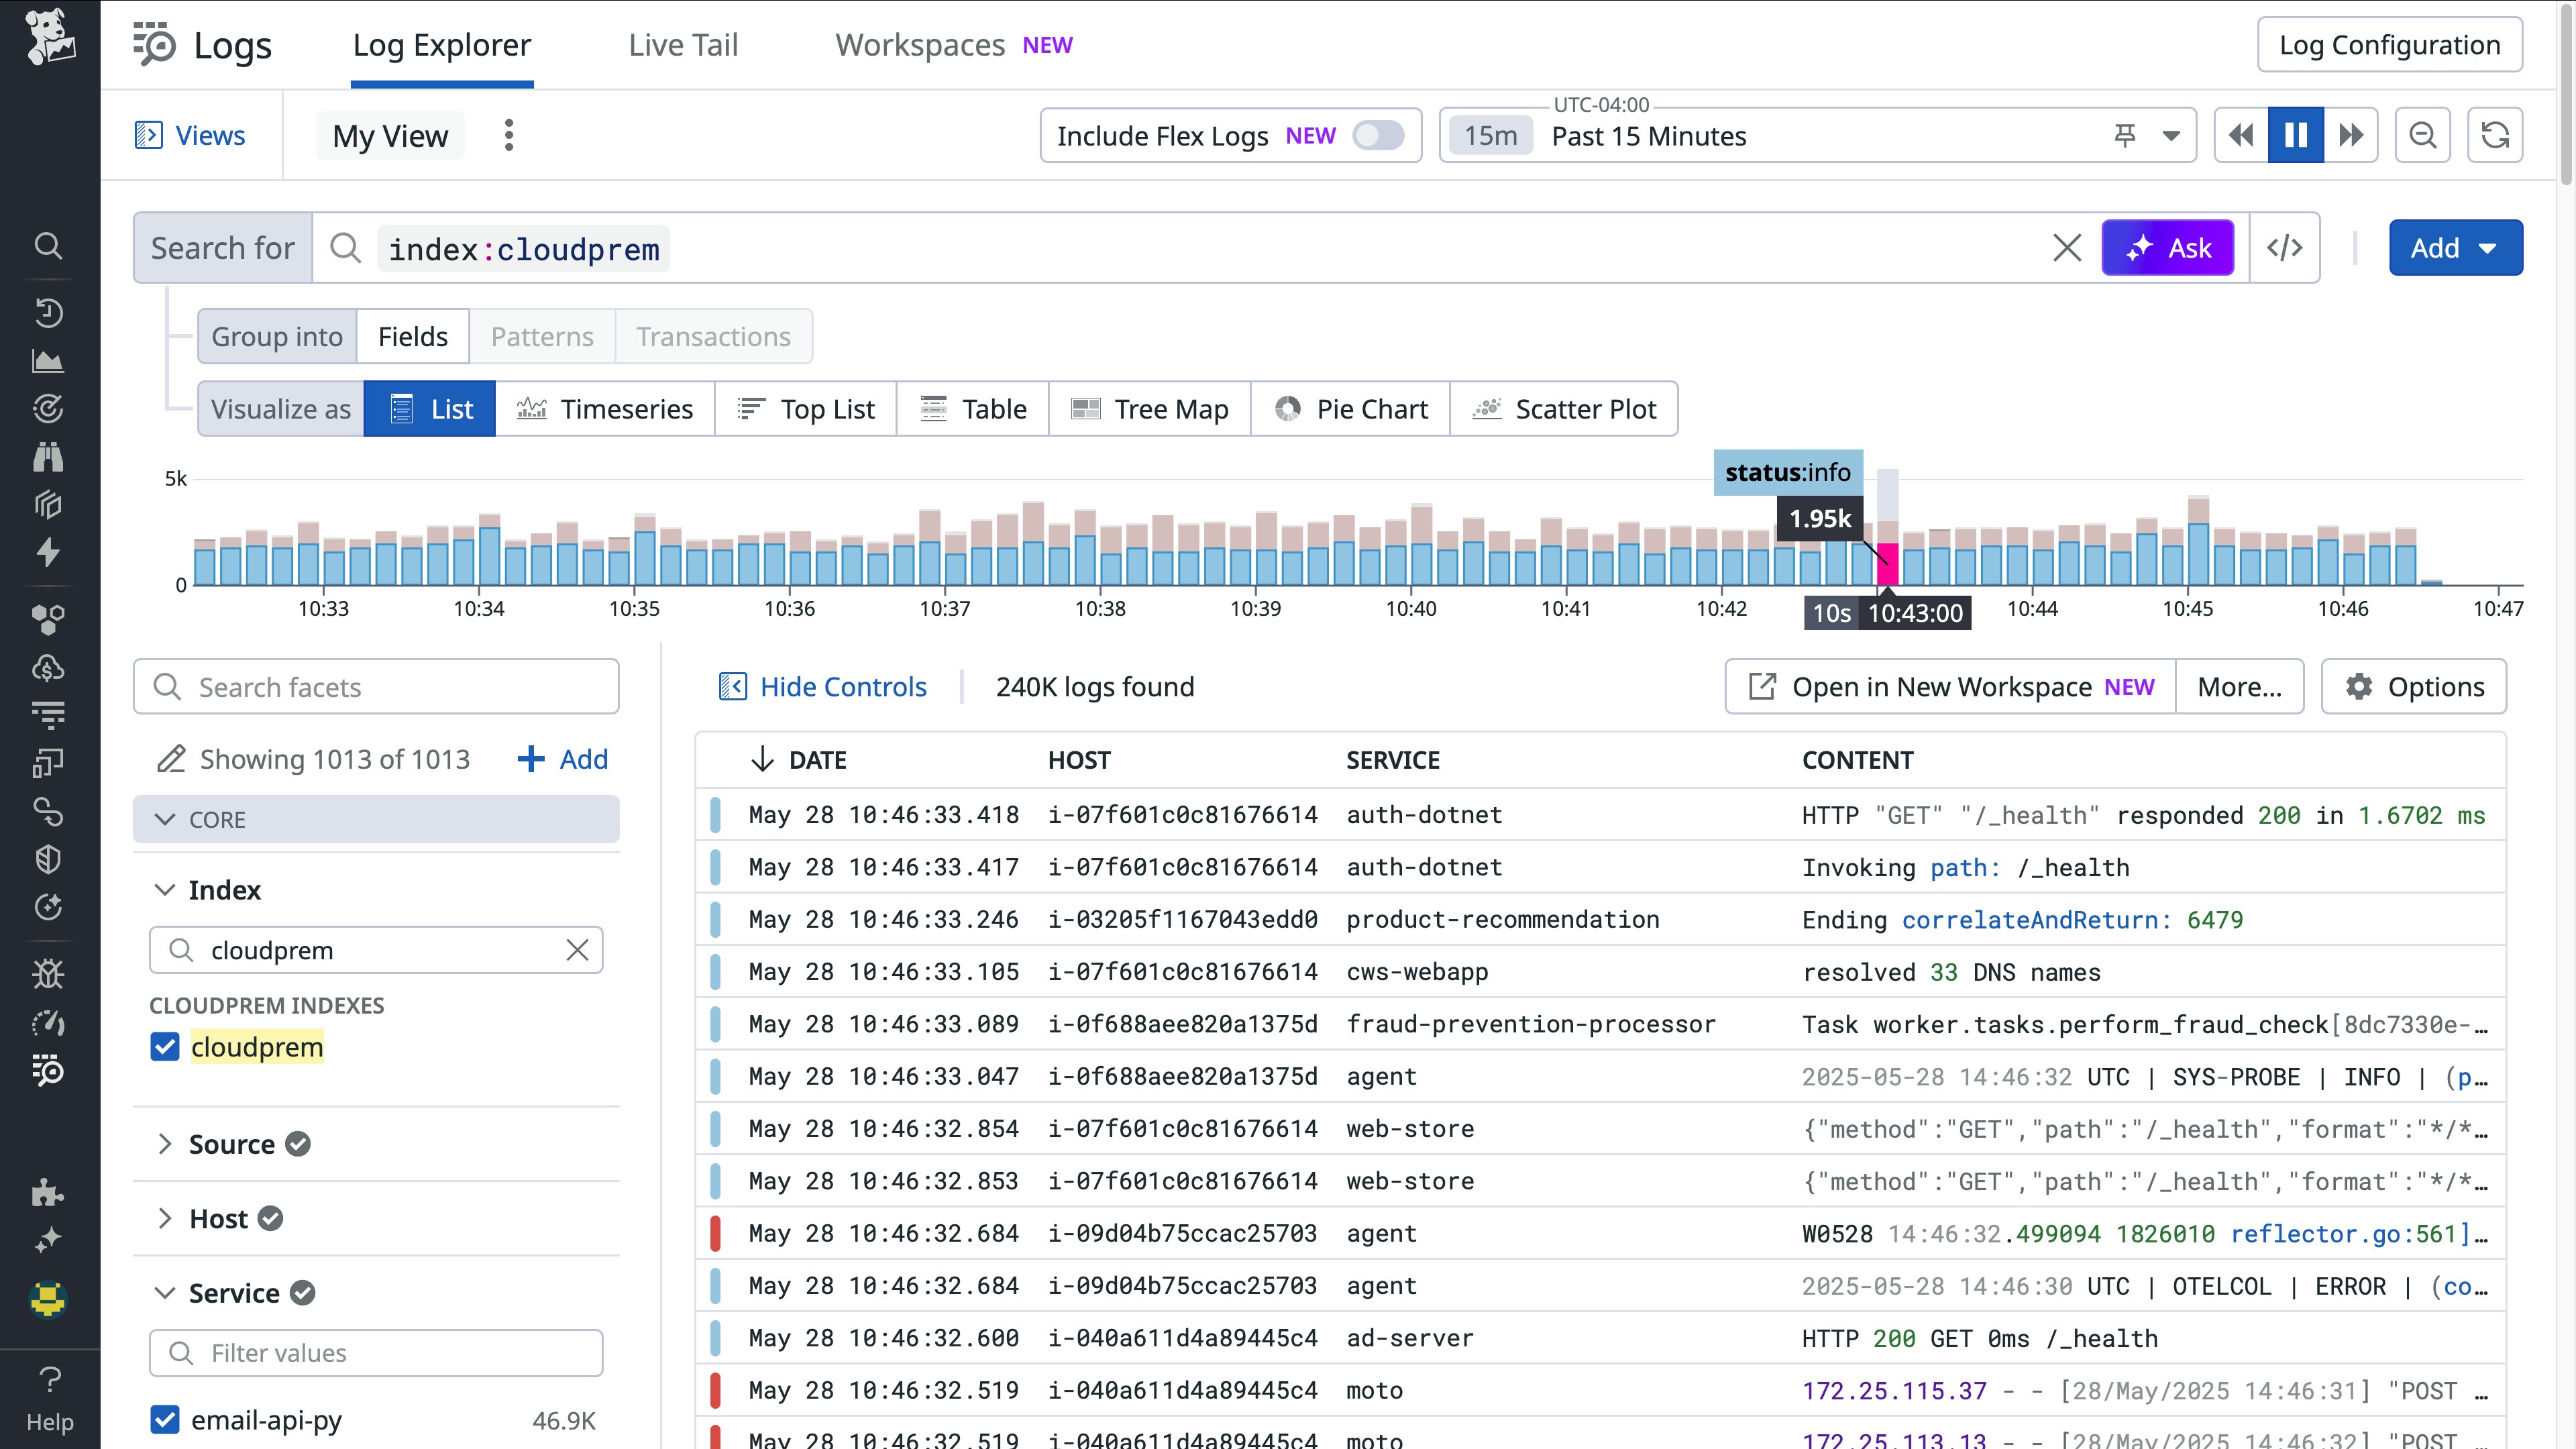
Analyze your logs using natural language
Natural Language Queries (NLQ) for logs simplifies the process of exploring and analyzing log data by allowing users to search using plain English without knowing the query syntax. By reducing the need to learn Datadog’s query language, NLQ empowers teams across the organization—including engineers, product managers, and other cross-functional teams—to quickly uncover insights from logs. This feature enhances operational efficiency by reducing time spent on query construction and enabling faster investigations. With automatic query translation, users can focus on what they’re trying to find and not how to write the query. NLQ also makes it easier for newer users to onboard and contribute to debugging and troubleshooting workflows right away. To learn more, read our documentation.
Search and analyze logs stored in your environment with Datadog CloudPrem
As global data regulations become more stringent, organizations are increasingly required to keep log data within the environment where it was generated. This has led many teams to juggle fragmented logging tools across regions, resulting in operational complexity, higher costs, and reduced visibility. To address these challenges, Datadog is introducing CloudPrem, a hybrid log management solution that brings the full power of Datadog’s Log Management platform into your own infrastructure. By deploying Datadog CloudPrem in your cloud environment or data center, you can ingest, store, and index logs locally while continuing to query and visualize them through the Datadog UI. This enables organizations to meet data residency and compliance requirements without sacrificing usability or centralized visibility. To learn more, check out our documentation.
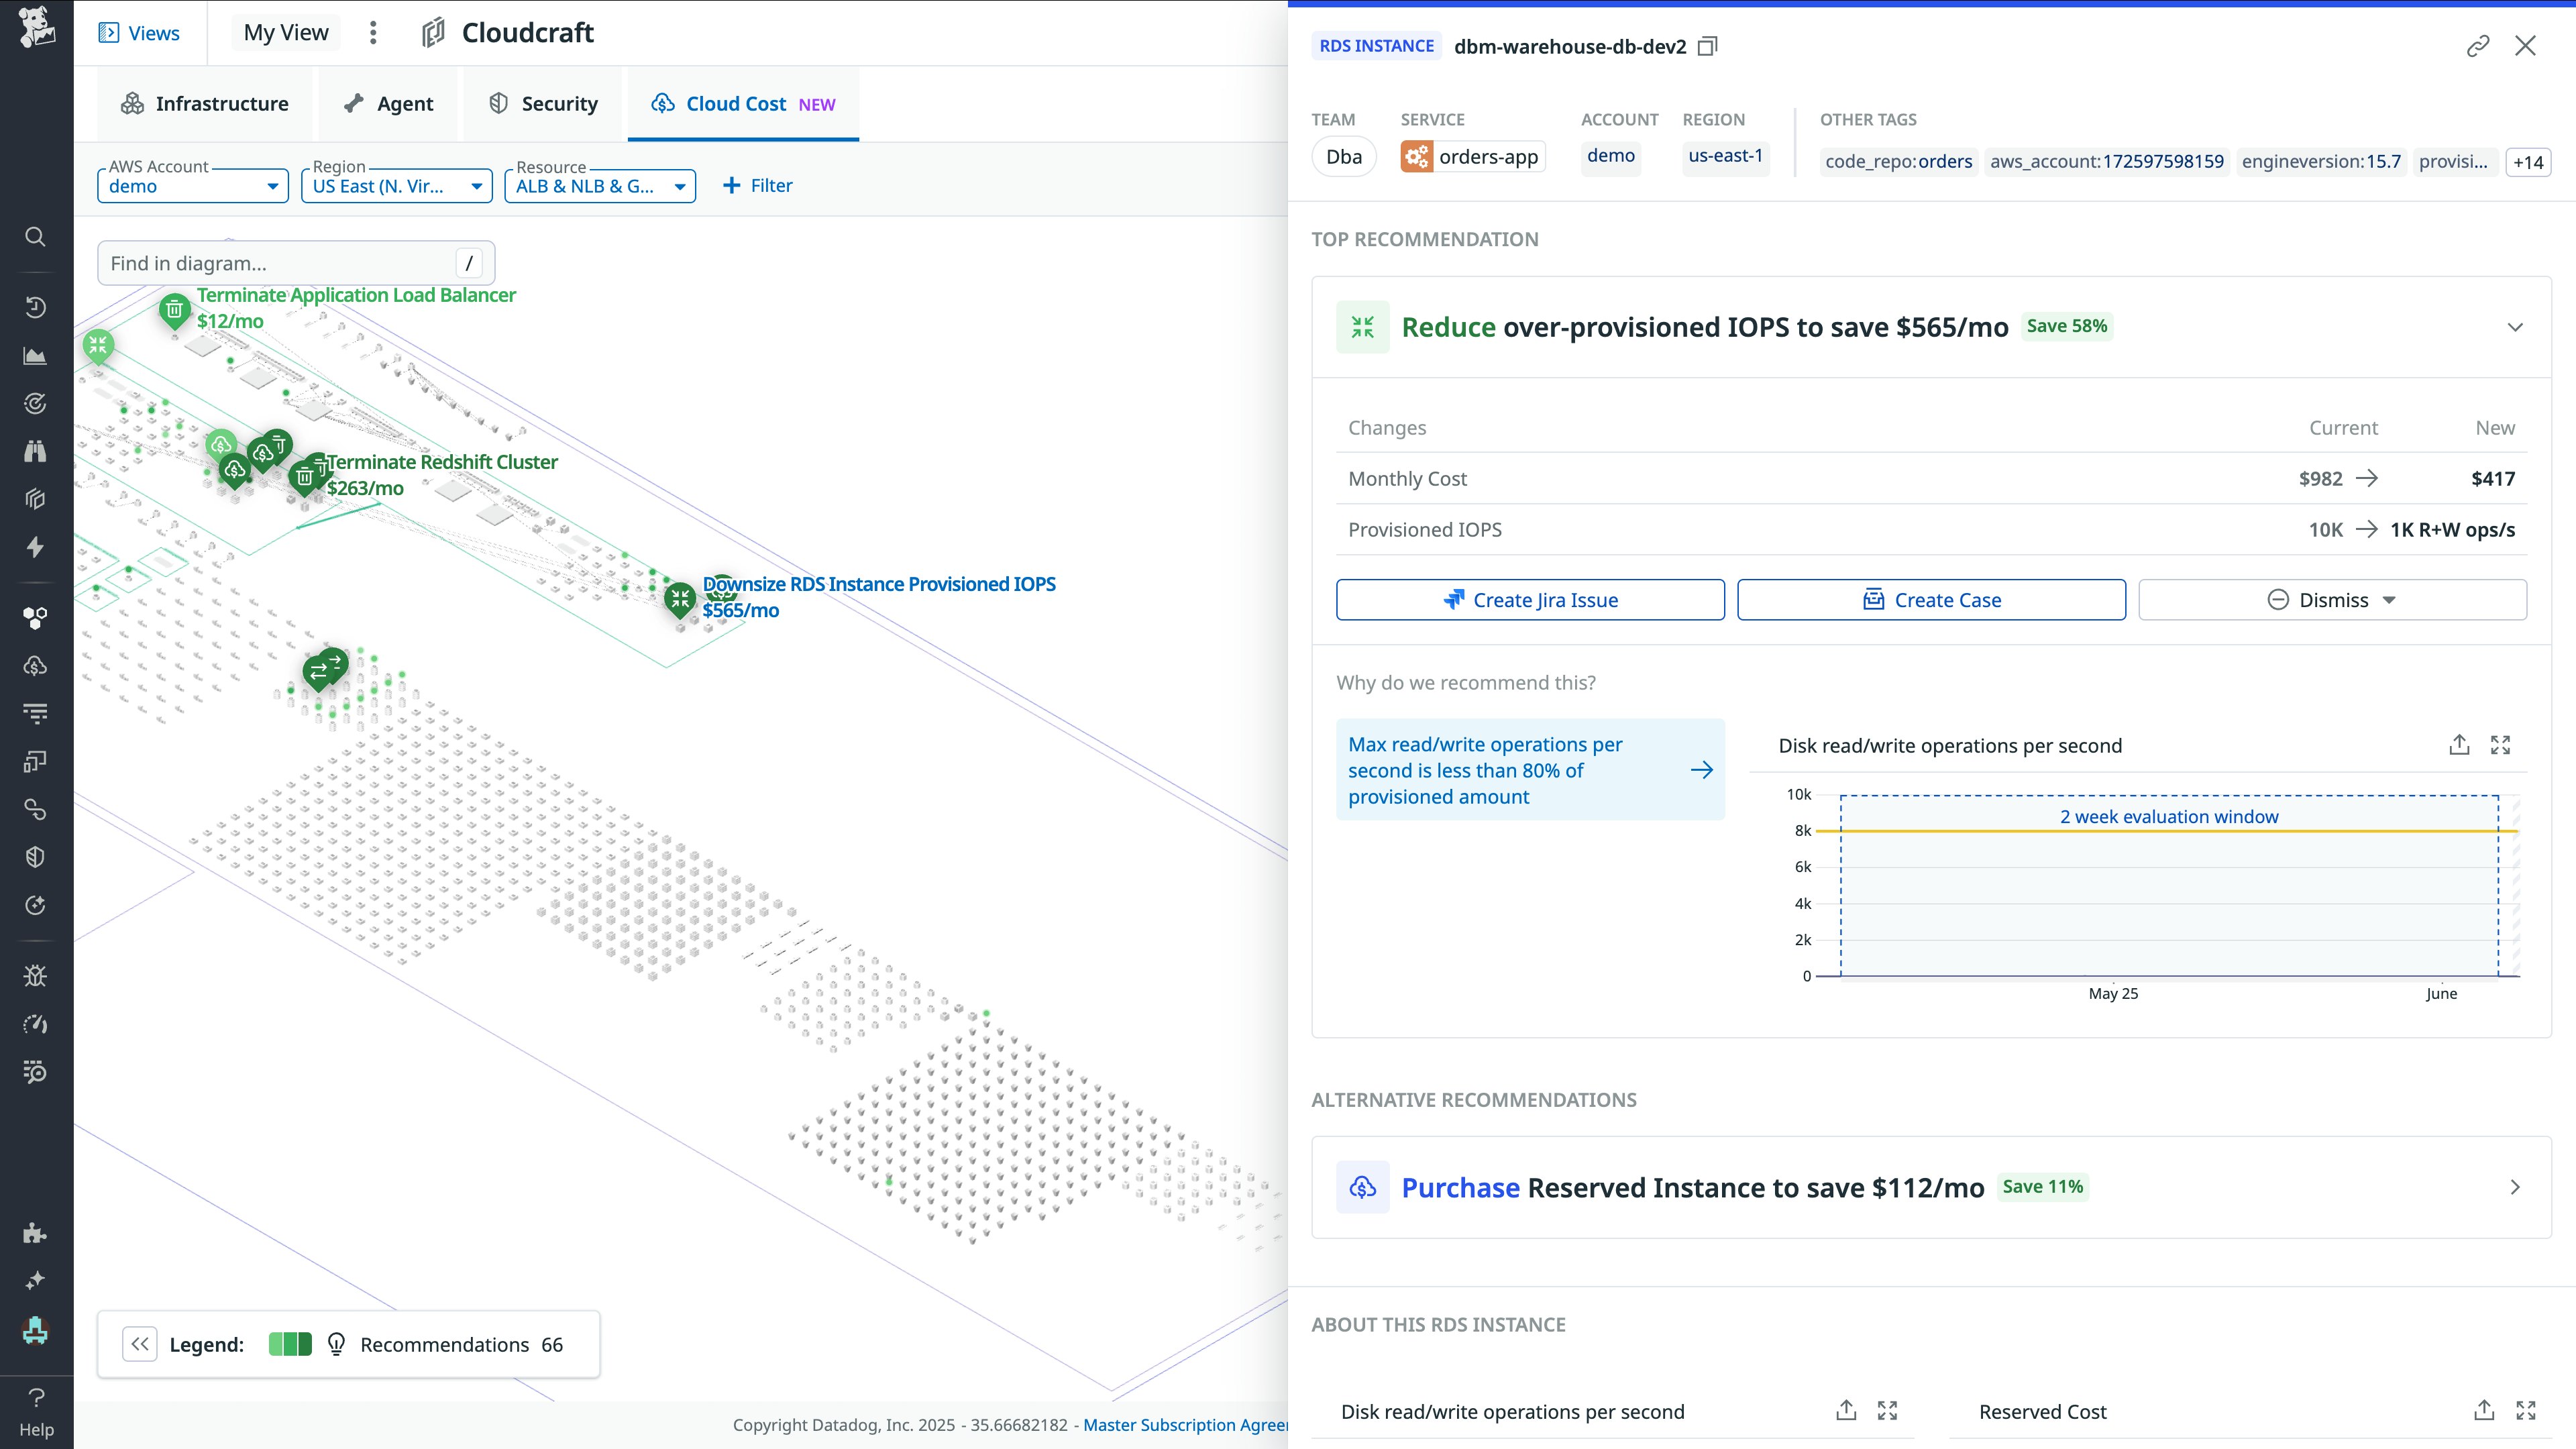
Create up-to-date, rich visualizations of your AWS infrastructure with Cloudcraft in Datadog
As cloud environments grow more complex, teams struggle to maintain accurate, up-to-date diagrams that capture the underlying infrastructure of those environments, resulting in hampered visibility and coordination. To address this, Datadog is announcing Cloudcraft, a new platform feature that automatically generates dynamic AWS infrastructure diagrams. These diagrams act as a single source of truth about an organization’s infrastructure, and they are enriched with real-time observability, security, and cost data connected to recommendations. Cloudcraft empowers teams to detect blind spots, fix security misconfigurations, and optimize cloud spend—all within a single, interactive interface. By tightly integrating with the Datadog platform, Cloudcraft provides clear, actionable insights, helping teams understand and manage their cloud architecture more effectively and collaboratively. Read the blog post for more information.
Easily find cloud cost efficiencies by viewing recommendations on a live infrastructure diagram
When trying to optimize costs in large and complex environments, it can be challenging to find which areas of infrastructure are owned by your team. Incomplete tagging and shared infrastructure can make it difficult to figure out which team owns which resources. To help solve this, Datadog is announcing Cloud Cost Recommendations on the Cloudcraft infrastructure diagram. Because the Cloudcraft diagram shows related infrastructure grouped together in VPCs, subnets, and security groups, it’s easy to find untagged or unowned infrastructure savings related to a team, service, or cost center by viewing nearby infrastructure on the diagram. To learn more, check out our documentation.
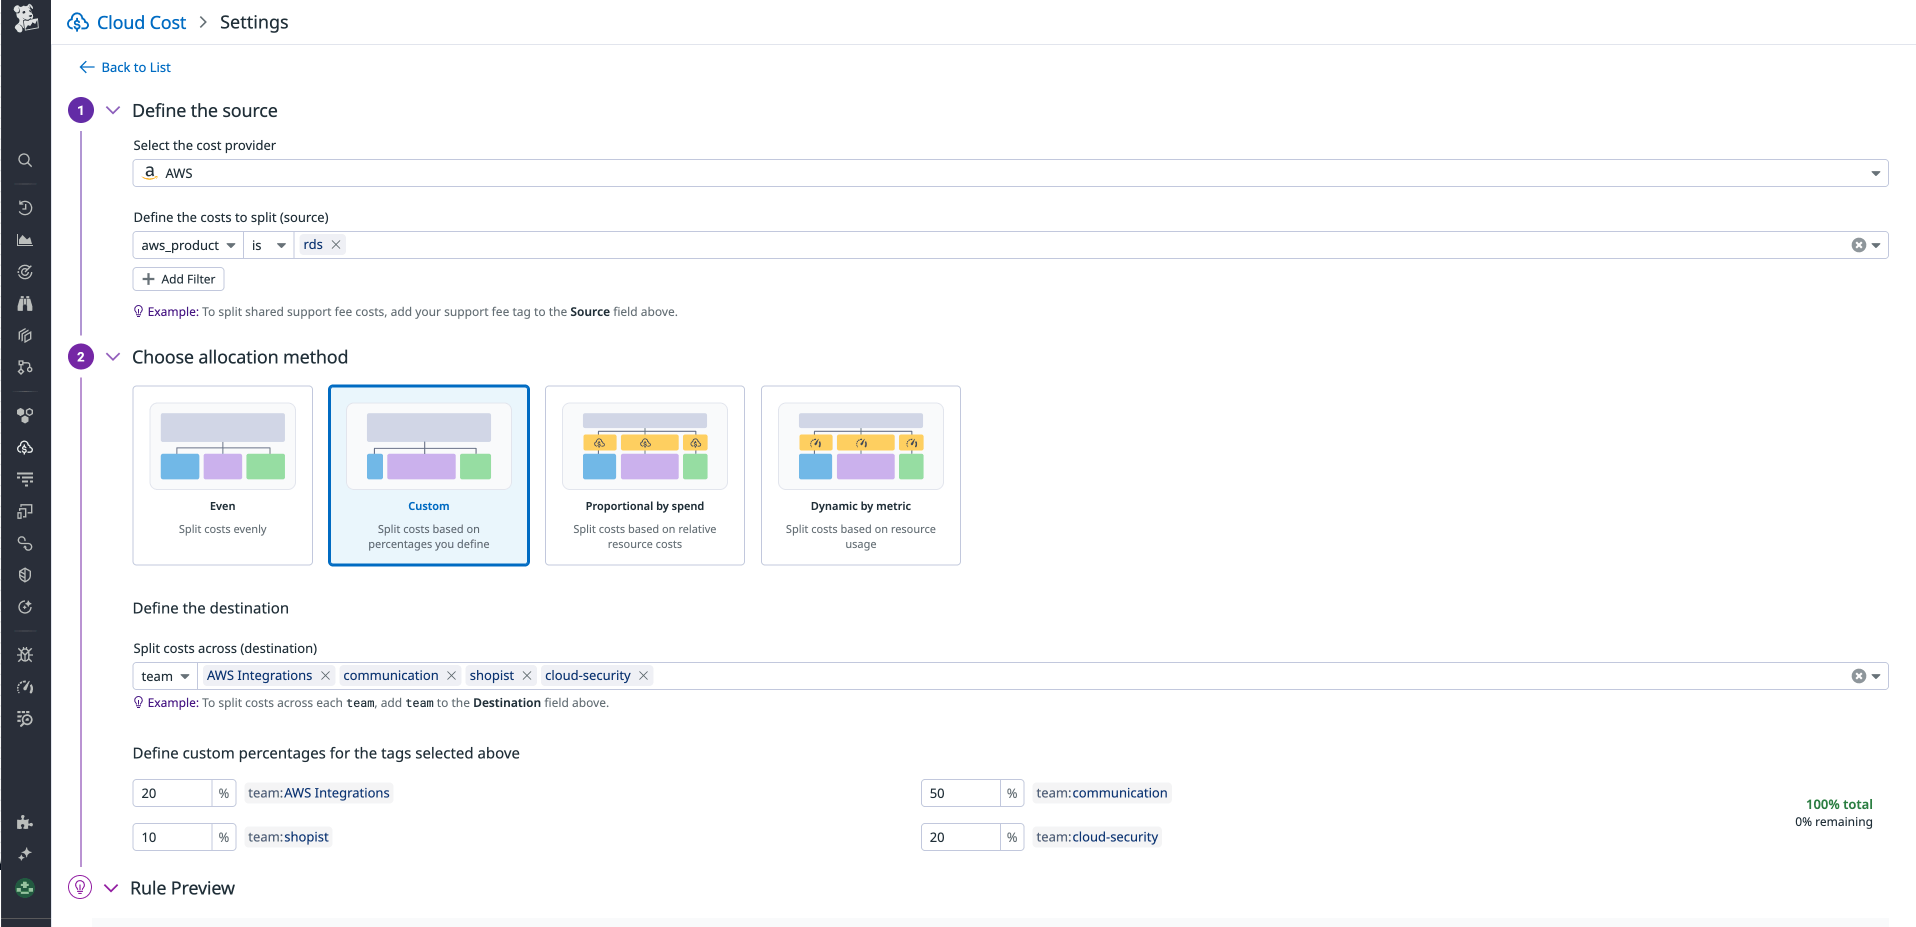
Use custom allocation rules to attribute shared costs to the correct business dimensions across cloud providers
Cost allocation is fundamental to FinOps, but many organizations struggle to get accurate showback or chargeback because shared services like databases and networking don’t come with clear ownership. Datadog Cloud Cost Management (CCM) now enables you to define custom allocation rules to attribute shared costs to the correct business dimensions across AWS, Azure, and Google Cloud. This includes a custom allocation, where you split shared or unallocated costs by custom percentages. This enables FinOps practitioners to break up shared costs that were previously unattributable or difficult to tag on the underlying infrastructure. To learn more, check out our documentation.
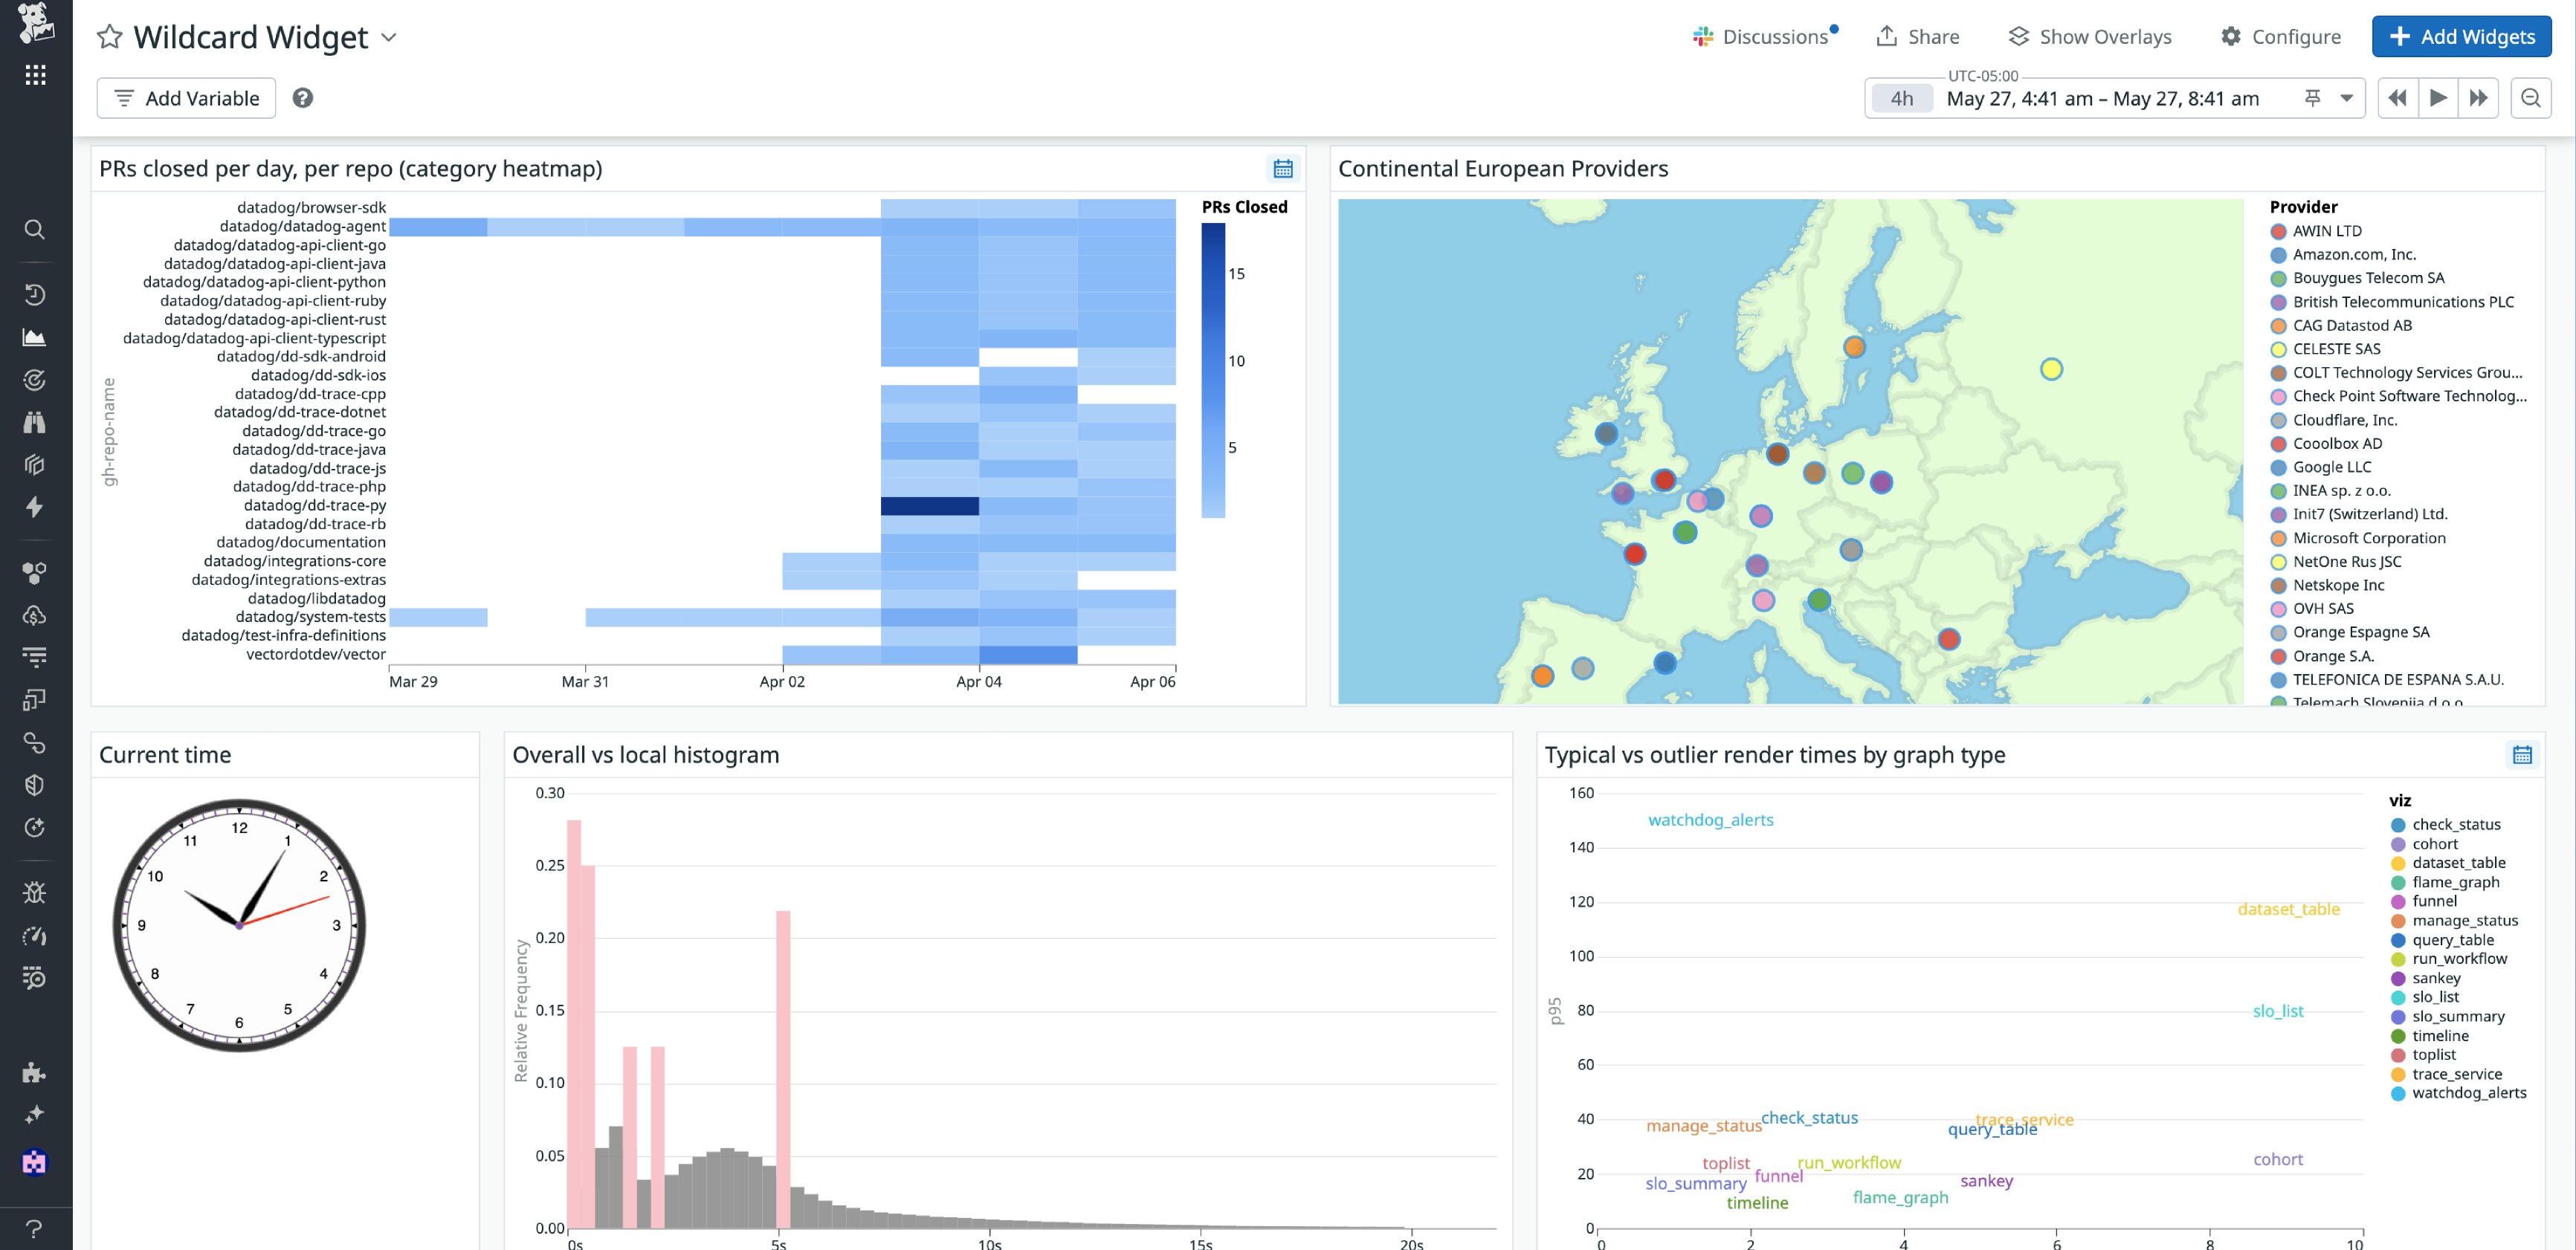
Build Vega-Lite visualizations natively in Datadog with the Wildcard widget
The Wildcard widget enables you to code custom Vega-Lite visualizations directly in Datadog dashboards and notebooks. It supports use cases that require advanced visualization capabilities, whether you’re working with unconventional data formats, external sources, or specific transformations. You can create tailored representations, structure data by using the built-in query editor, apply conditional formatting, use Data Preview to verify chart configuration before rendering, and adjust key properties without editing JSON manually. To learn more, read our blog post.
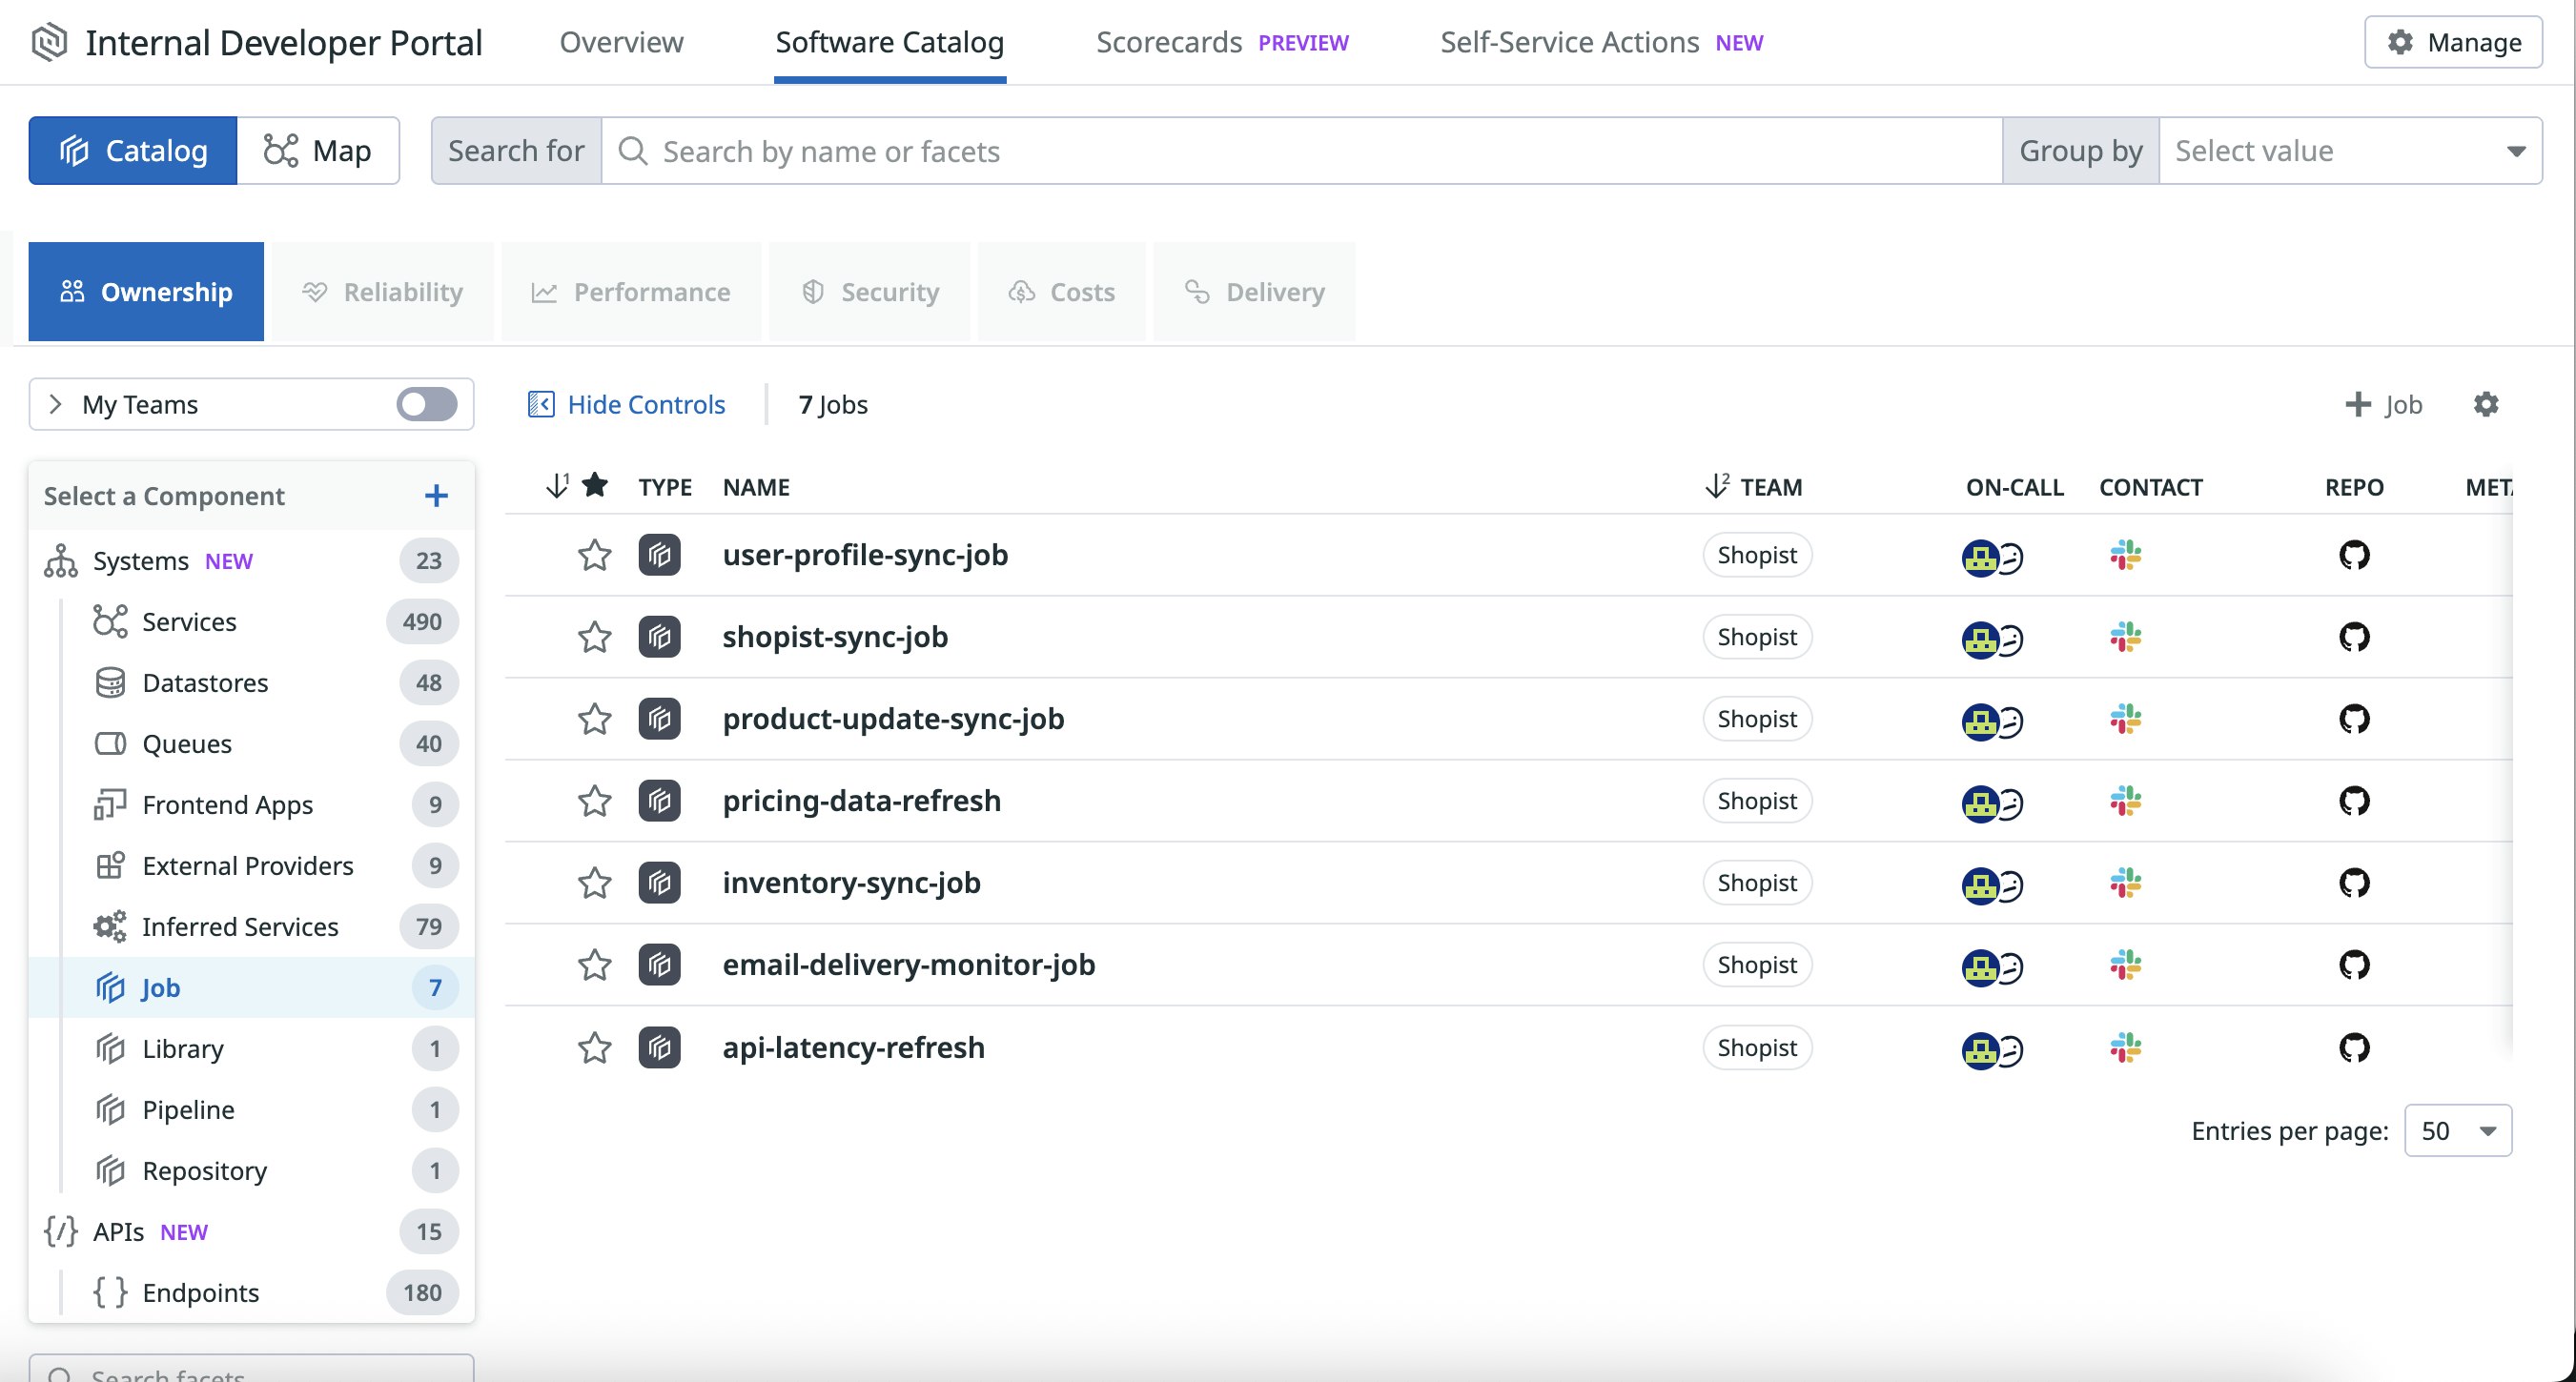
Create a complete representation of your stack with custom entities in the Software Catalog
Datadog’s Software Catalog now supports custom entity types, so you can model your architecture in a way that reflects how your teams build and operate software. Whether it’s internal libraries, pipelines, jobs, or infrastructure modules, this flexibility improves discovery, scorecard accuracy, and troubleshooting, since developers can now find and act on entities that were previously invisible in a one-size-fits-all catalog. By extending the catalog beyond services, you can ensure ownership, visibility, and best practices apply across your full software ecosystem. Read more in our documentation.
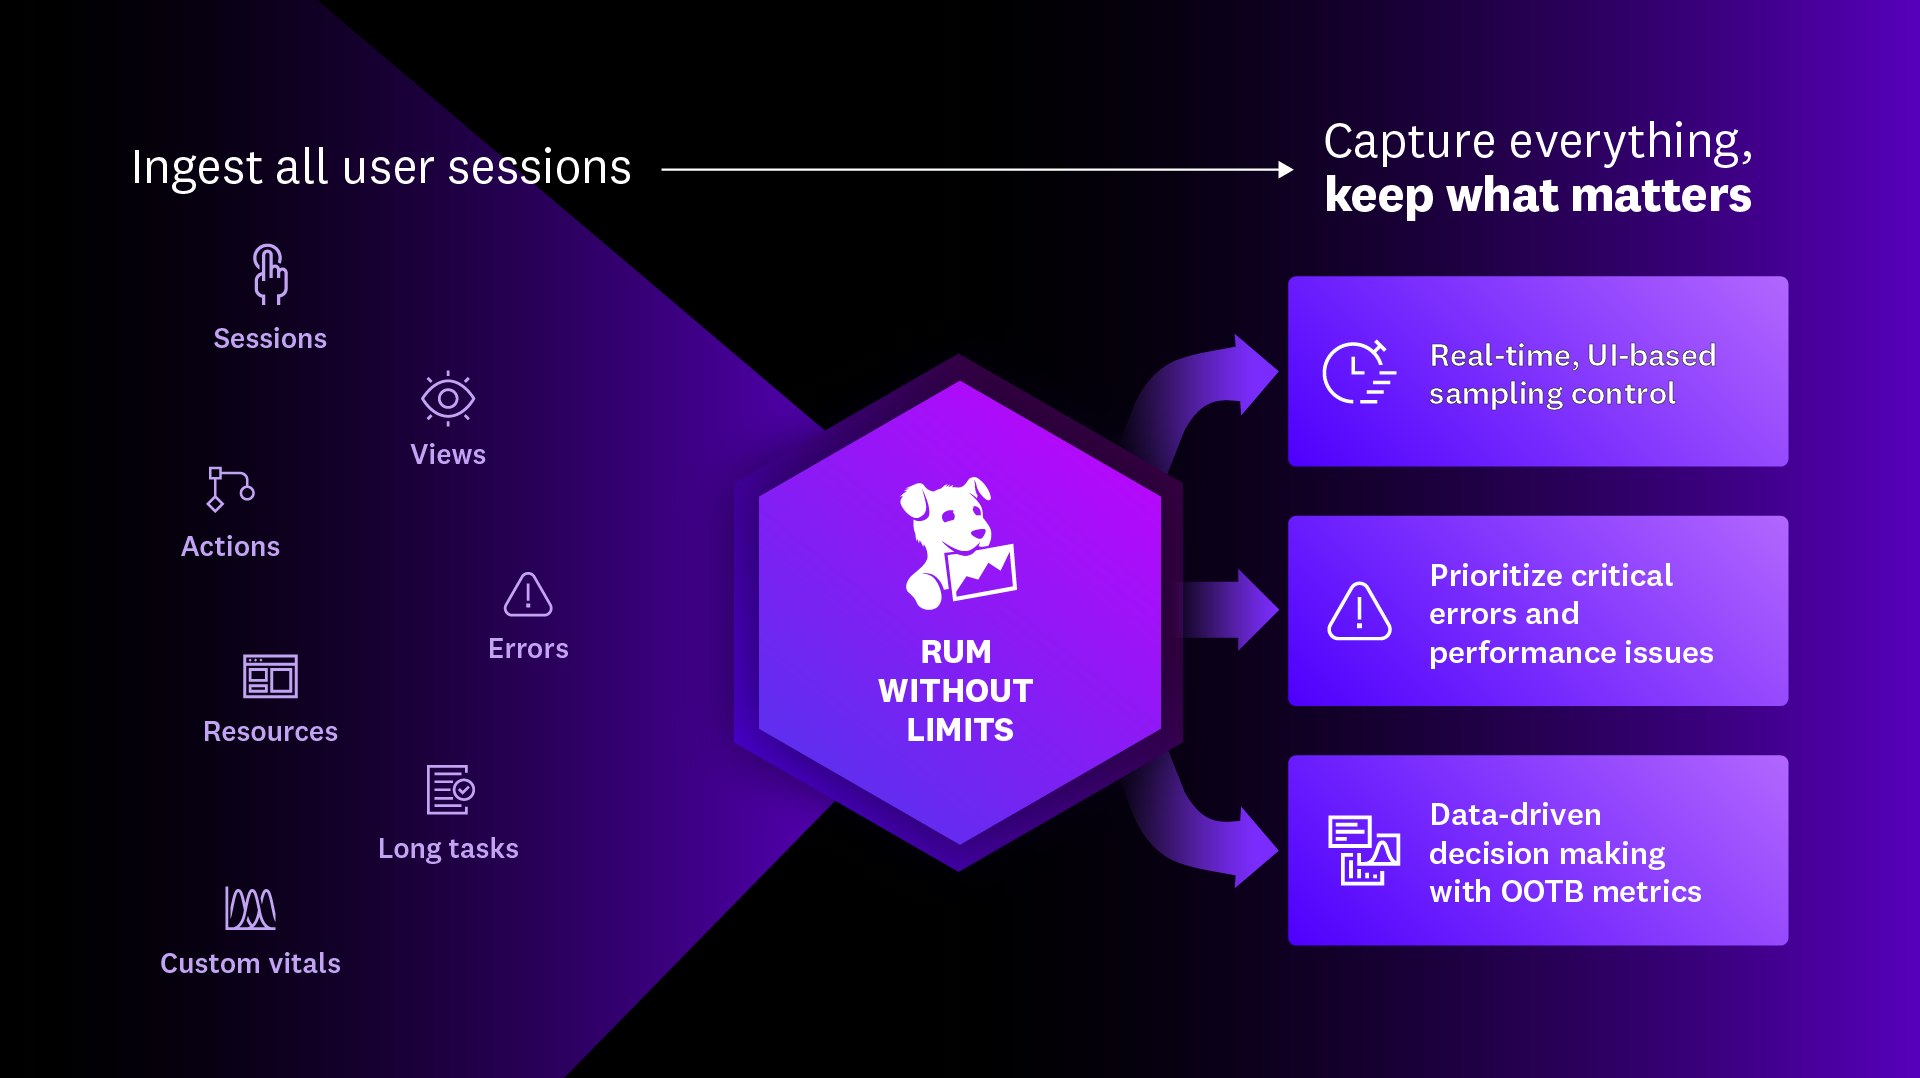
Capture all sessions and keep what matters using RUM without Limits™
RUM without Limits™ redefines Real User Monitoring by giving teams complete visibility into web and mobile user experiences without the high costs and limitations of traditional sampling. Instead of losing critical data due to fixed sampling, RUM without Limits™ captures 100 percent of user sessions and provides precise, actionable metrics you can choose to retain long-term. With customizable retention filters, teams can prioritize and store high-impact sessions and immediately identify frontend errors, performance regressions, and user frustrations. Session Replay further helps teams visualize and resolve issues quickly, ensuring optimized application performance and better cost control.
RUM without Limits™ is generally available today. Read our blog to learn how you can take advantage of this new model.
Improve development velocity and stability
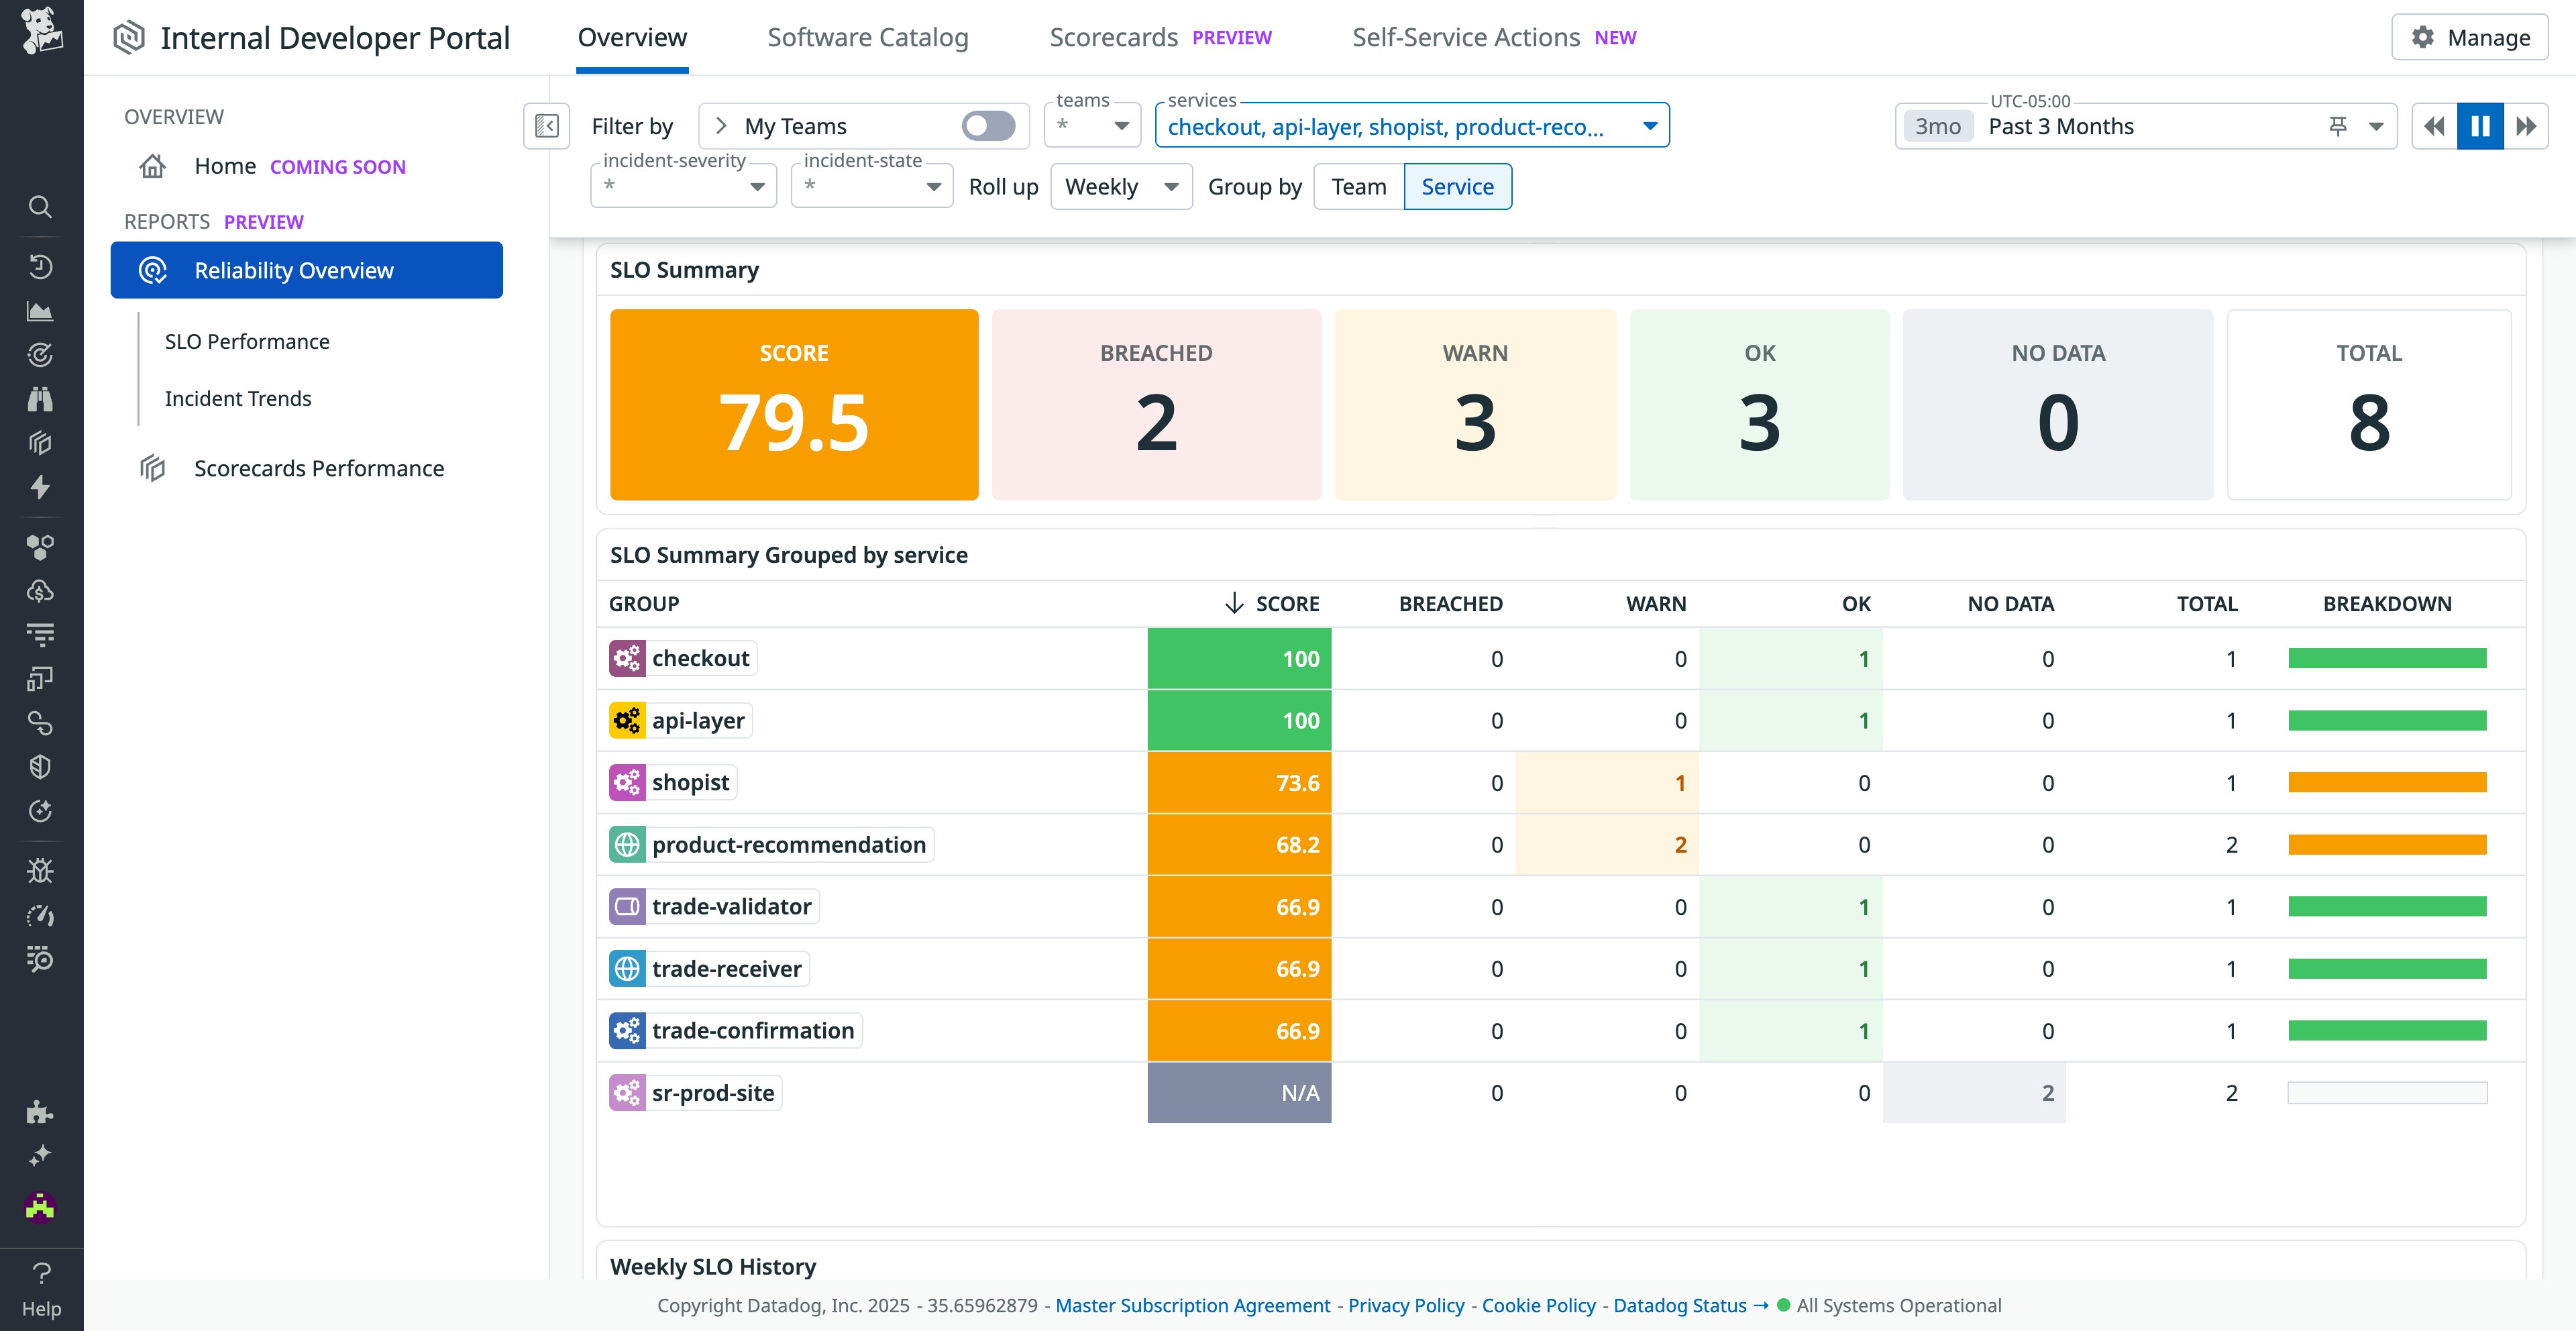
Track key engineering metrics across your organization with customizable, executive-ready Engineering Reports in Datadog’s IDP
Datadog’s Internal Developer Portal (IDP) now offers out-of-the-box, customizable reports to help engineering leadership understand trends and identify gaps in product reliability, adherence to engineering standards, and development velocity and stability. The reports include aggregated views of metrics broken down by team and can be shared via email or Slack, making them well-suited for engineering directors and executive leadership. You can easily customize the reports to suit your organization’s needs—choose how you aggregate your metrics, adjust views for historical trends, and scope your information using a variety of filters. You can now access the following Engineering Reports in Datadog’s IDP: Reliability Overview, Scorecards Performance, and DORA Metrics Summary. Learn more in our blog post and documentation.
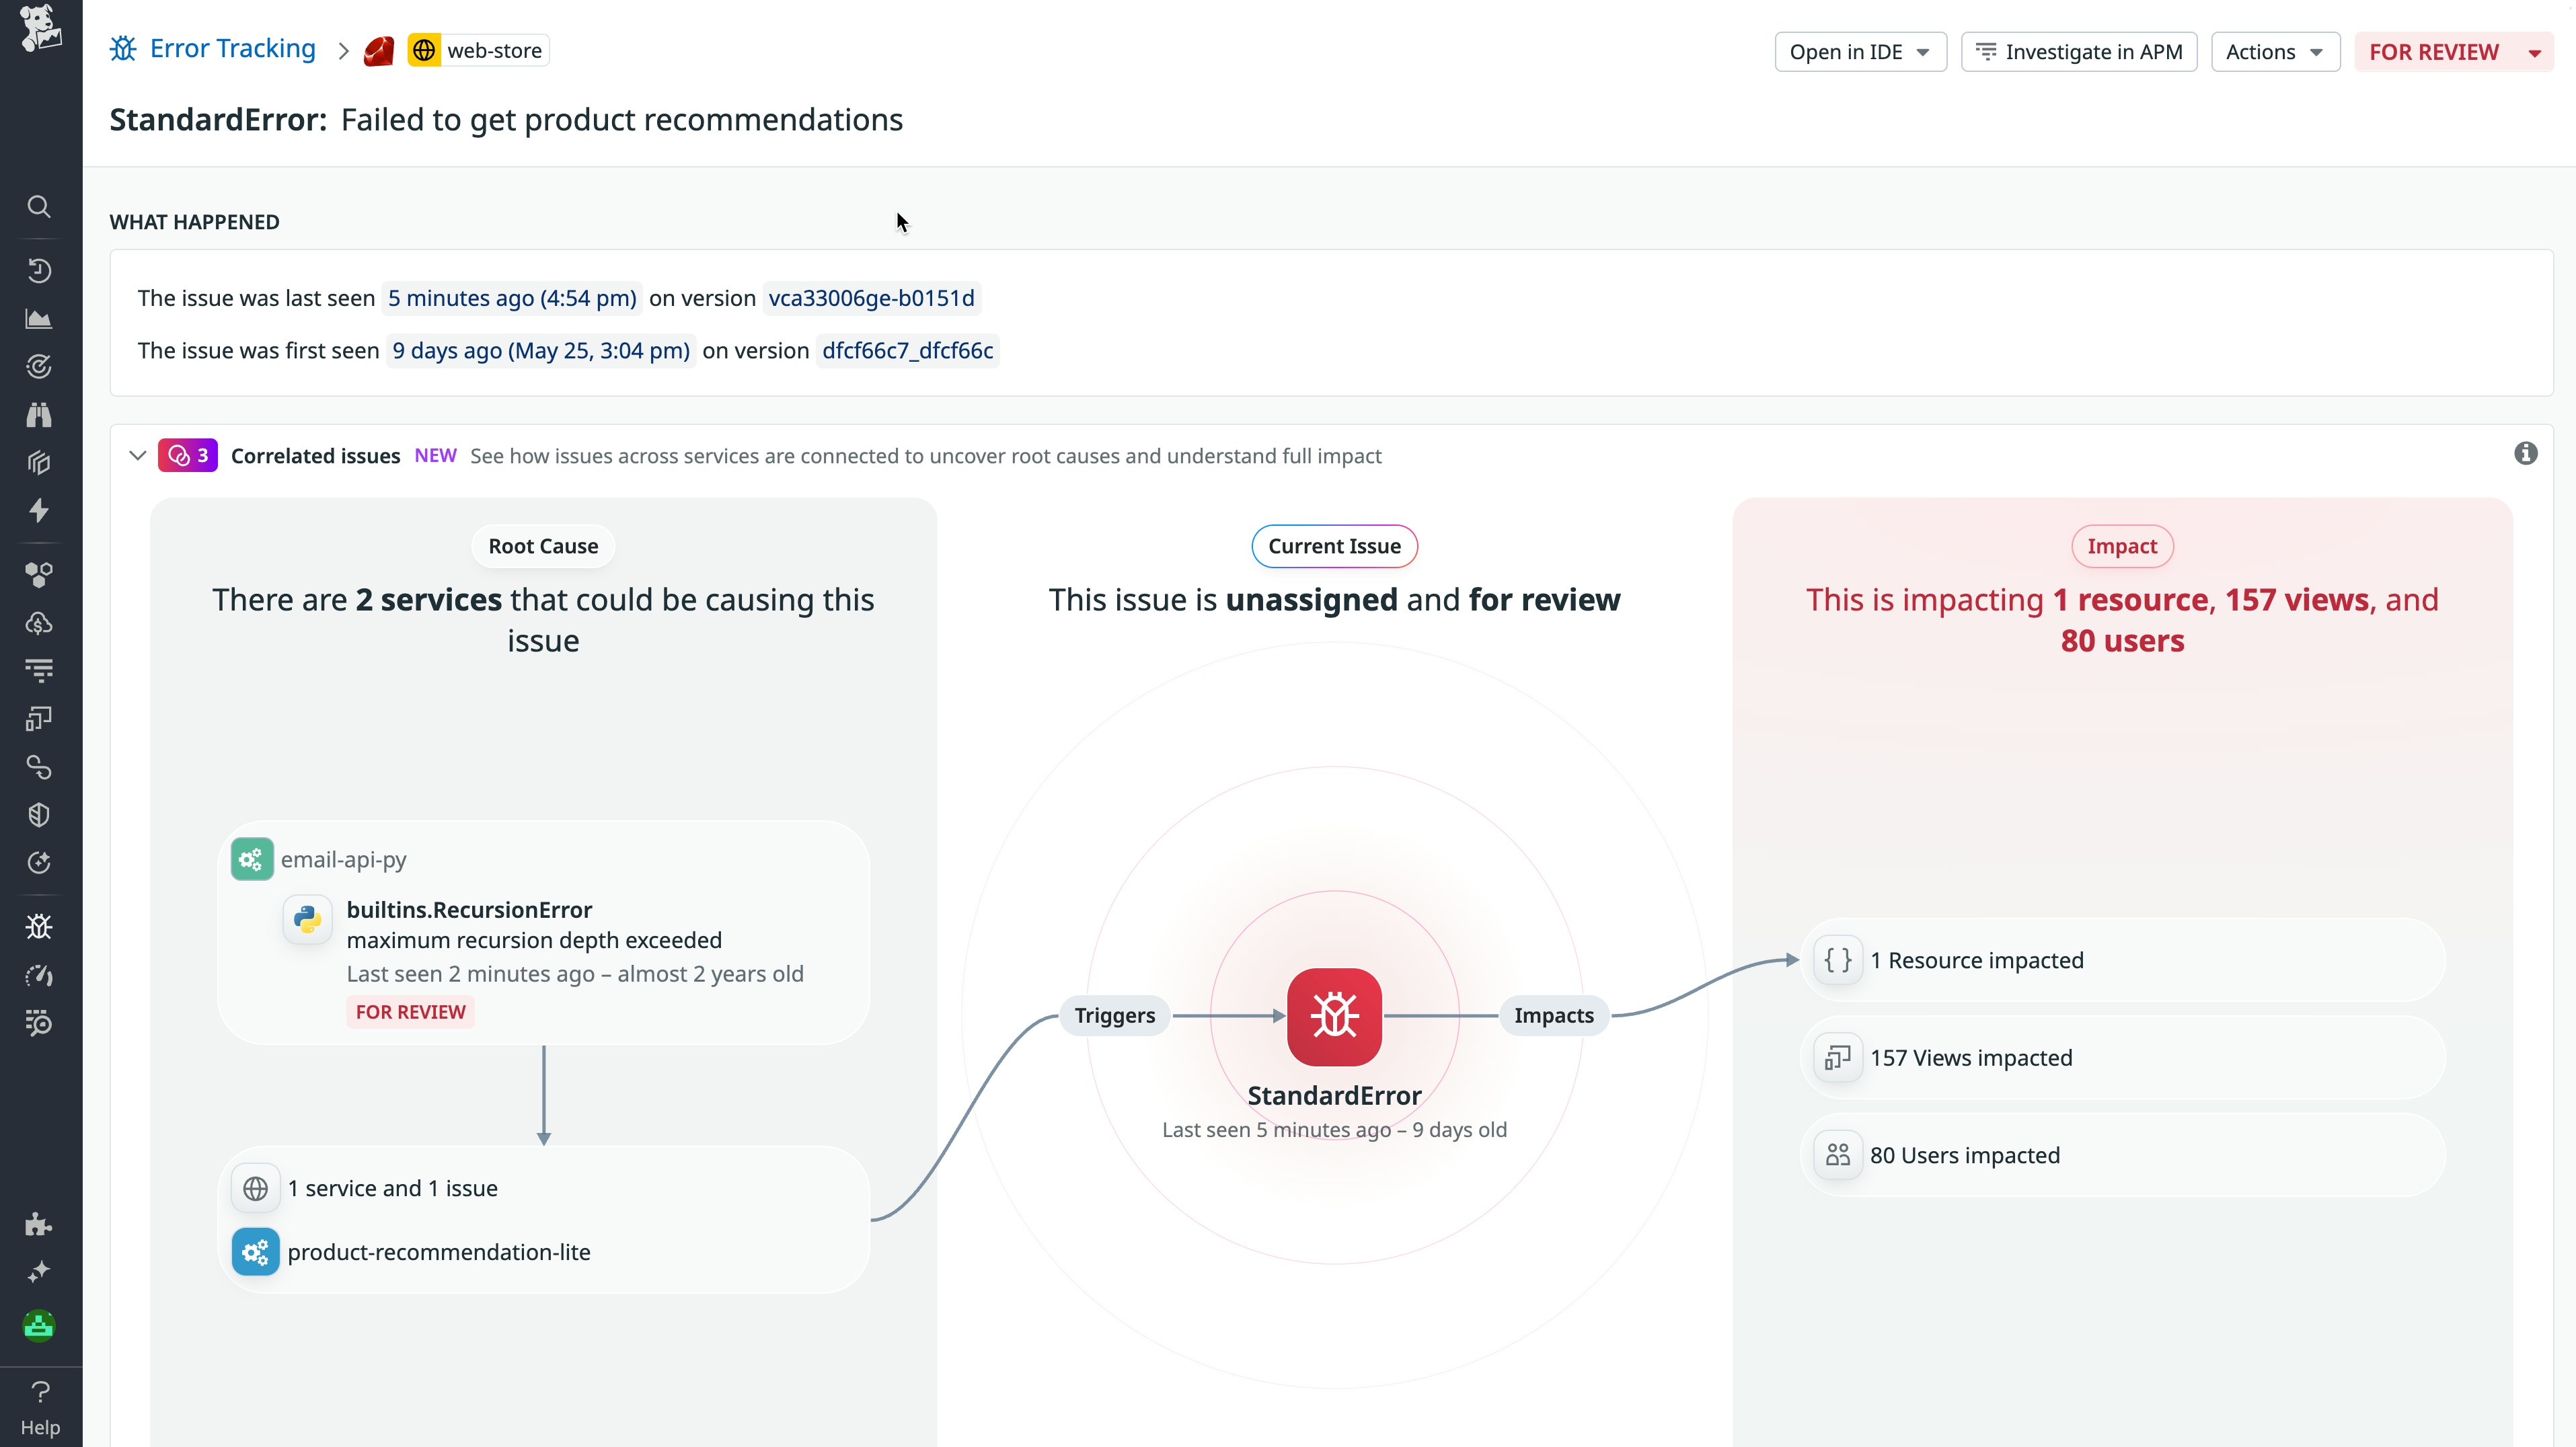
Accelerate root cause analysis and reduce MTTR with Issue Correlation
When errors happen across a distributed system, understanding what’s causing them and who needs to fix them can be a nightmare. Issue Correlation automatically maps related issues across services, helping developers trace problems to their true origin. Instead of sifting through a flood of alerts, teams can focus on what really matters: the most critical errors and their full impact. By surfacing upstream and downstream relationships, this feature accelerates root cause analysis and reduces time to resolution. It’s a powerful step toward faster debugging, smarter collaboration, and clearer visibility across your stack. Sign up for the Preview.
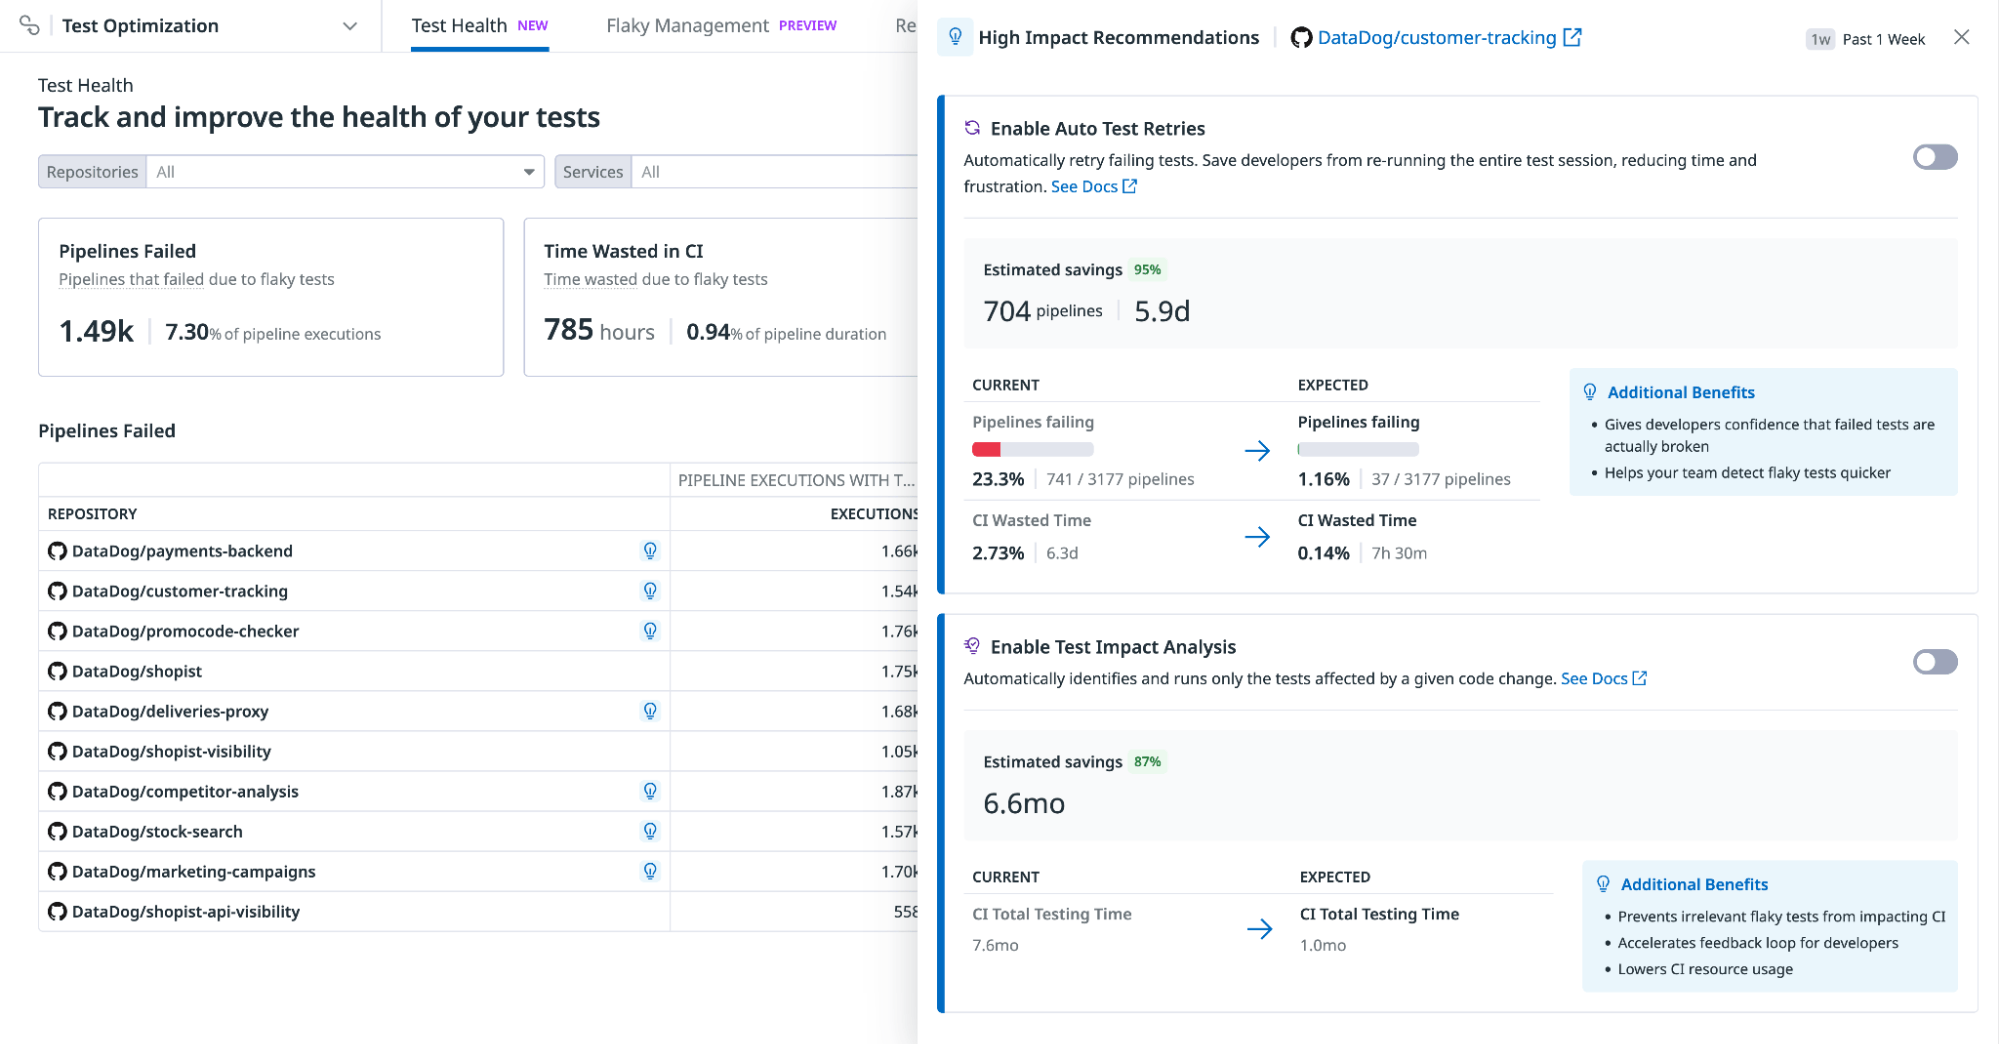
Quantify test health and improve it with one-click recommendations
Flaky tests slow teams down and erode trust in CI. With the new Test Health dashboard, you can now quantify exactly how these failures impact your pipelines, from the number of failed pipelines to the hours of CI time lost. You’ll also see how much your test optimization efforts are helping, including pipelines saved and CI time recovered.
Test Health will also begin surfacing high-impact recommendations, which are targeted, data-driven suggestions tied to specific repos. Each recommendation estimates the failure reduction and CI time saved by enabling certain features, with clear before/after projections.
Recommendations are easy to act on—just a single click to enable—improving the reliability and efficiency of your testing automatically. View the Test Health dashboard and recommendations in the app. See our documentation for more information.
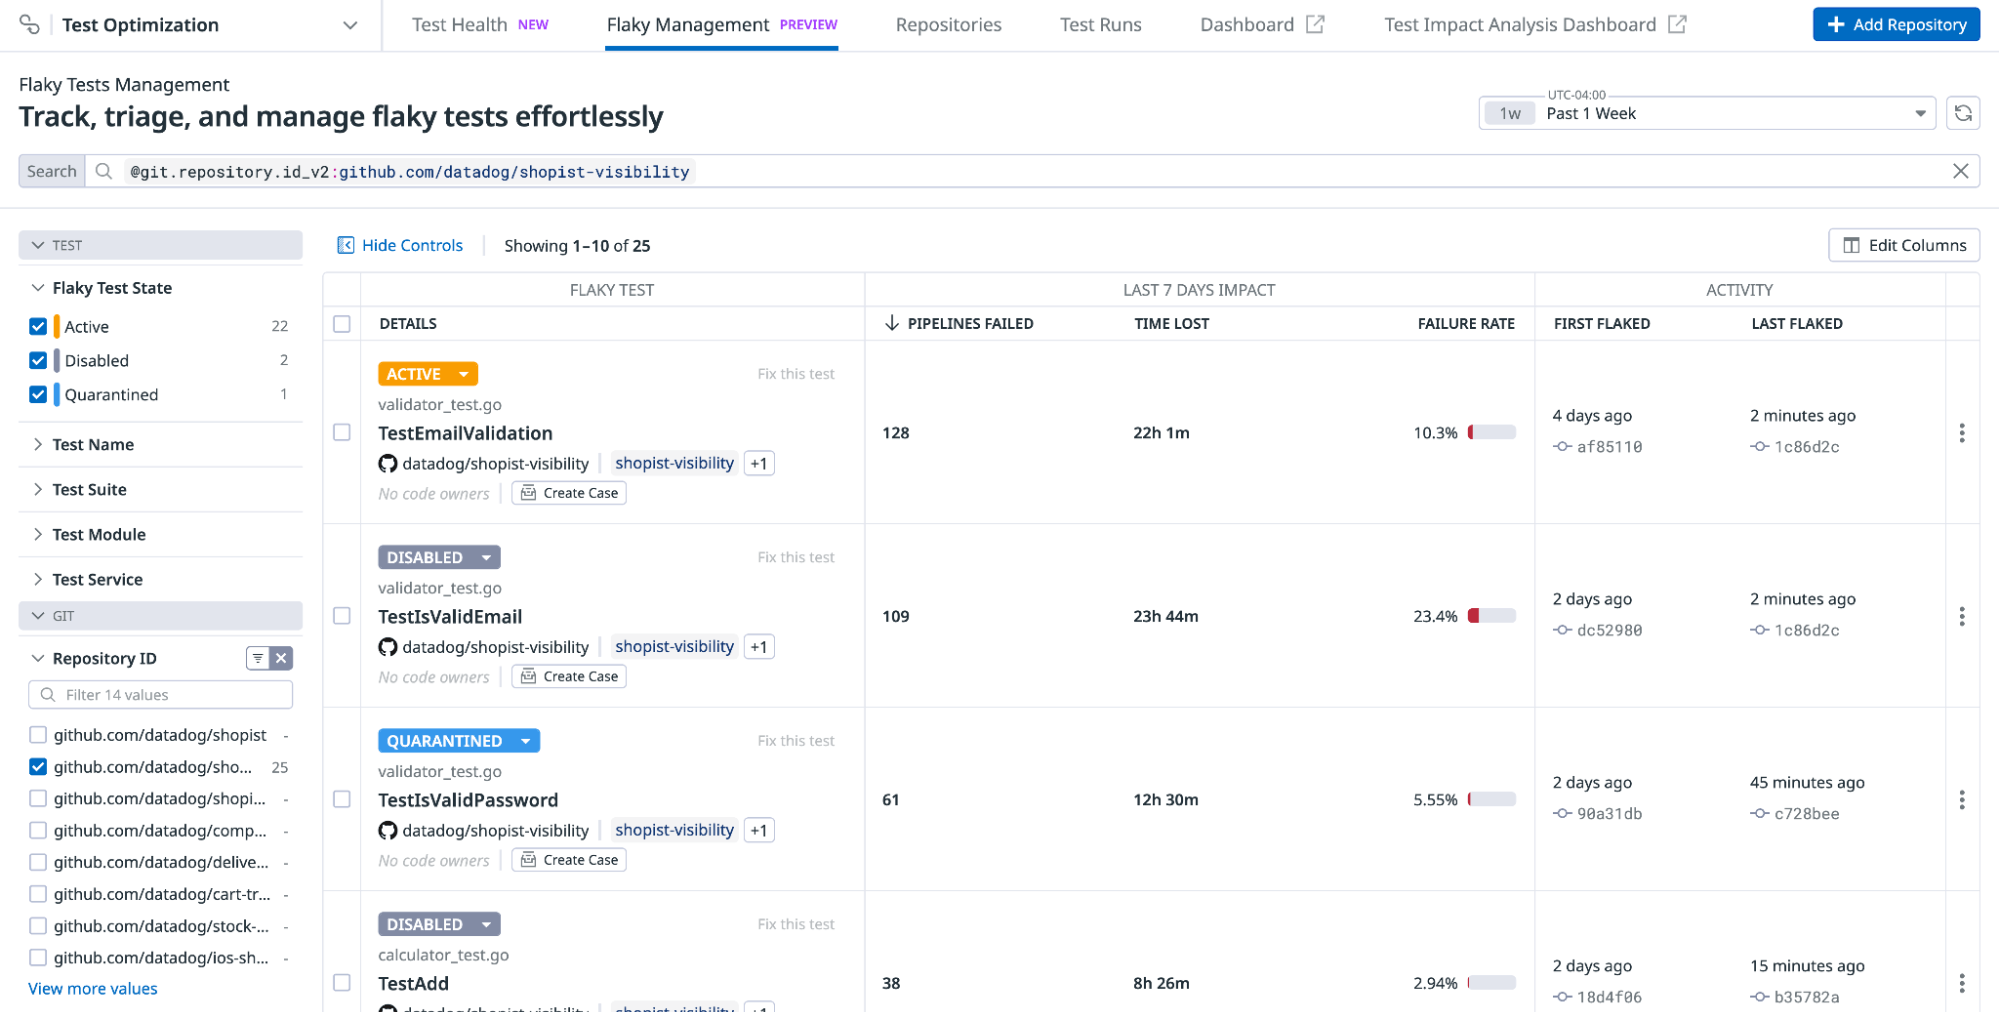
Track, triage, and remediate flaky tests with Flaky Test Management
The new Flaky Test Management page gives you a centralized view to track, triage, and remediate flaky tests across your entire organization. From a single interface, you can see every test’s status—Active, Quarantined, Disabled, or Fixed—along with key impact metrics like failure rate, pipeline failures, and CI time wasted.
Use Quarantine to isolate flaky tests without blocking merges; tests still run in the background, but failures no longer break pipelines. Use Disable to skip problematic tests entirely. Both workflows help reduce CI noise while retaining traceability and control.
Configure flaky test policies that govern how tests move through the lifecycle. For example, a test that flakes in the default branch can automatically be quarantined, and later disabled if it remains unfixed after 30 days. Create cases and JIRA tickets for flaky tests to track work towards fixing them. Flaky Test Management is now in Preview. To request access, fill out the Preview form.
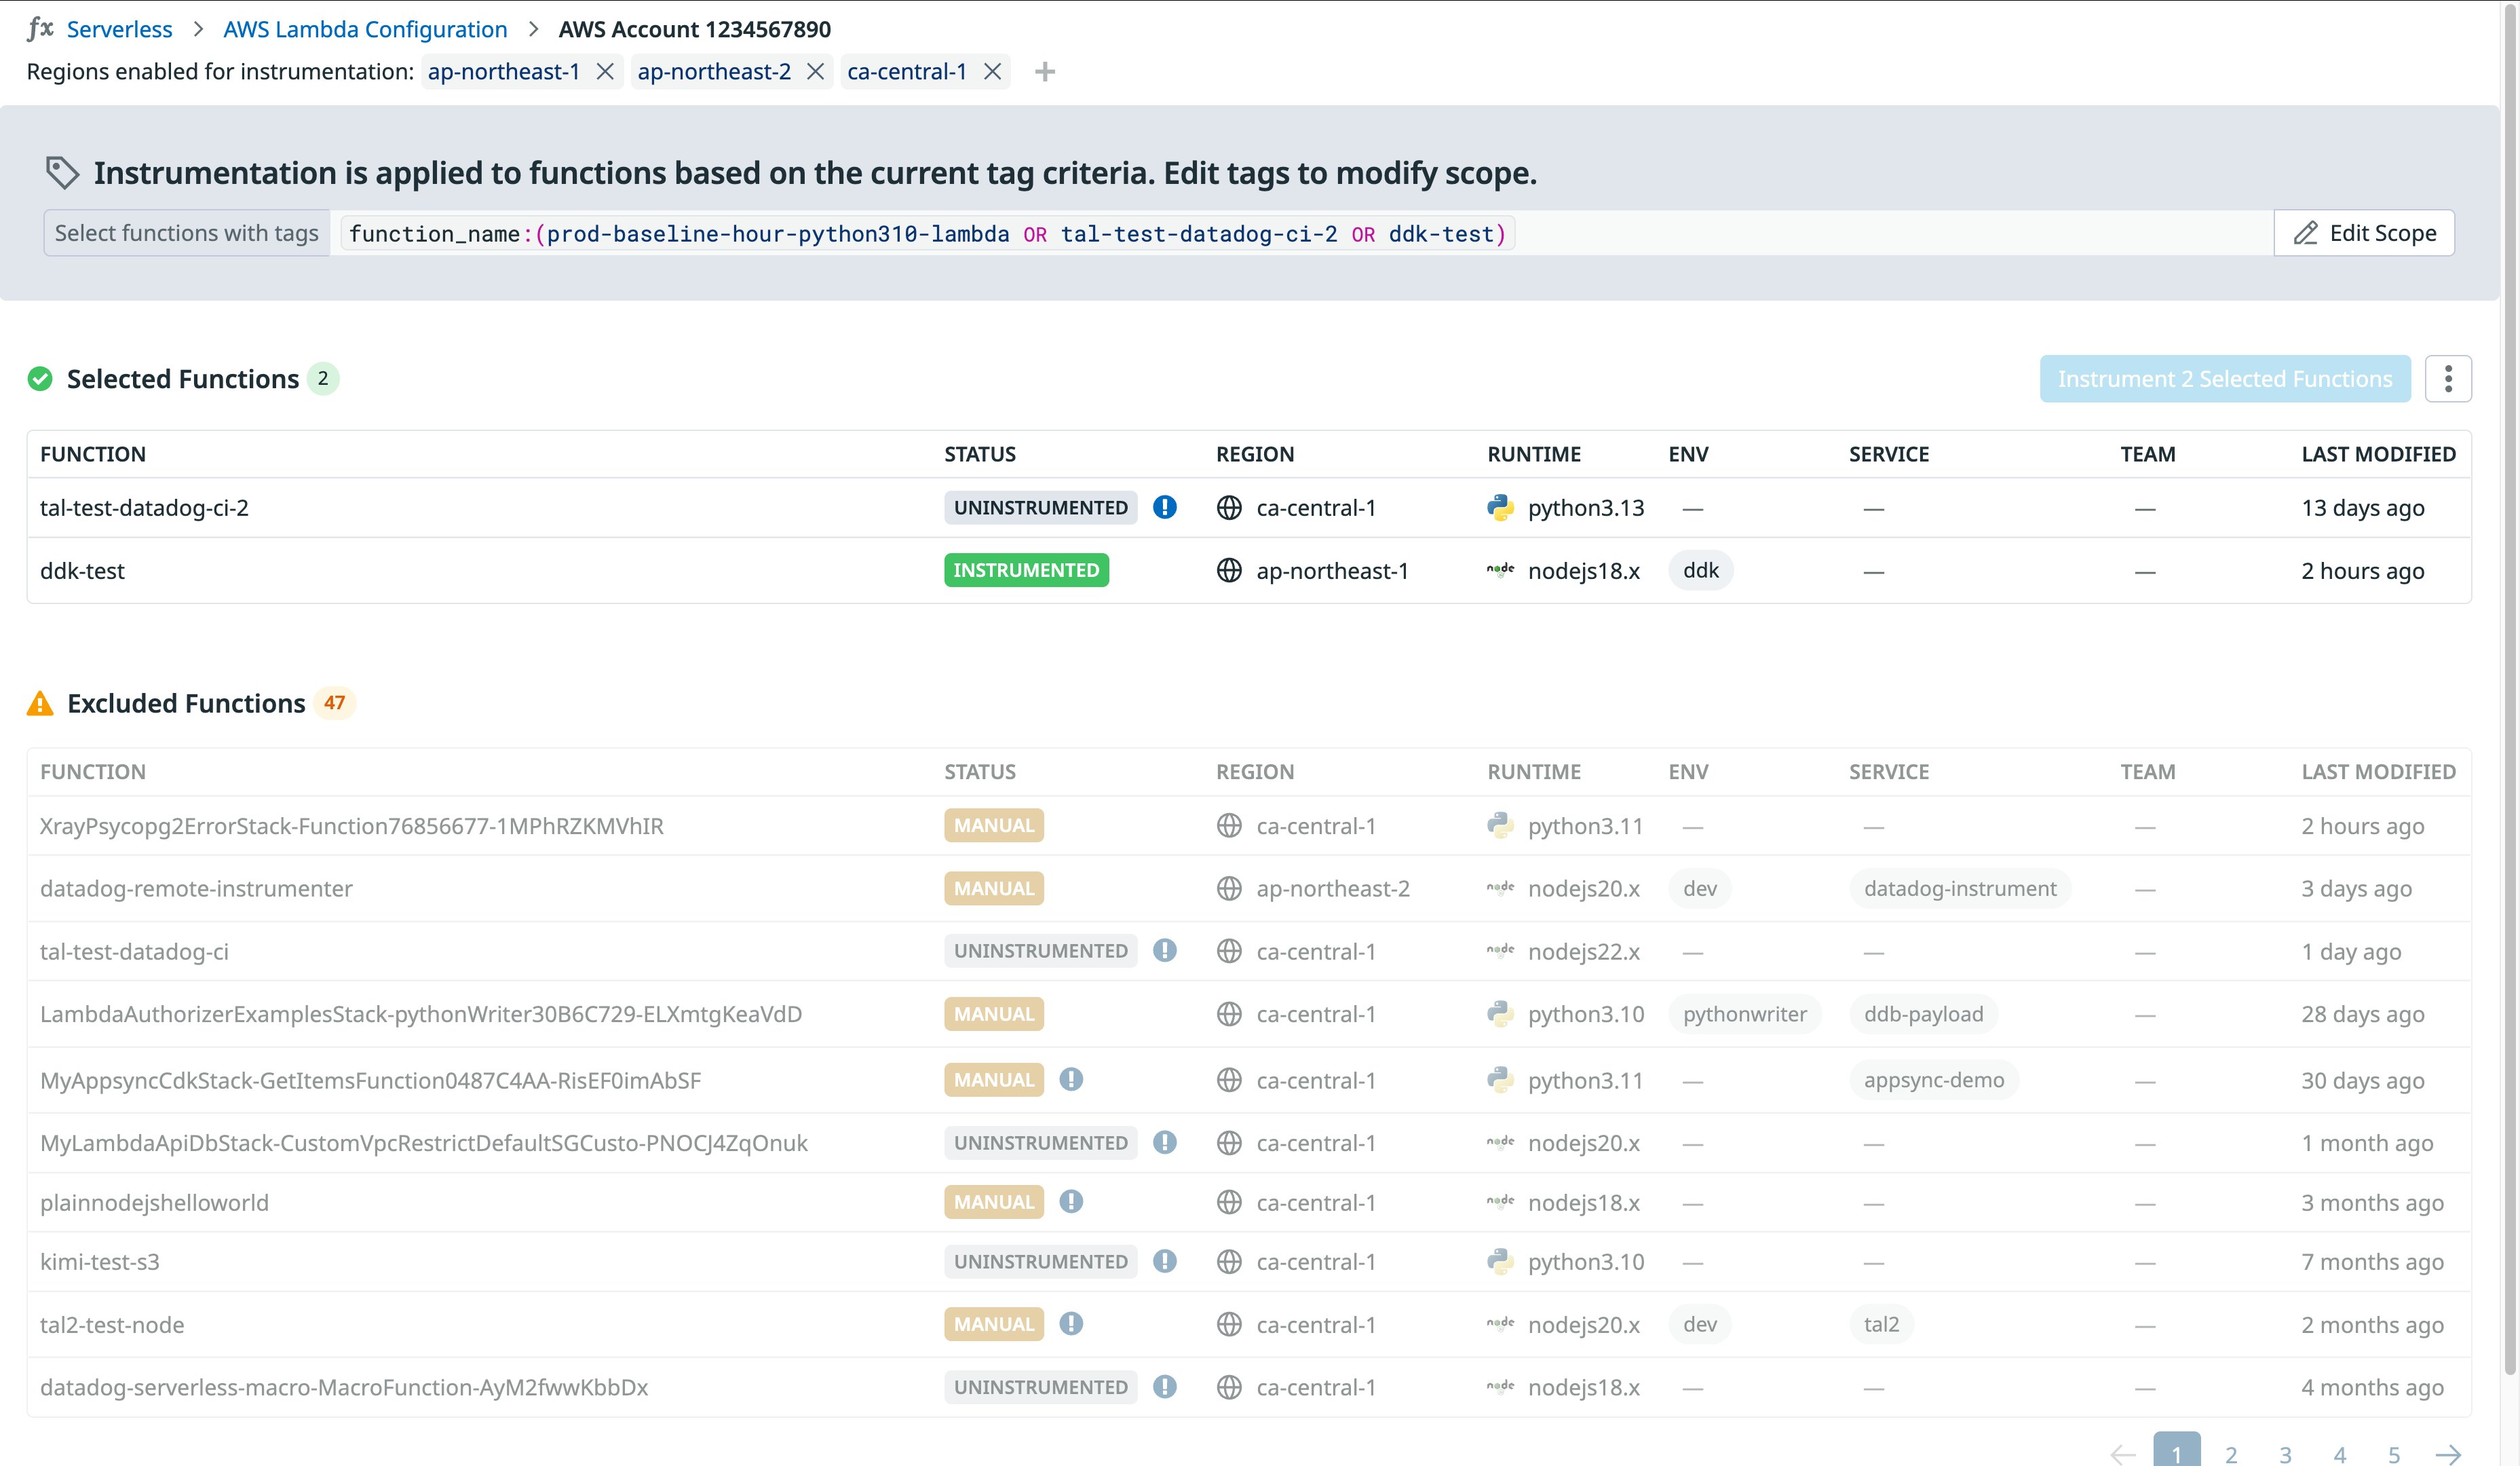
Bulk remote instrumentation for AWS Lambdas directly from Datadog
Bulk remote instrumentation for AWS Lambdas helps teams instrument a bulk of their Lambda functions directly from Datadog. This ensures that these functions stay instrumented, so features like enhanced metrics, traces, and error tracking can easily be added. Teams can quickly add tracing to serverless applications without redeploying code, reducing the time developers spend manually instrumenting individual functions and enabling them to apply instrumentation in real time.
With bulk remote instrumentation, central operations and observability teams can ensure that critical serverless applications are covered without needing to coordinate with every application or service owner. During major incidents or periods of peak traffic, teams can add tracing to Lambda functions that were not instrumented during development, giving them the visibility needed to investigate and resolve issues quickly.
To learn more about serverless monitoring for AWS Lambda, see our documentation and you can sign up for the Preview of bulk remote Lambda instrumentation.
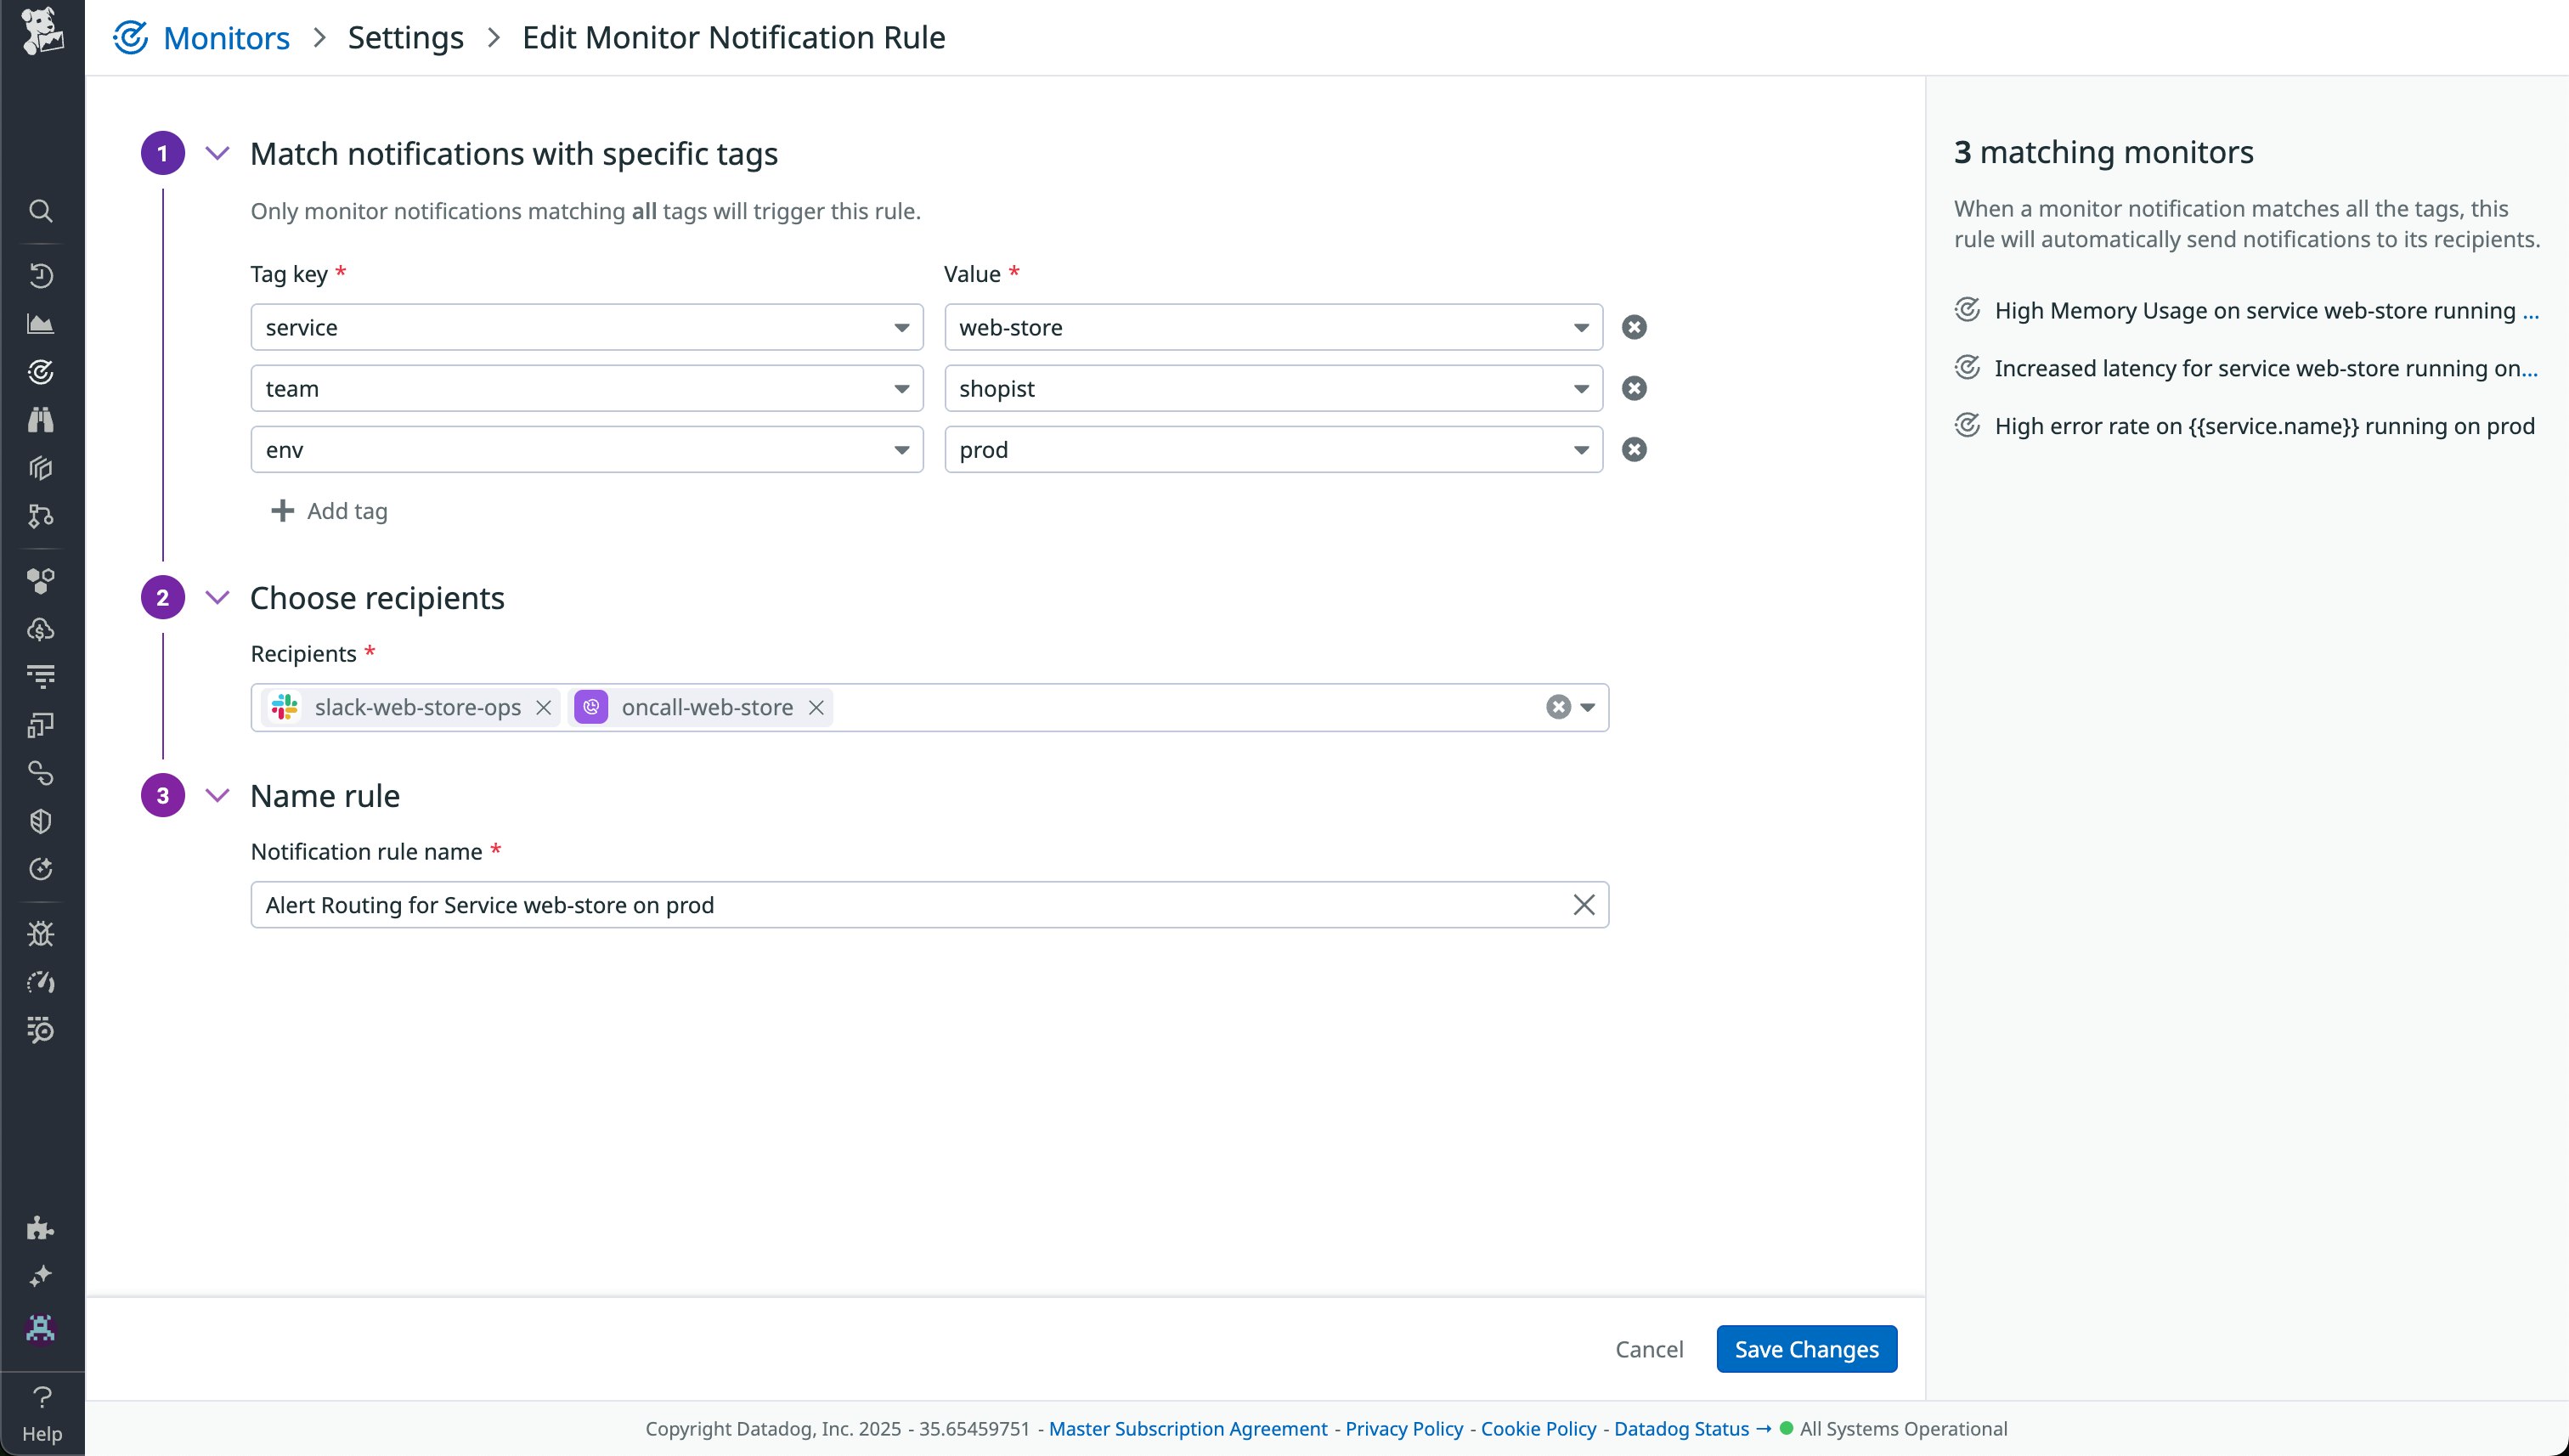
Centralize alert routing logic with monitor notification rules
Monitor notification rules let you centralize alert routing logic, eliminating the need to specify recipients in individual monitor descriptions. Define rules that match monitor or group tags (such as team:payments, env:prod, and more), and Datadog automatically delivers notifications to the correct email, Slack channel, or on-call rotation. Because routing resides in one place, you can roll out new monitors without extra configuration, making it effortless to scale alerting. Teams can keep monitor definitions clean, enforce organizational policy, and ensure that no critical signal slips through the cracks. To learn more, check out our blog post and documentation.
