Kelly Kong
Exponential log growth doesn’t have to drive exponential cost growth. Storing and analyzing logs at scale can be expensive, but Flex Logs—Datadog’s high-volume, cost-efficient log storage solution—enables teams to store more logs for new use cases while staying within budget.
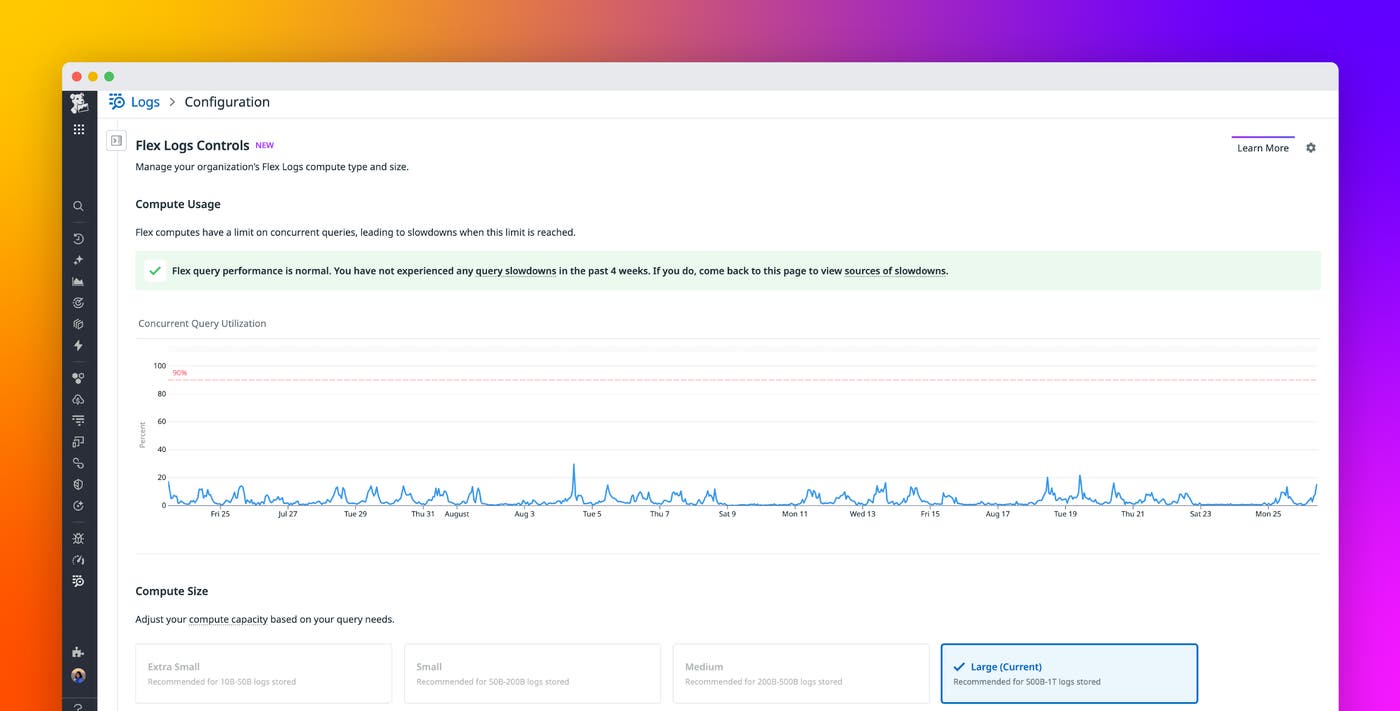
Now teams using Flex Logs have greater visibility into how their Flex compute is being used. With the new compute usage graphs on the Flex Logs Controls page, you can monitor performance, identify slowdowns, and make informed decisions about scaling or optimizing usage.
In addition to providing a refresher on Flex Logs, this post describes how to:
- Gain insight into Flex query performance and compute usage
- Identify and investigate slow Flex queries
- Optimize Flex compute usage
A quick refresher on Flex Logs
Flex Logs enables teams to store and query high-volume log data by decoupling the cost of storage and compute. Teams can store vast amounts of logs for up to 15 months while independently choosing a compute size based on their team’s querying needs. Flex Logs works alongside Standard Indexing, giving teams the flexibility to choose which logs are available for real-time troubleshooting use cases and which are retained primarily for ad hoc analysis.
For example, you can use the value of the log to determine which retention tier should be used to balance cost efficiencies and business needs. Application logs from production environments with an ERROR and WARN level should be stored in Standard Indexing first for use in incident response, while logs at an INFO or DEBUG level can be stored directly in Flex Tier.
The different retention tiers can also be determined based on the volume of the log. Noisy logs from sources like CDN, WAF, and DNS services are also good candidates for storing directly in the Flex Tier. Additional recommendations on candidates for the Flex Tier can be found in the documentation.
Gain insights into Flex compute usage
Datadog now displays Flex query performance on the Flex Logs Controls page. These graphs provide visibility into how your compute is being used, helping you determine whether your current setup meets your needs or if it’s time to optimize or upgrade.
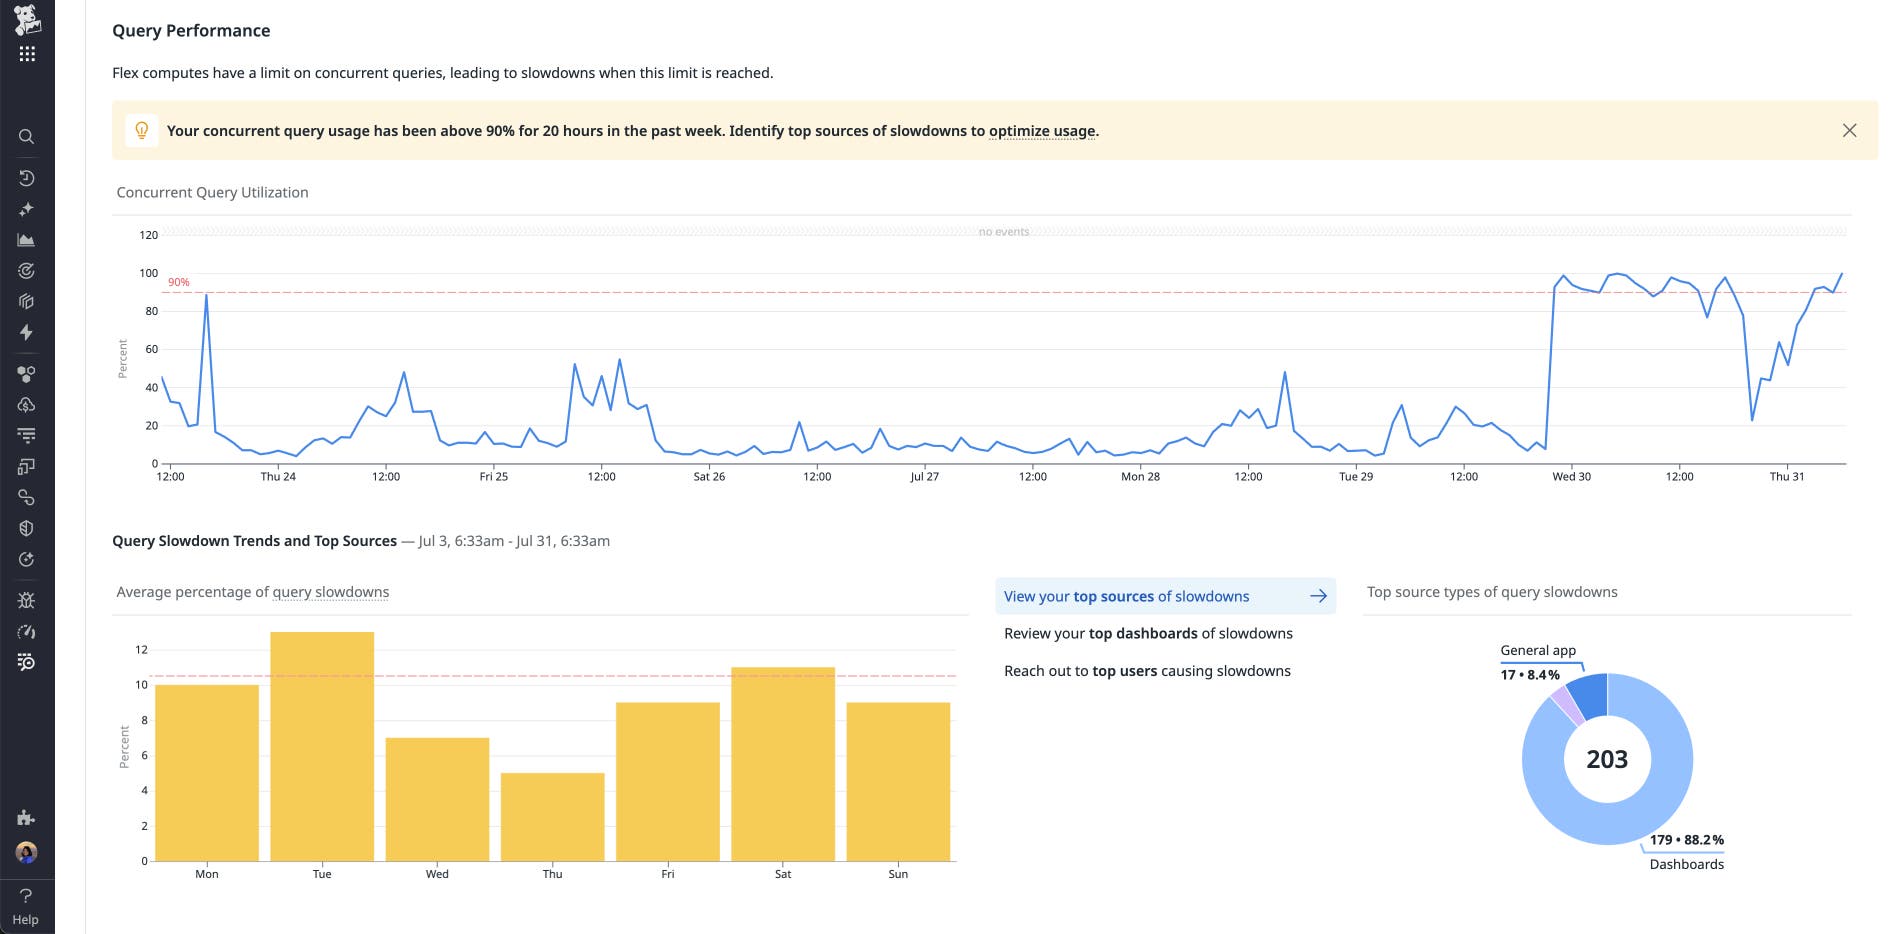
One of the limits of Flex compute is the number of concurrent Flex queries that can be run. When your Flex compute reaches its maximum capacity, new queries must wait for available capacity before executing. To address this, the new graphs on the Flex Logs Controls page enable you to see:
- Your current compute utilization
- When and how often query slowdowns occur
- How many queries are affected
- Which sources, such as specific dashboards or the Logs Explorer, are driving usage
This makes it easier to correlate performance issues with compute capacity and helps teams identify and understand areas of high compute usage.
Identify and investigate slow Flex queries
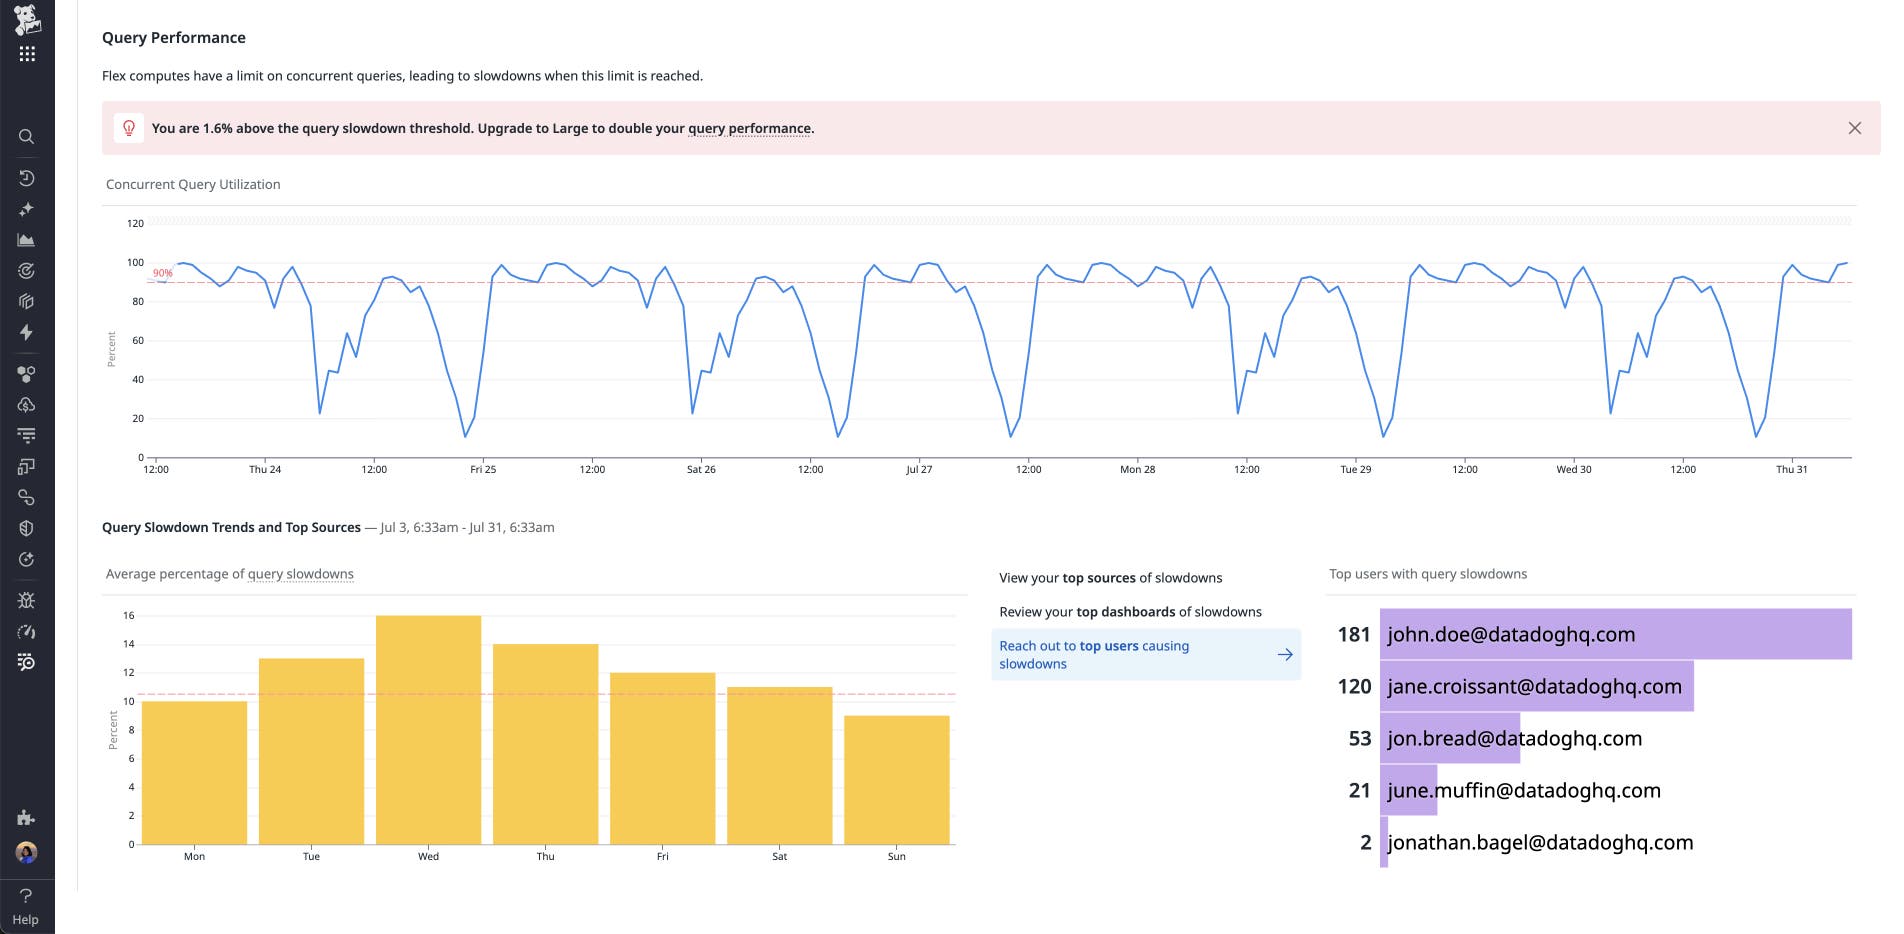
On the Flex Logs Controls page, you can dig deeper to view the top users and dashboards experiencing query slowdowns. If a dashboard is consistently experiencing slowdowns, it might be time to optimize its performance or move frequently accessed logs into Standard Indexing.
You can also identify if a small group of users or teams are responsible for a disproportionate share of compute usage. Click on top users to view an Audit Trail history of log queries they’ve made, and consider contacting them to understand if they have new workloads or just temporary increases in queries due to testing. This increased visibility into Flex compute usage helps you unearth opportunities to refine log storage throughout your organization.
Best practices for fine-tuning your Flex compute usage
If you’ve identified areas for optimization, consider the following best practices to improve log query performance and dashboard responsiveness.
Improve query efficiency
To improve query efficiency, specify the log index directly in your queries when you’re working with known datasets. This helps avoid unnecessary scanning and speeds up results.
Optimize dashboards
You can also optimize dashboards to reduce compute load and improve responsiveness. If a widget is only displaying counts of logs with low information density, consider converting those logs into custom metrics and switching to metric-based widgets. Organize widgets into Groups and keep them collapsed until needed to prevent unnecessary queries from being started. During investigations, pause auto-refresh by clicking the “pause” button next to the time window to avoid constant reloading of queries.
Scale your environment
If you’re seeing sustained slowdowns or frequent query throttling, consider upgrading your Flex Compute size. This increases your concurrent query limits and improves responsiveness.
The right approach depends on your team’s workflows and priorities. These insights help you fine-tune your configuration to improve performance without unnecessary spend. For more tips, see the Flex Compute usage guide.
Get started with Flex compute usage monitoring
Flex Logs offers a flexible, cost-effective way to store and query large volumes of logs. Now, with Flex compute usage insights, you have the transparency needed to manage performance as your usage scales.
To learn more, check out our Flex Logs documentation. If you aren’t yet a Datadog user, you can start exploring compute usage in your own account with a 14-day free trial.
