At DASH, we showcased how Datadog allows teams to not only detect and understand issues, but also take immediate, informed action. This roundup highlights new capabilities that simplify automation and significantly enhance your processes across the board.
With Bits AI, you can build and execute workflows faster using natural language. We’ve also launched Kubernetes autoscaling and enhanced cost controls for AWS infrastructure to reduce the complexity of managing performance and costs.
Learn how these updates and more are designed to improve your organization’s operational efficiency. Then, check out our keynote roundup for other major announcements, including:
- LLM Experiments
- Archive Search
- Datadog Internal Developer Portal (IDP)
- Proactive App Recommendations
- And more
Accelerate automation with Bits AI
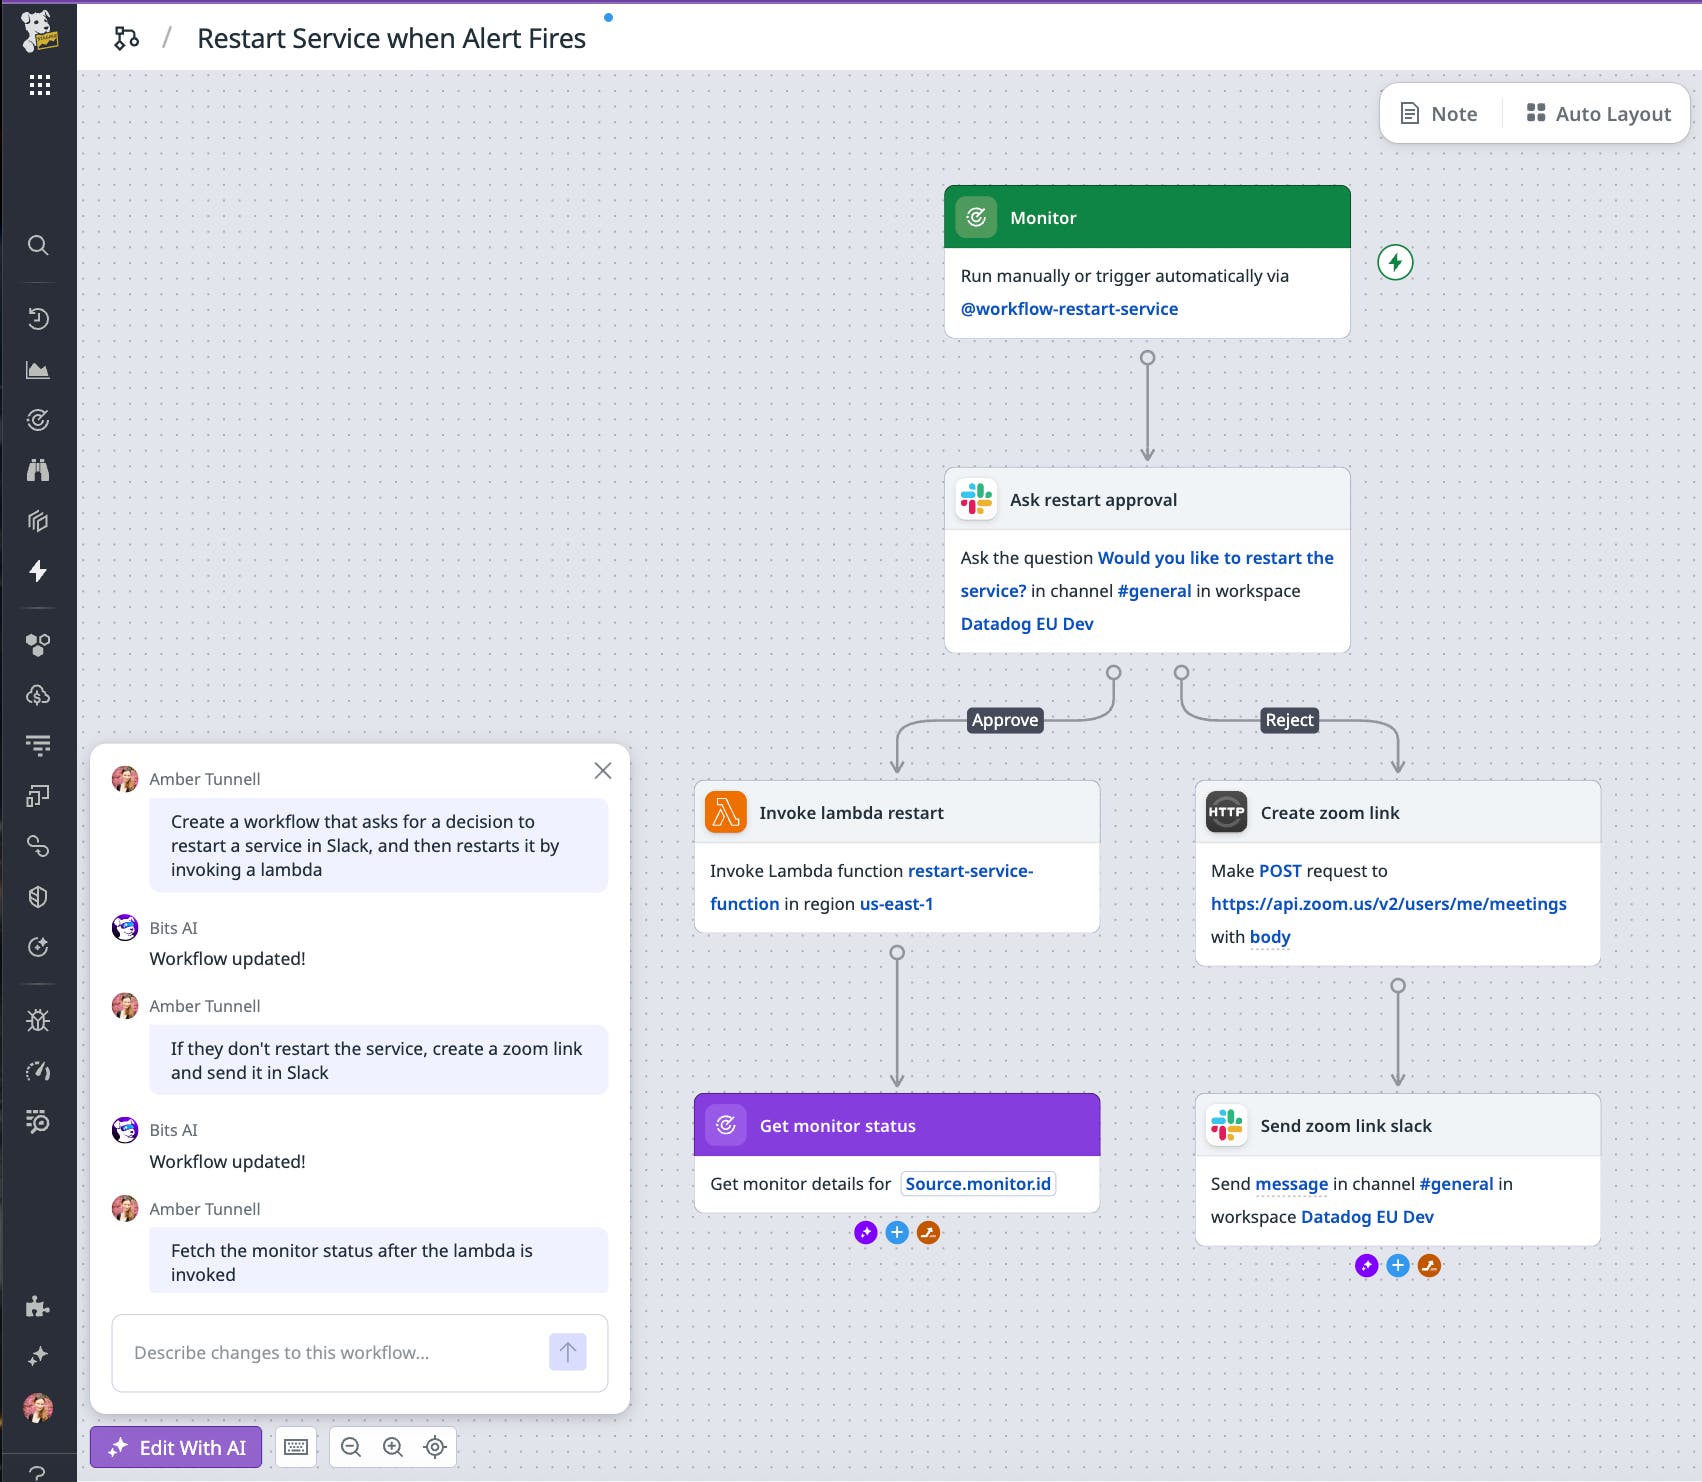
Build workflows faster using natural language with Bits AI
Build Datadog workflows faster and more intuitively with Bits AI. Just describe in natural language what you want to achieve—no YAML or scripting required. The Bits AI assistant can generate, edit, and iterate on workflows in real time, enabling you to go from idea to automation in seconds.
Examples of what you can ask include:
- “Create a workflow that invokes a Lambda function when a monitor triggers, then checks again in 5 minutes to confirm if the alert is still active.”
- “When a monitor fires, summarize the incident using AI, aggregate related logs and metrics, and send the package to my team via Slack.”
- “Build a workflow that automatically blocks suspicious Okta users when a specific security signal is detected.”
This functionality is now available to all customers. For more information, see our documentation.
Accelerate Kubernetes issue resolution with AI-powered guided remediation
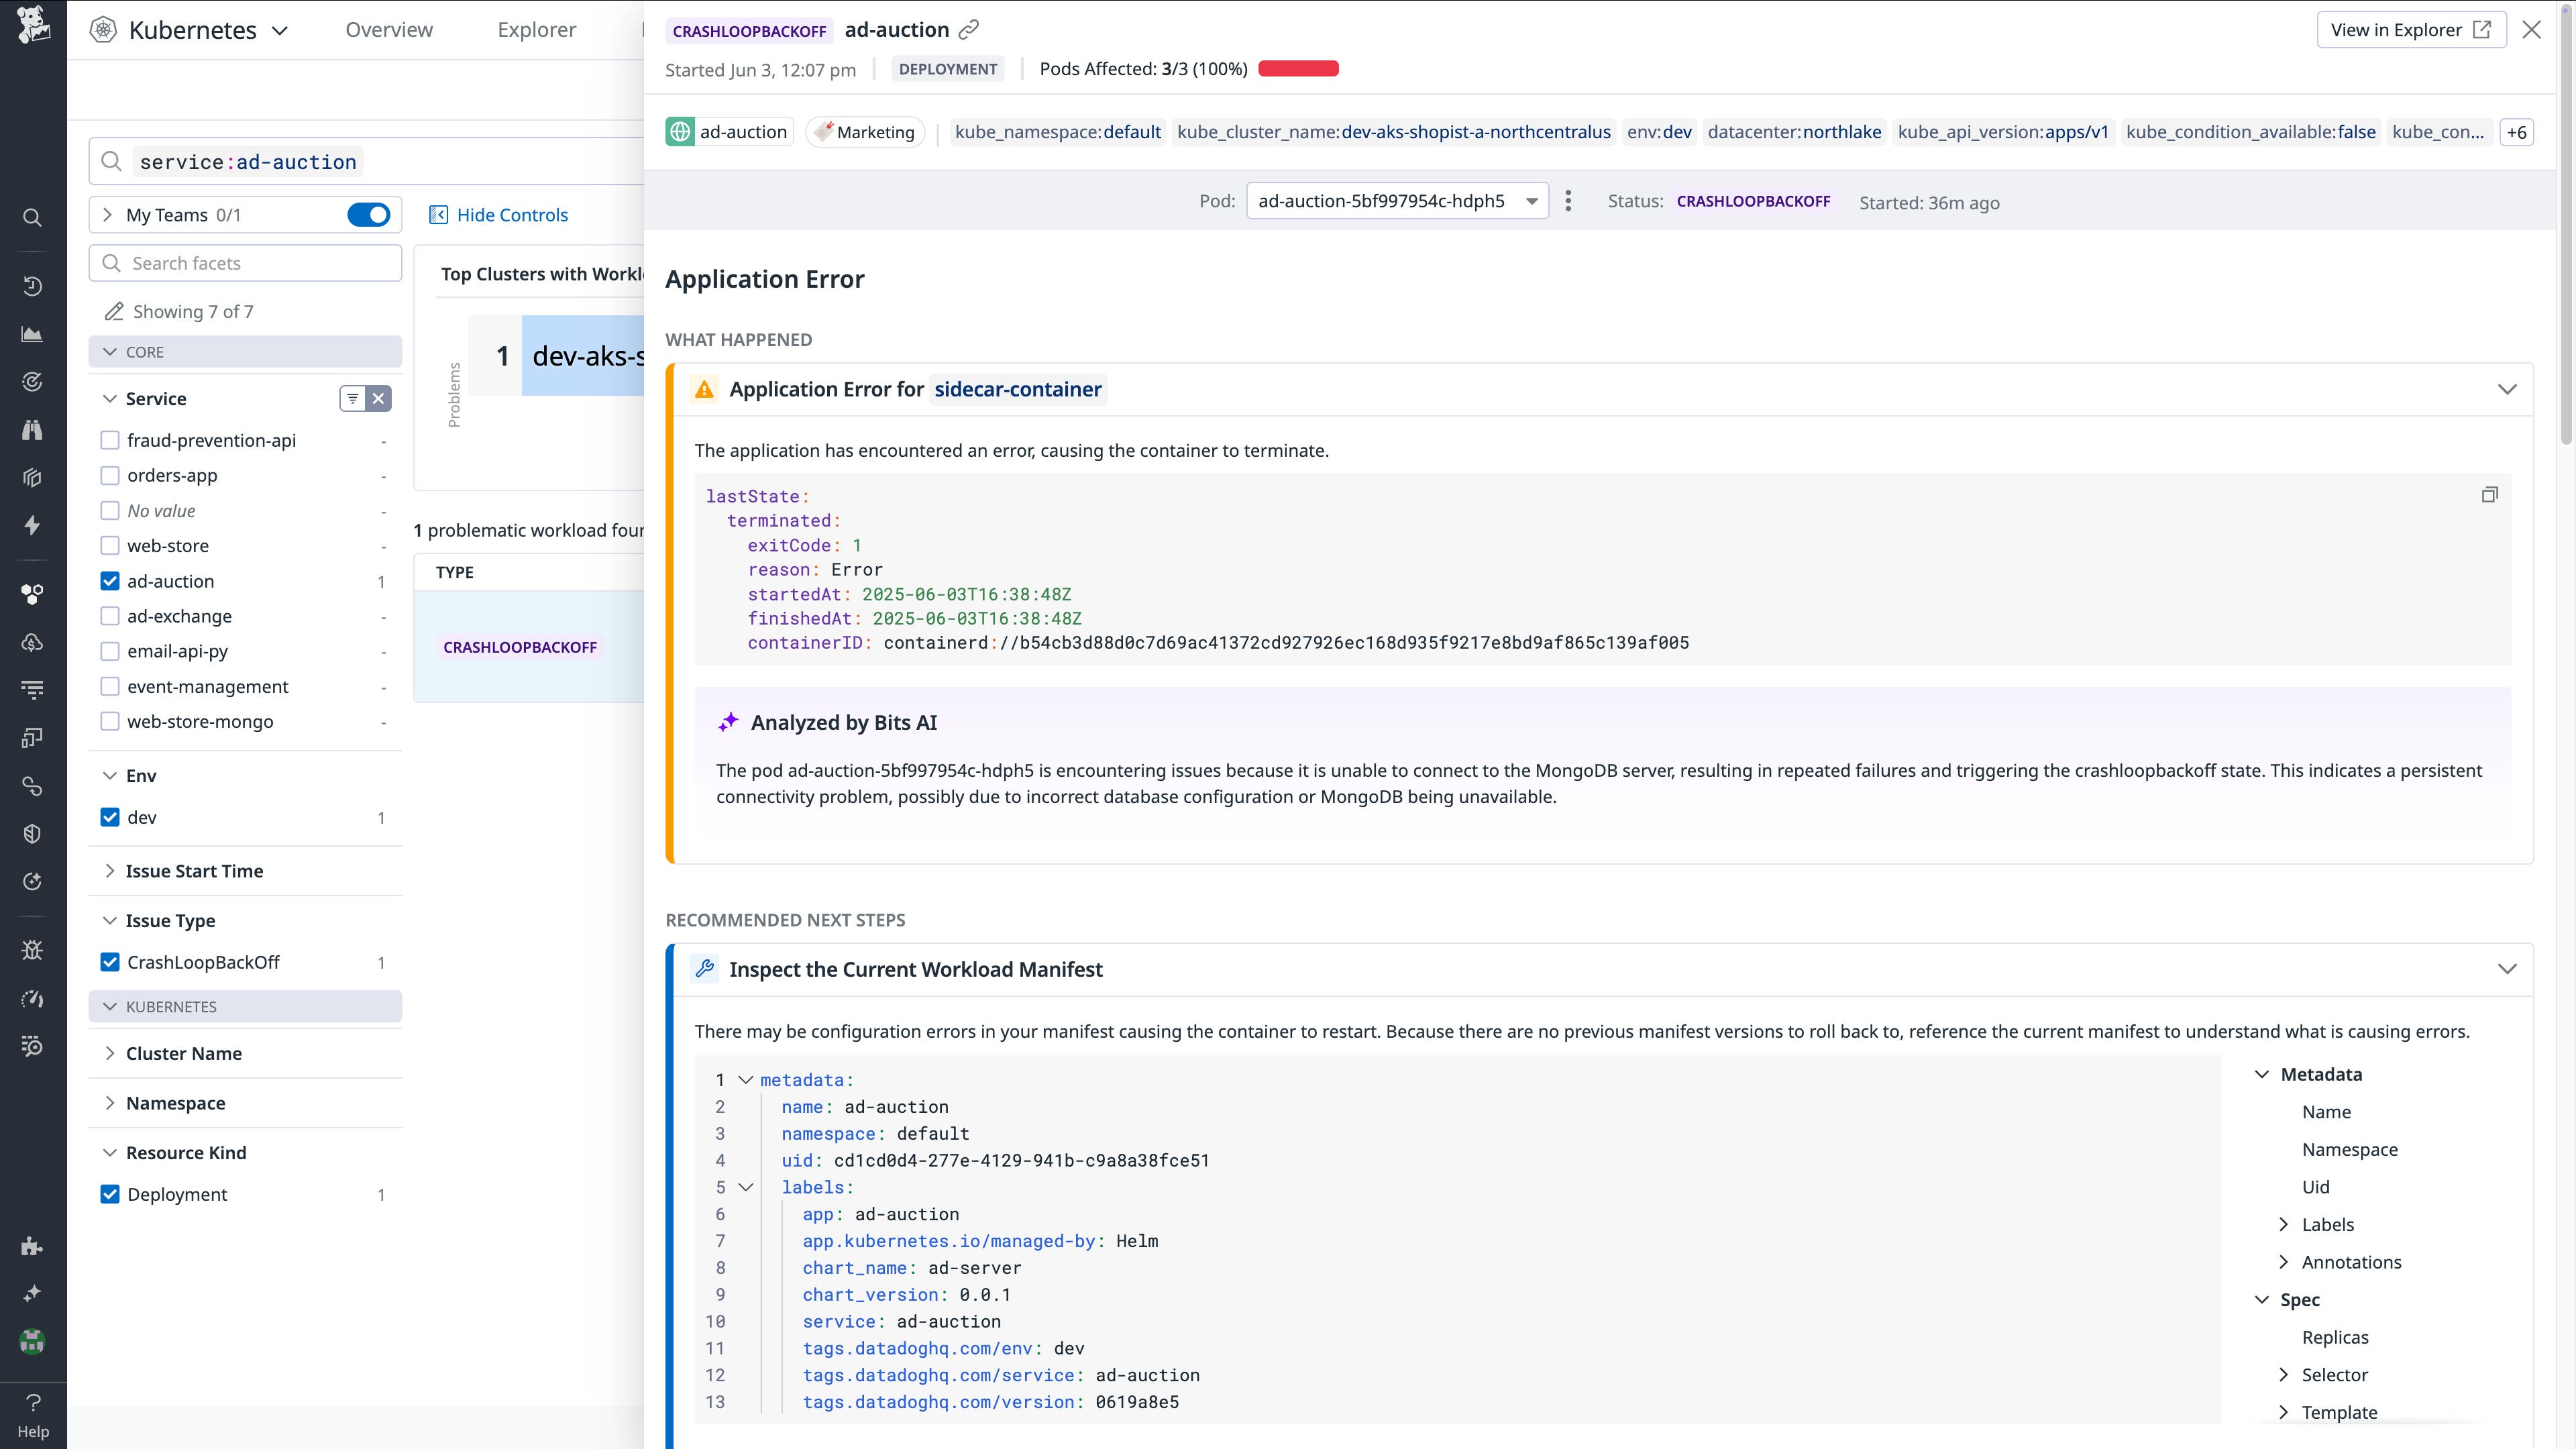
Datadog Kubernetes Active Remediation, currently available in Preview, helps you identify and fix common infrastructure issues in your Kubernetes clusters by providing clear contextual guidance and suggested actions. Now, we’re excited to announce the latest enhancement to Kubernetes Active Remediation: AI-powered explanations that provide deeper insights into the root cause of issues. When an issue occurs, the issue summary now includes AI analysis that is based on collected telemetry data and known patterns. This capability facilitates faster investigations and reduced mean time to resolution (MTTR). To get started, check out our blog post or sign up to join the Preview.
Take action from within Datadog
Cancel long-running or blocking queries directly in Database Monitoring
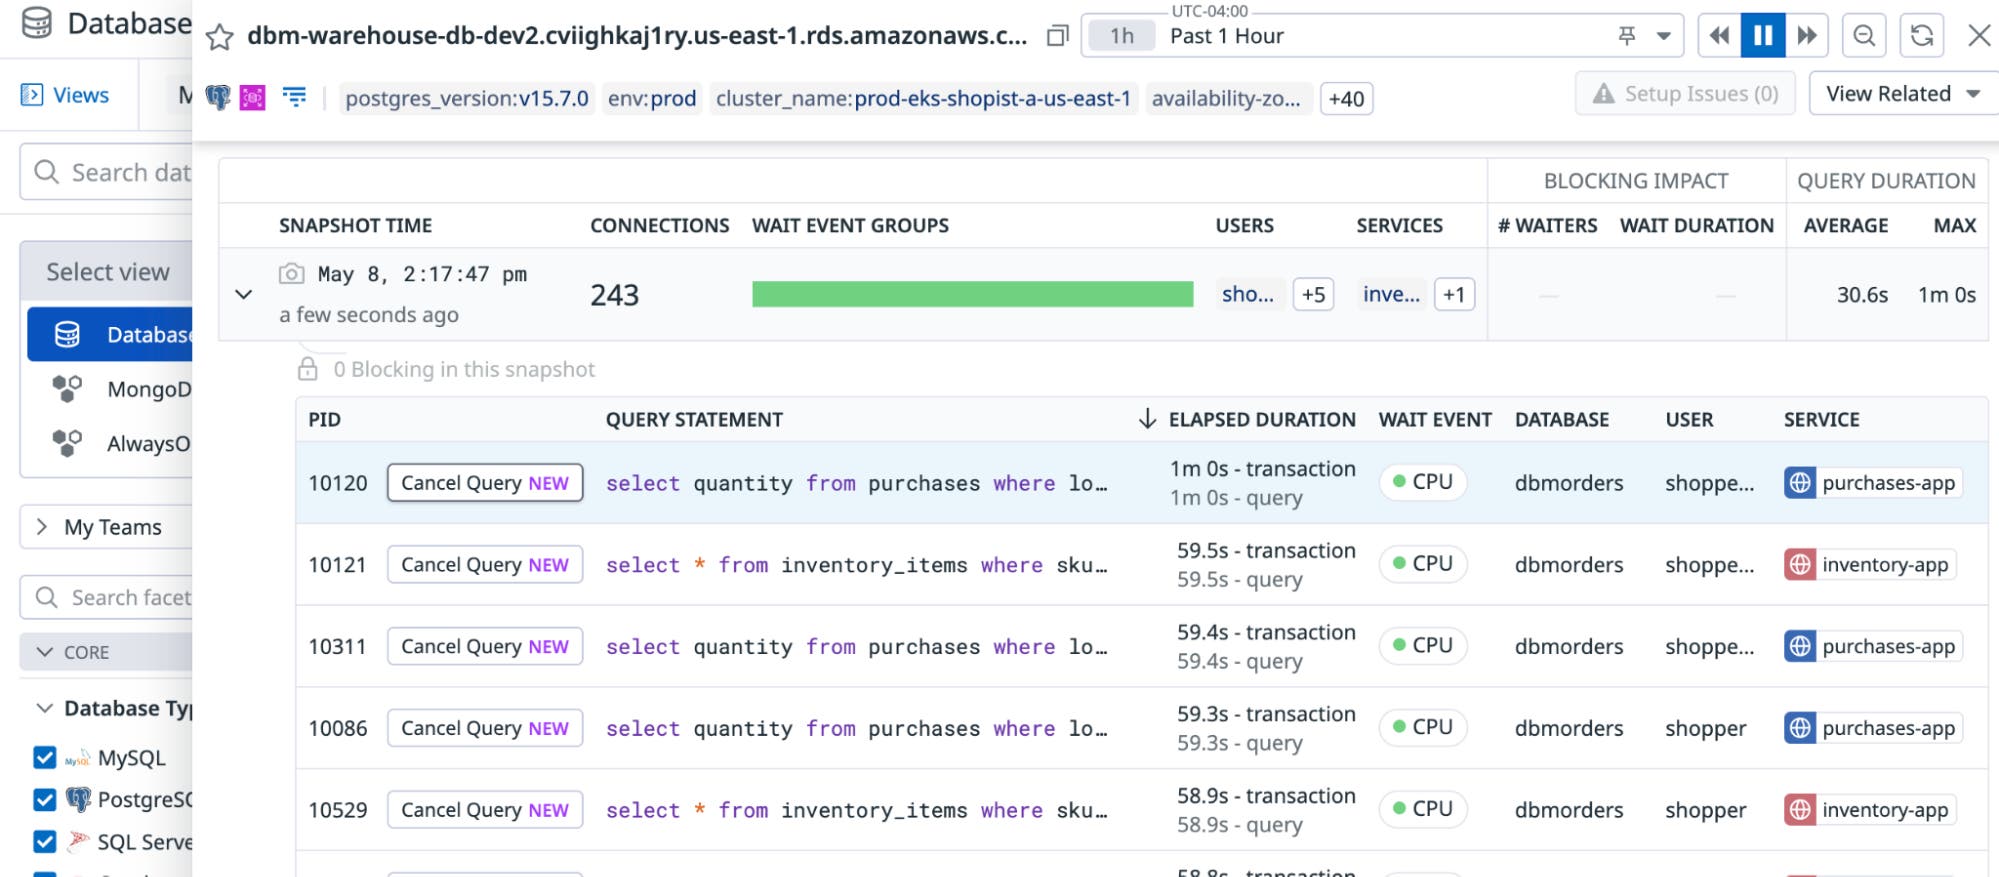
You can now terminate long-running or blocking queries directly from Datadog Database Monitoring, without needing to log into the database. This capability is now embedded within both the Active Connections tab and Database Monitoring Recommendations, allowing immediate remediation of query-related issues in Postgres environments.
By integrating query cancellation into the Datadog UI, engineers can take direct action at the point of detection, reducing MTTR and eliminating the need to context switch into database consoles or additional third-party tools. Teams can even set up approval workflows in Datadog to approve via Slack or Microsoft Teams, to align with existing policies and operations. This feature is now available in Preview; contact your Customer Success representative to get started.
Remediate SQS issues in real time by inspecting dead-letter queue messages in Data Streams Monitoring
For applications relying on Amazon SQS, dead-letter queue activity is a clear signal of a problem. But detecting this traditionally means setting up manual alerts, and resolving issues requires developers to build tools to inspect messages in order to see their contents and better understand why they couldn’t be processed.
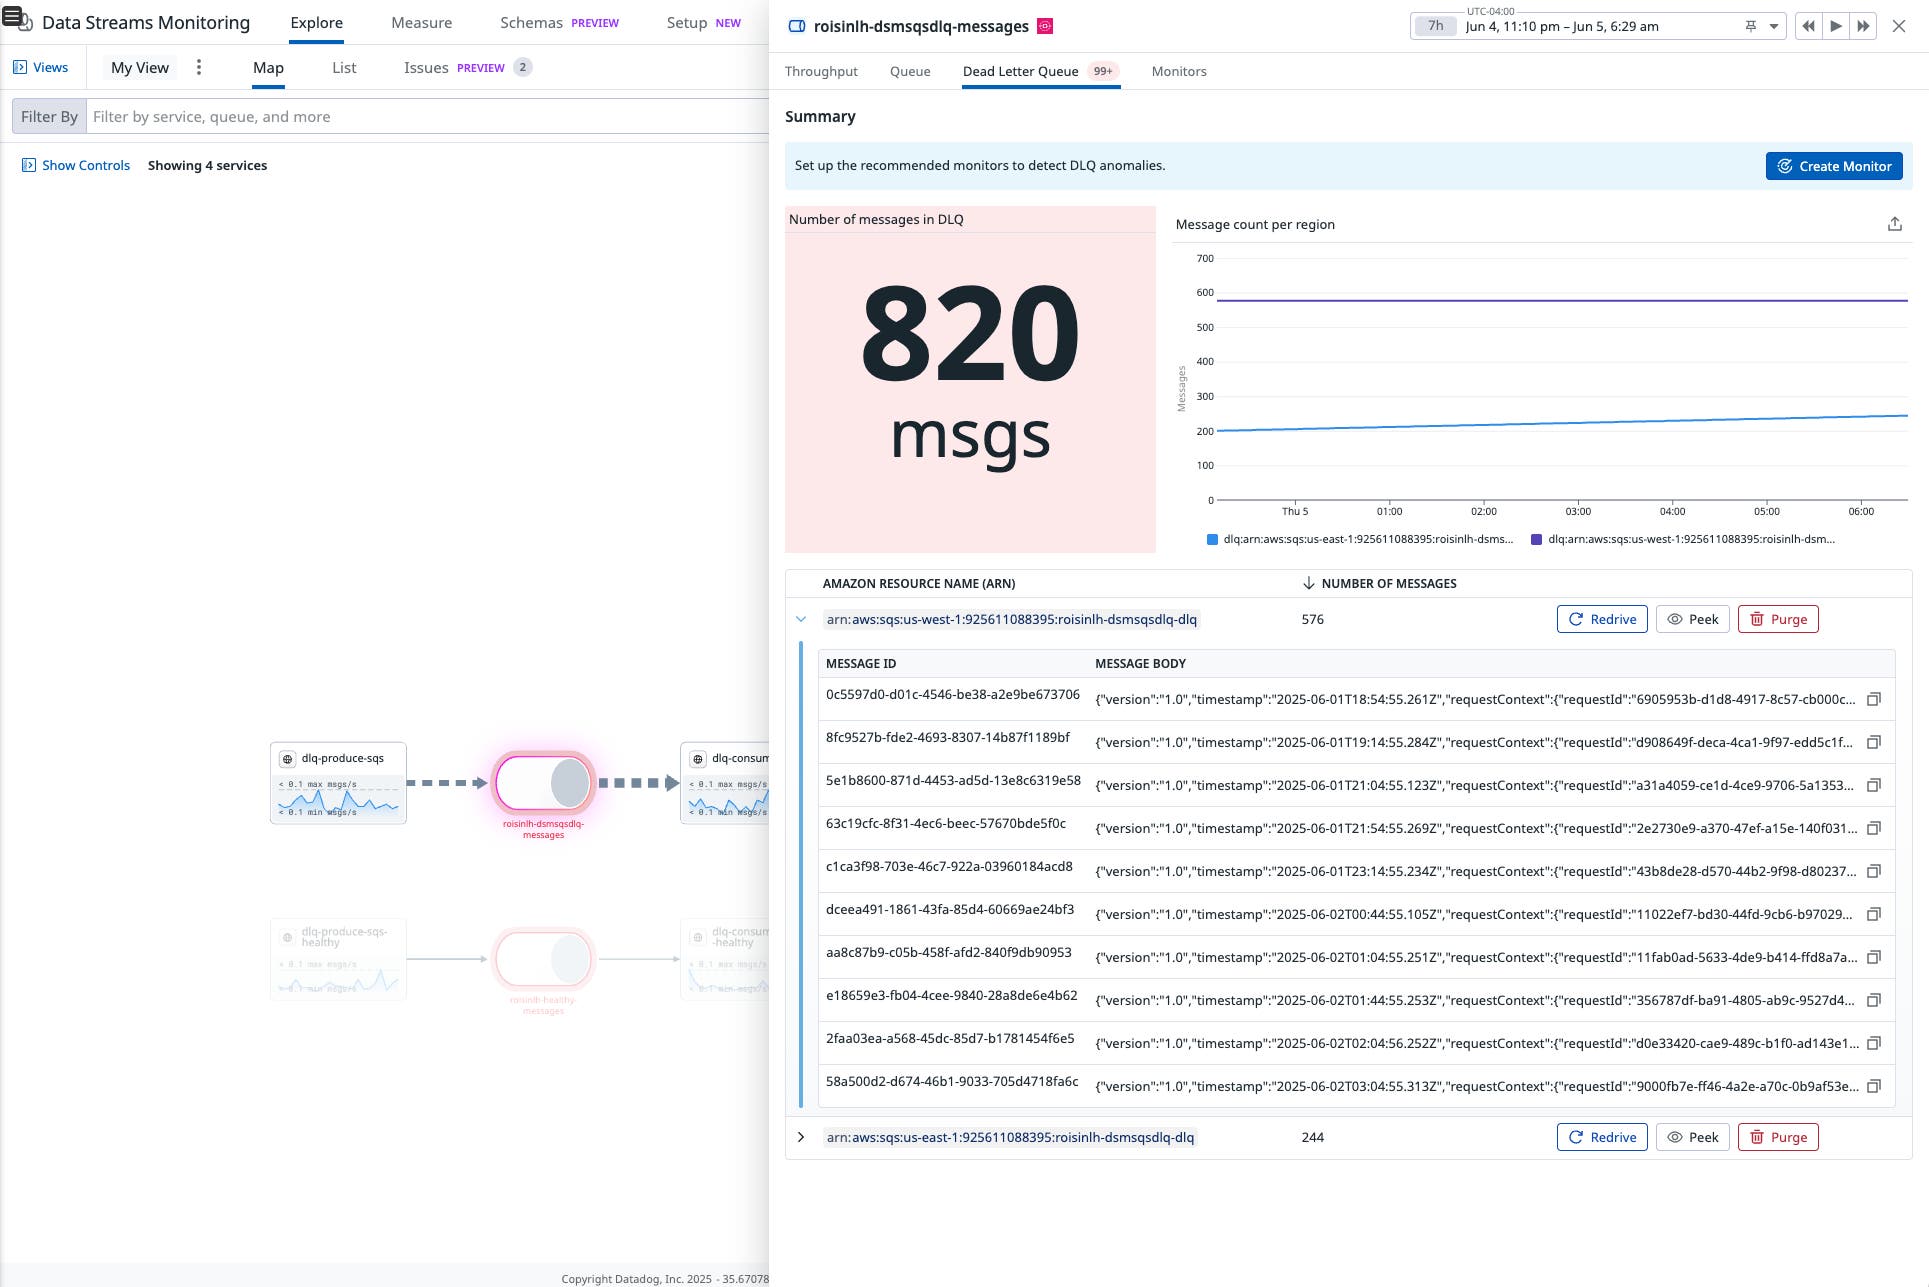
Now users can investigate and manage their dead-letter queue messages directly in Data Streams Monitoring. When DSM detects dead-letter queue activity, users will see that queue highlighted on the map view. From there users can:
- “Peek” into (or view) individual messages for real-time inspection
- “Redrive” messages viewed back to the source queue
- “Purge” the dead-letter queue to reset things after troubleshooting
We’re excited to provide these detection and resolution options to teams debugging messages directly in Data Stream Monitoring and look forward to your feedback. Dead-Letter queue activity detection and message visibility capabilities are now in Preview. Sign up here.
Take action on AWS recommendations in Cloud Cost Management
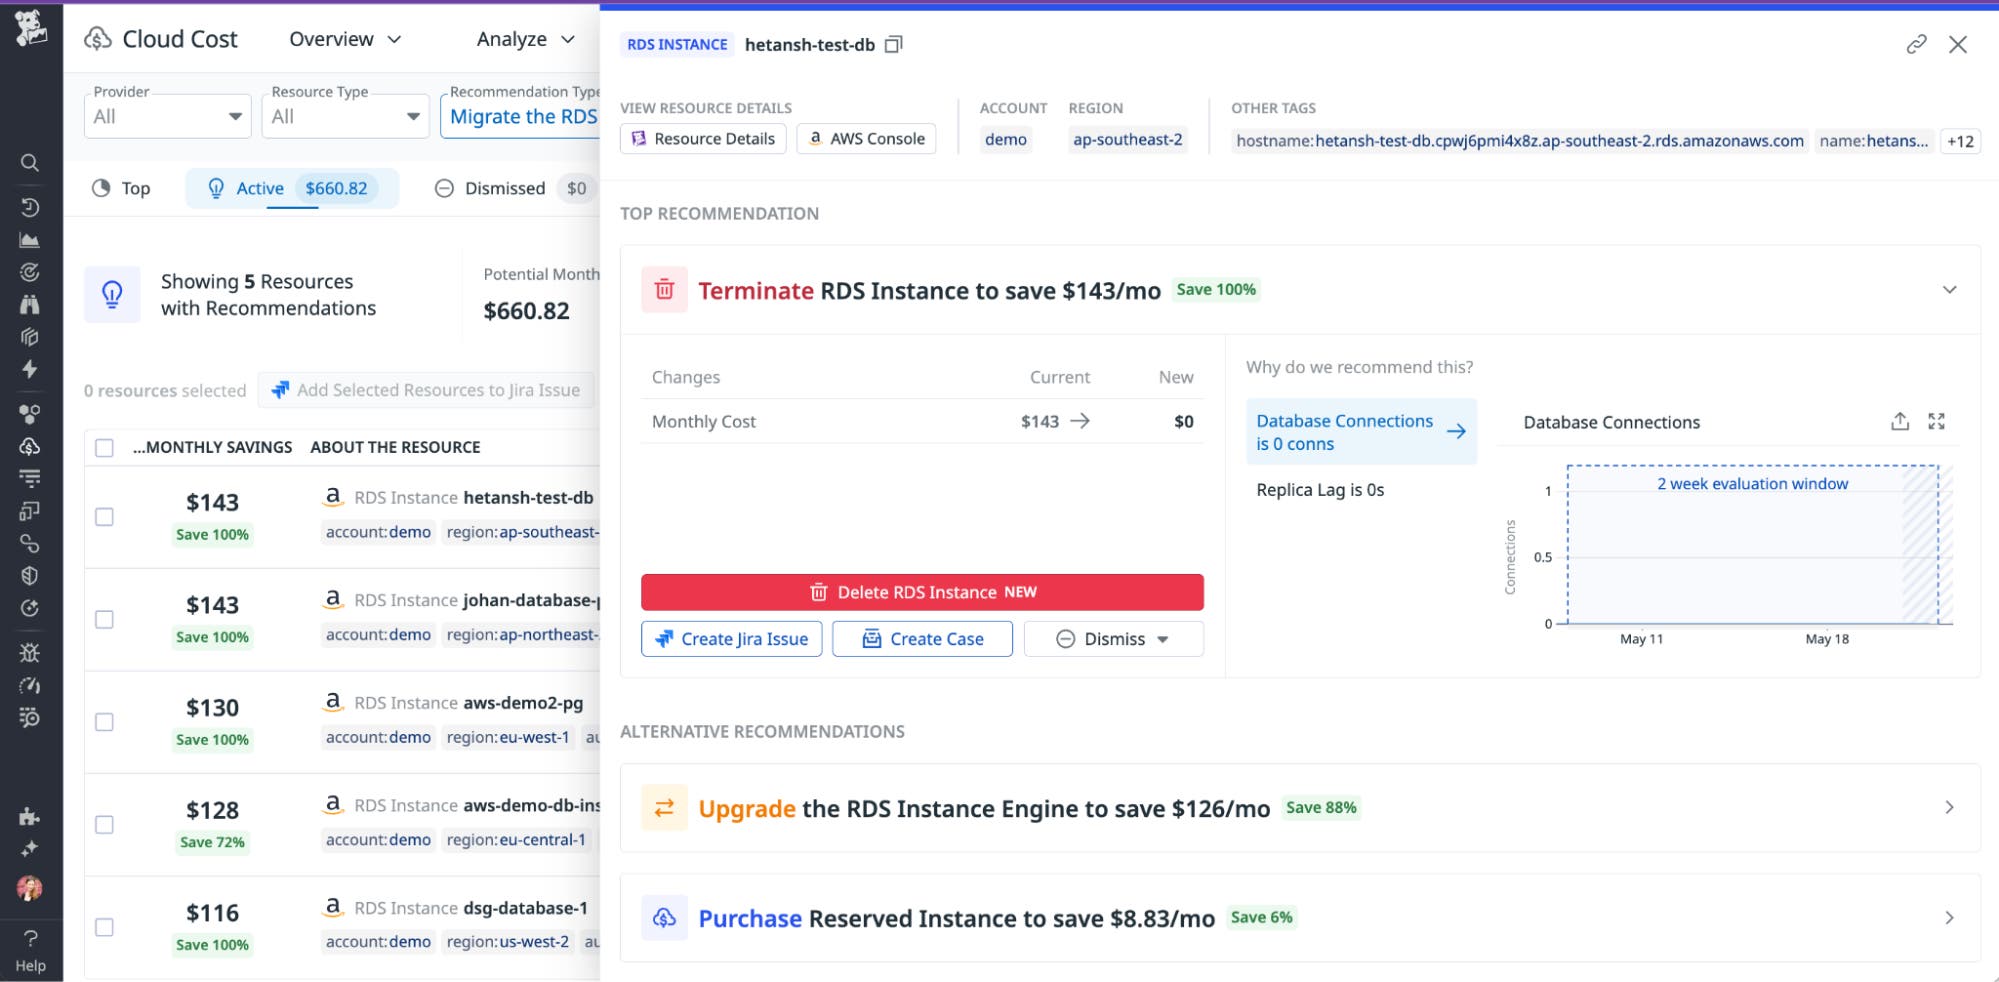
Accelerate cloud cost optimization by taking direct action on AWS recommendations within Datadog. You can now delete unused EBS volumes, terminate idle RDS instances, upgrade S3 storage classes to Intelligent-Tiering, and more directly from Datadog Cloud Cost Management.
Traditionally, acting on cost recommendations required switching to a different tool in order to prepare and deploy changes, for example by manually logging into AWS and navigating to the correct account and resource in order to execute changes. Datadog removes this friction by integrating actionable insights with direct resource controls in the Cloud Cost Management UI. You can immediately apply the recommended changes to your AWS infrastructure without needing to switch to another tool. See our documentation for more information.
Store, manage, and retrieve data from your apps and workflows with Datastore
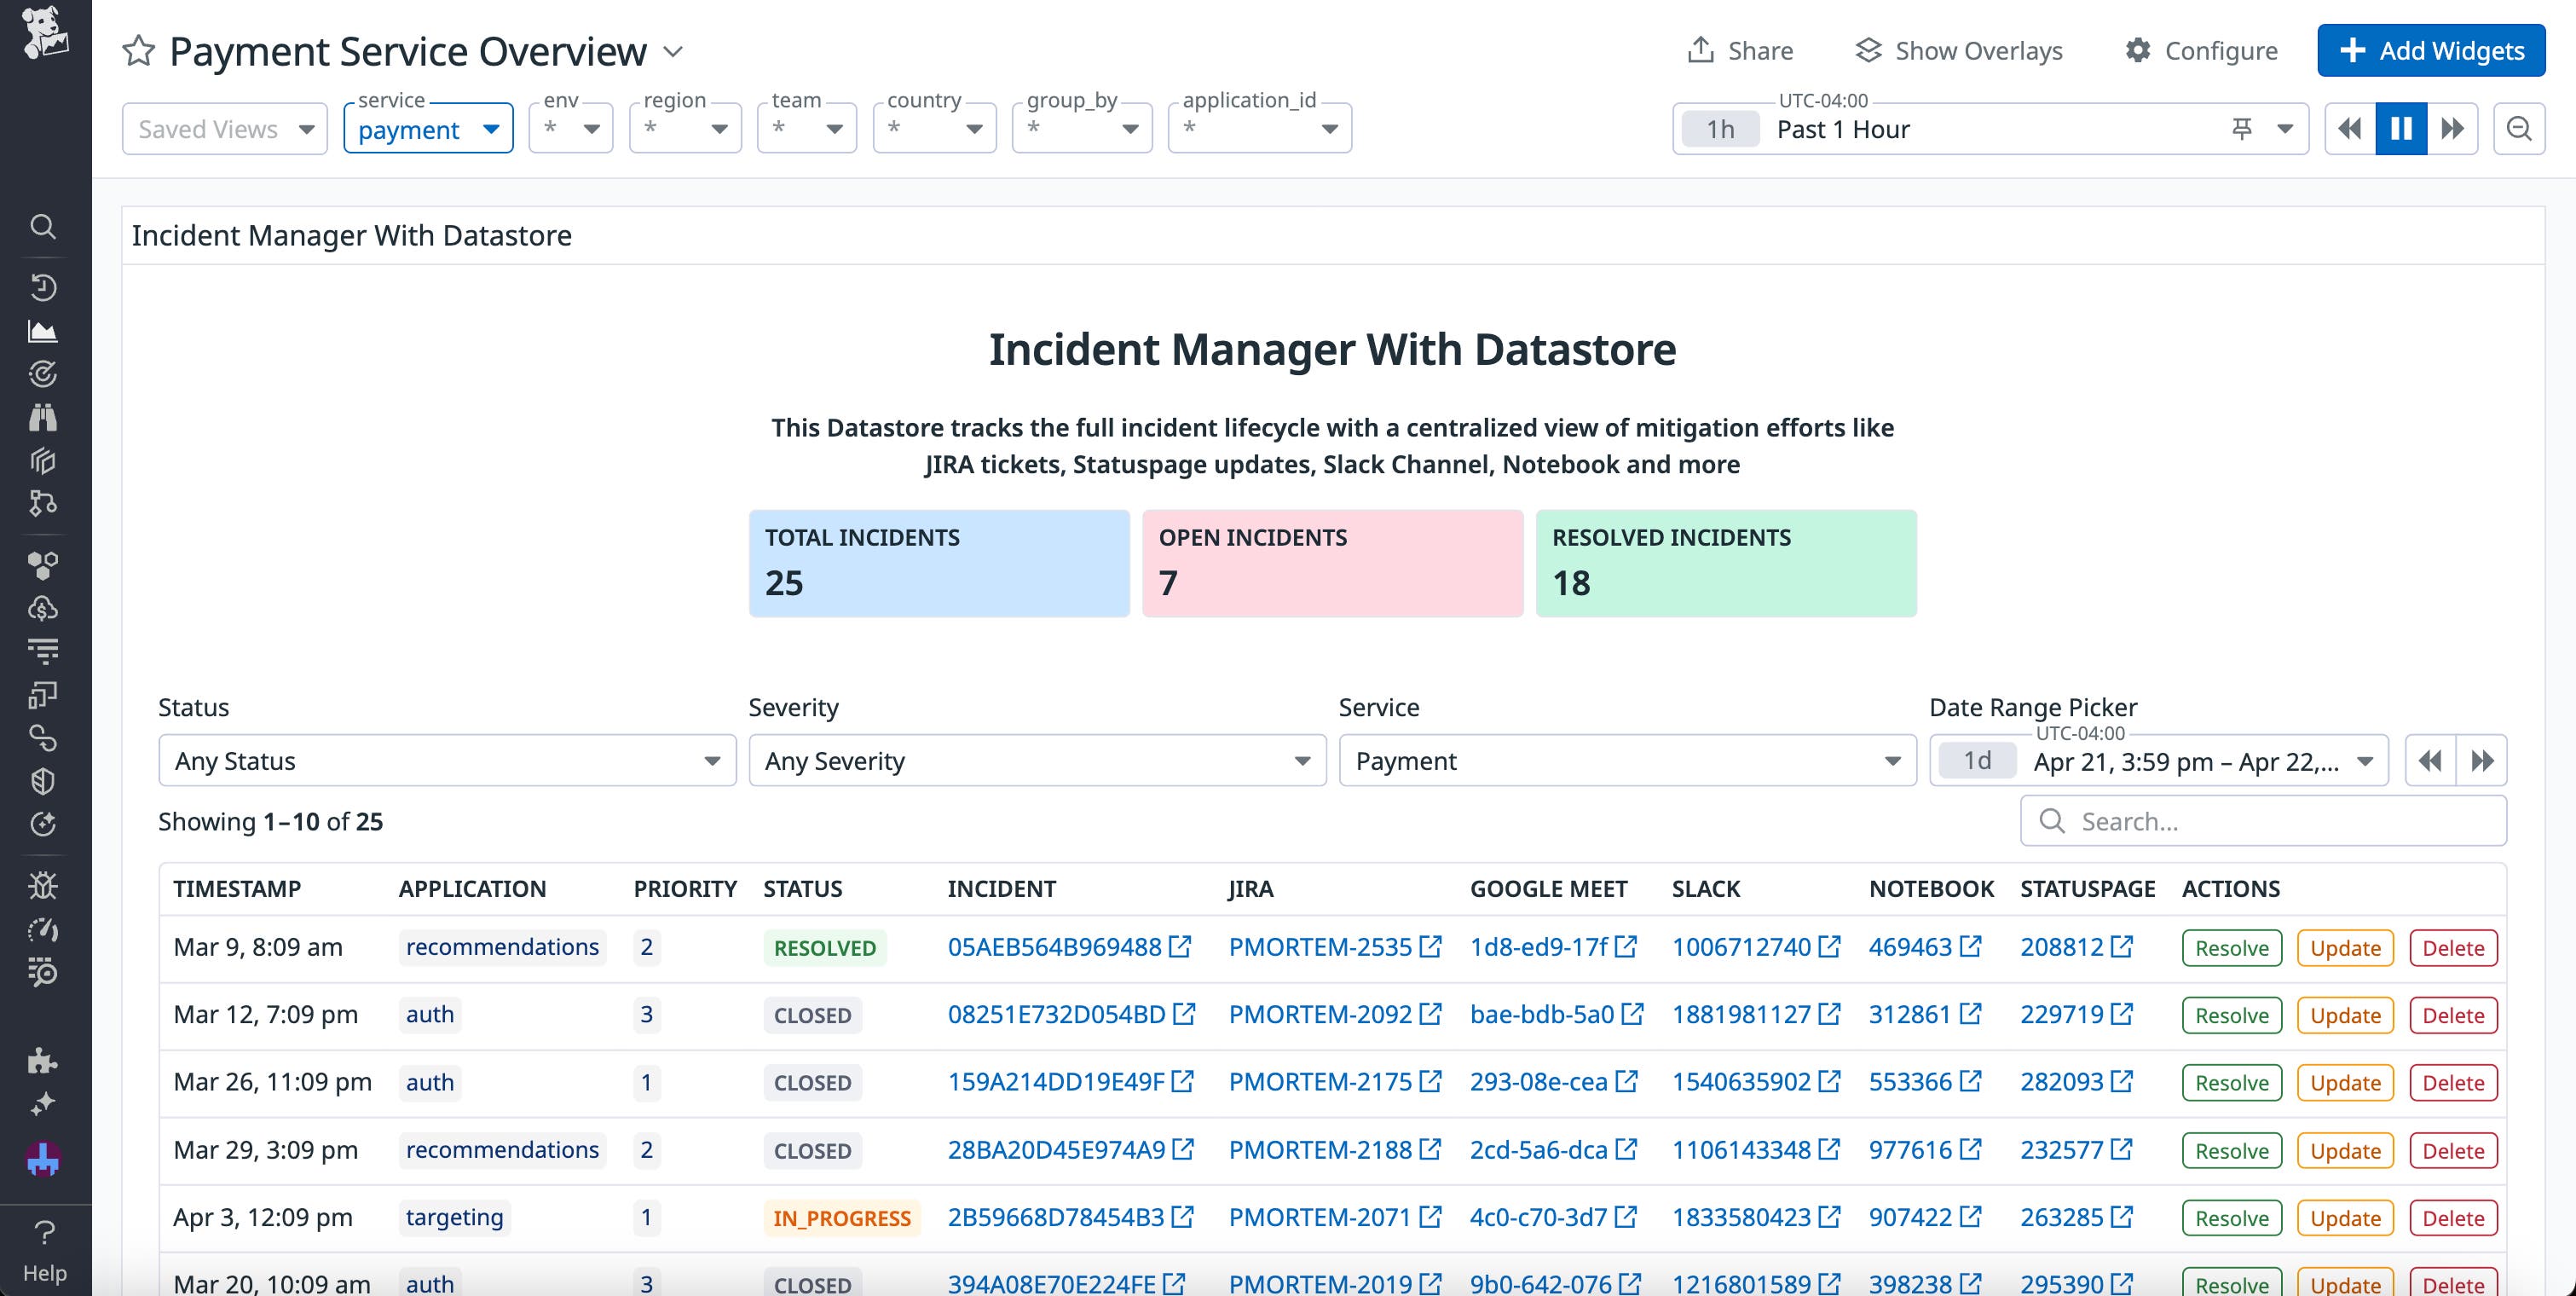
Datastore is a native Datadog database system that enables you to store, manage, and retrieve data across apps and workflows—without needing external storage or infrastructure. Using Datastore’s data persistence, you can build stateful automations, reuse configuration, or build multi-step logic across executions. Datastore provides shared data storage that includes:
- Fast lookups and updates at runtime across all apps and workflows
- Flexible schemas that support complex fields, including JSON objects and column updates
- Collaboration tools such as a dedicated UI, out-of-the-box actions, and RBAC support
To learn more about Datastore, you can read our blog post.
Scale your Kubernetes workloads automatically with Datadog
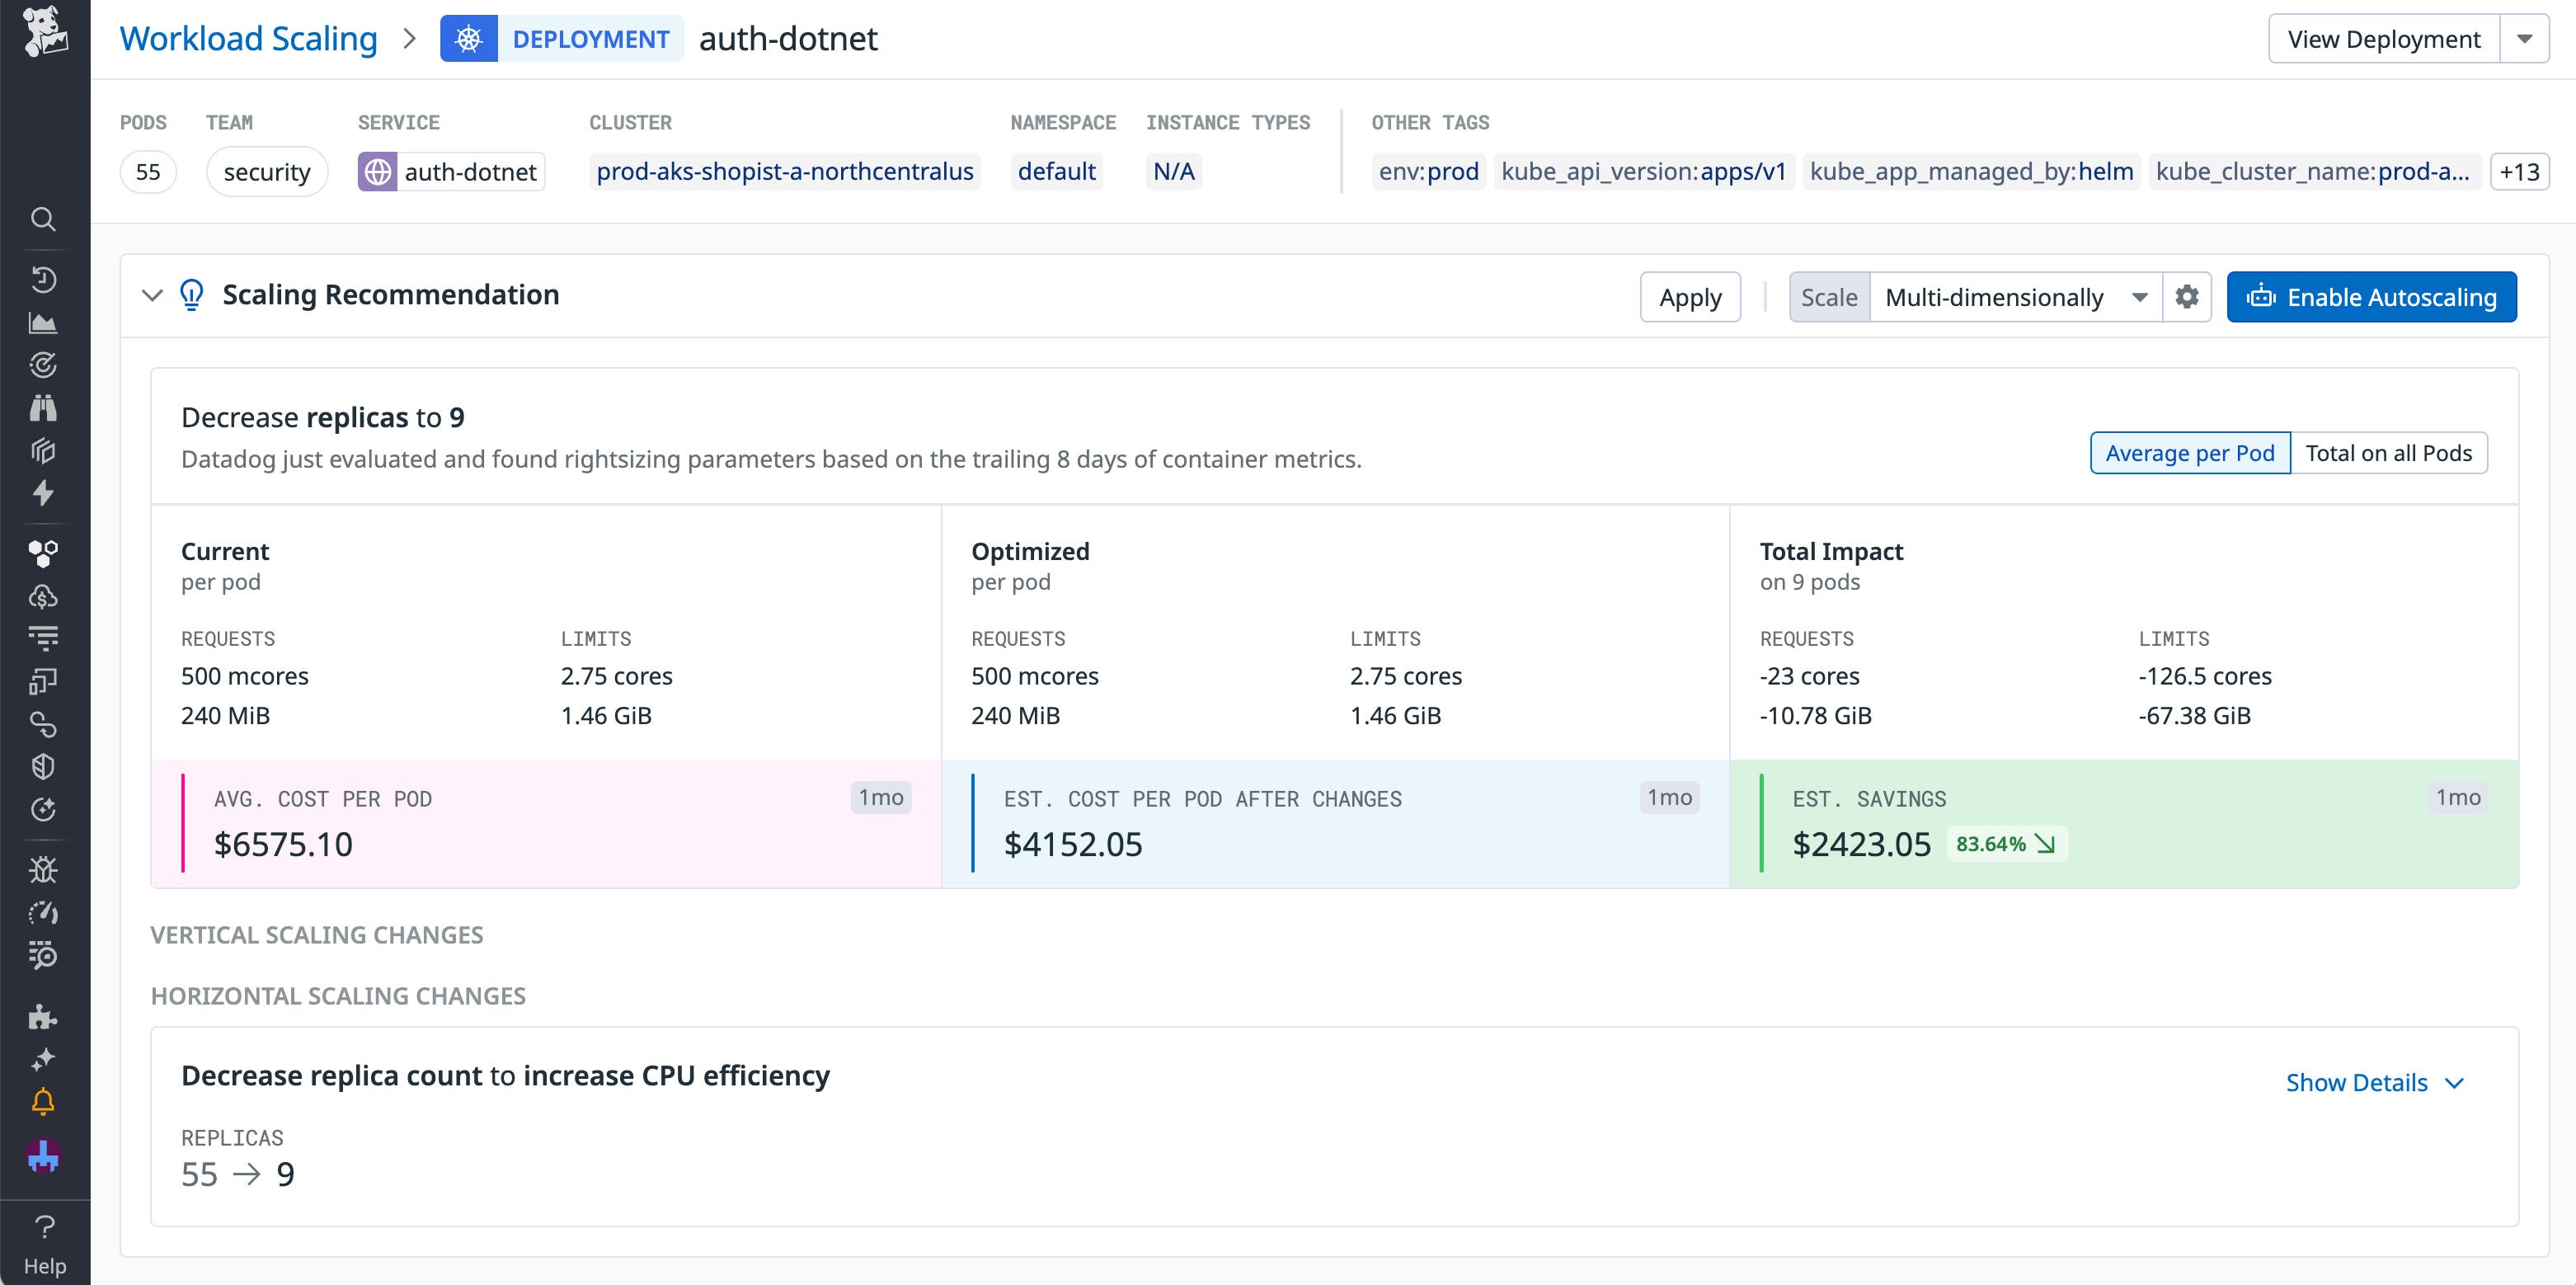
The vast majority of Kubernetes workloads are overprovisioned—as a result, rightsizing your workloads has the potential to deliver significant savings. However, balancing cost efficiency with cluster performance can be challenging. Datadog Kubernetes Autoscaling—now GA—provides multi-dimensional rightsizing for your applications without impacting stability, with automation to easily manage your entire footprint and visibility into the Datadog telemetry backing each recommendation. You can autoscale your workloads either directly from Datadog or via your existing GitOps workflows. Check out our blog post to learn more.
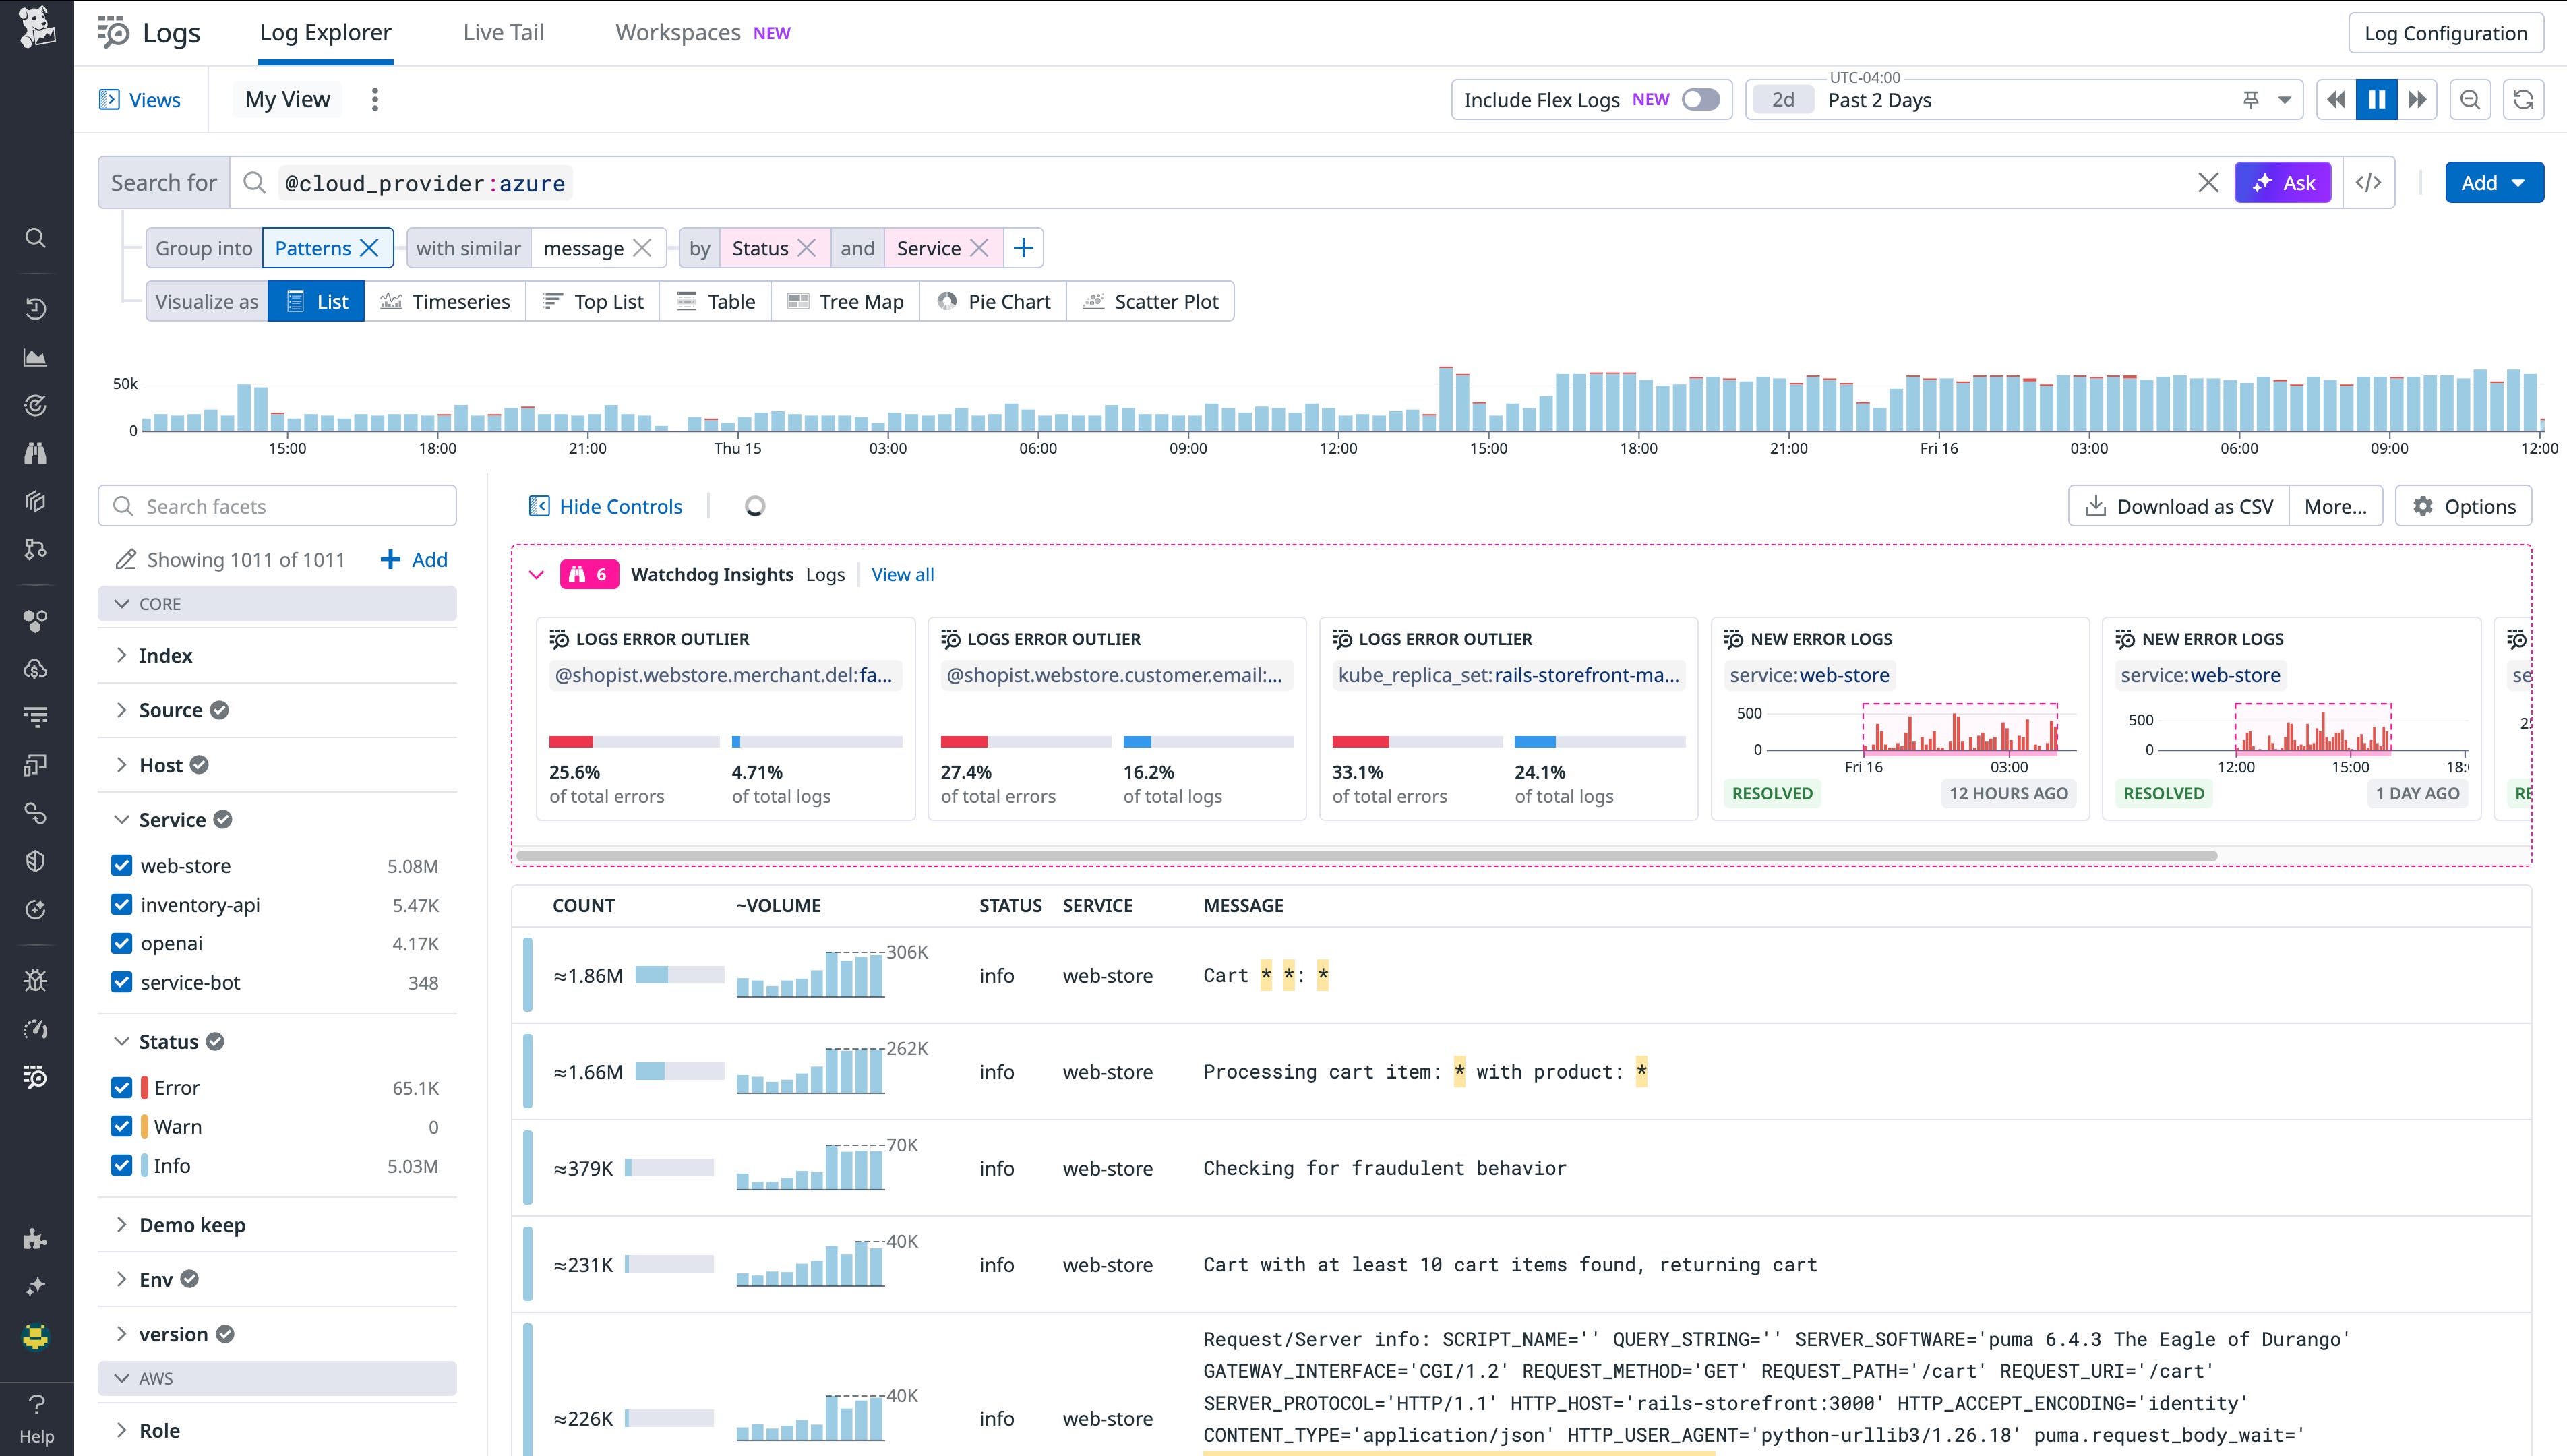
Automate the forwarding of Azure logs into Datadog
Managing logs across multiple Azure services is typically a complex task that requires teams to configure various logging pipelines to normalize log formats and define log storage destinations. These pipelines require ongoing maintenance, and the manual effort involved can lead to misconfigurations and delays in identifying issues for Azure-hosted workloads. Datadog now automates the collection and streaming of Azure logs into Datadog in real time, simplifying setup and maintenance while saving time and effort. This automation of Azure log forwarding boosts operational efficiency and helps organizations monitor application health and security across Azure-hosted workloads in a reliable way. Read our blog post to learn more.
Deploy code safely with CD gating in Datadog
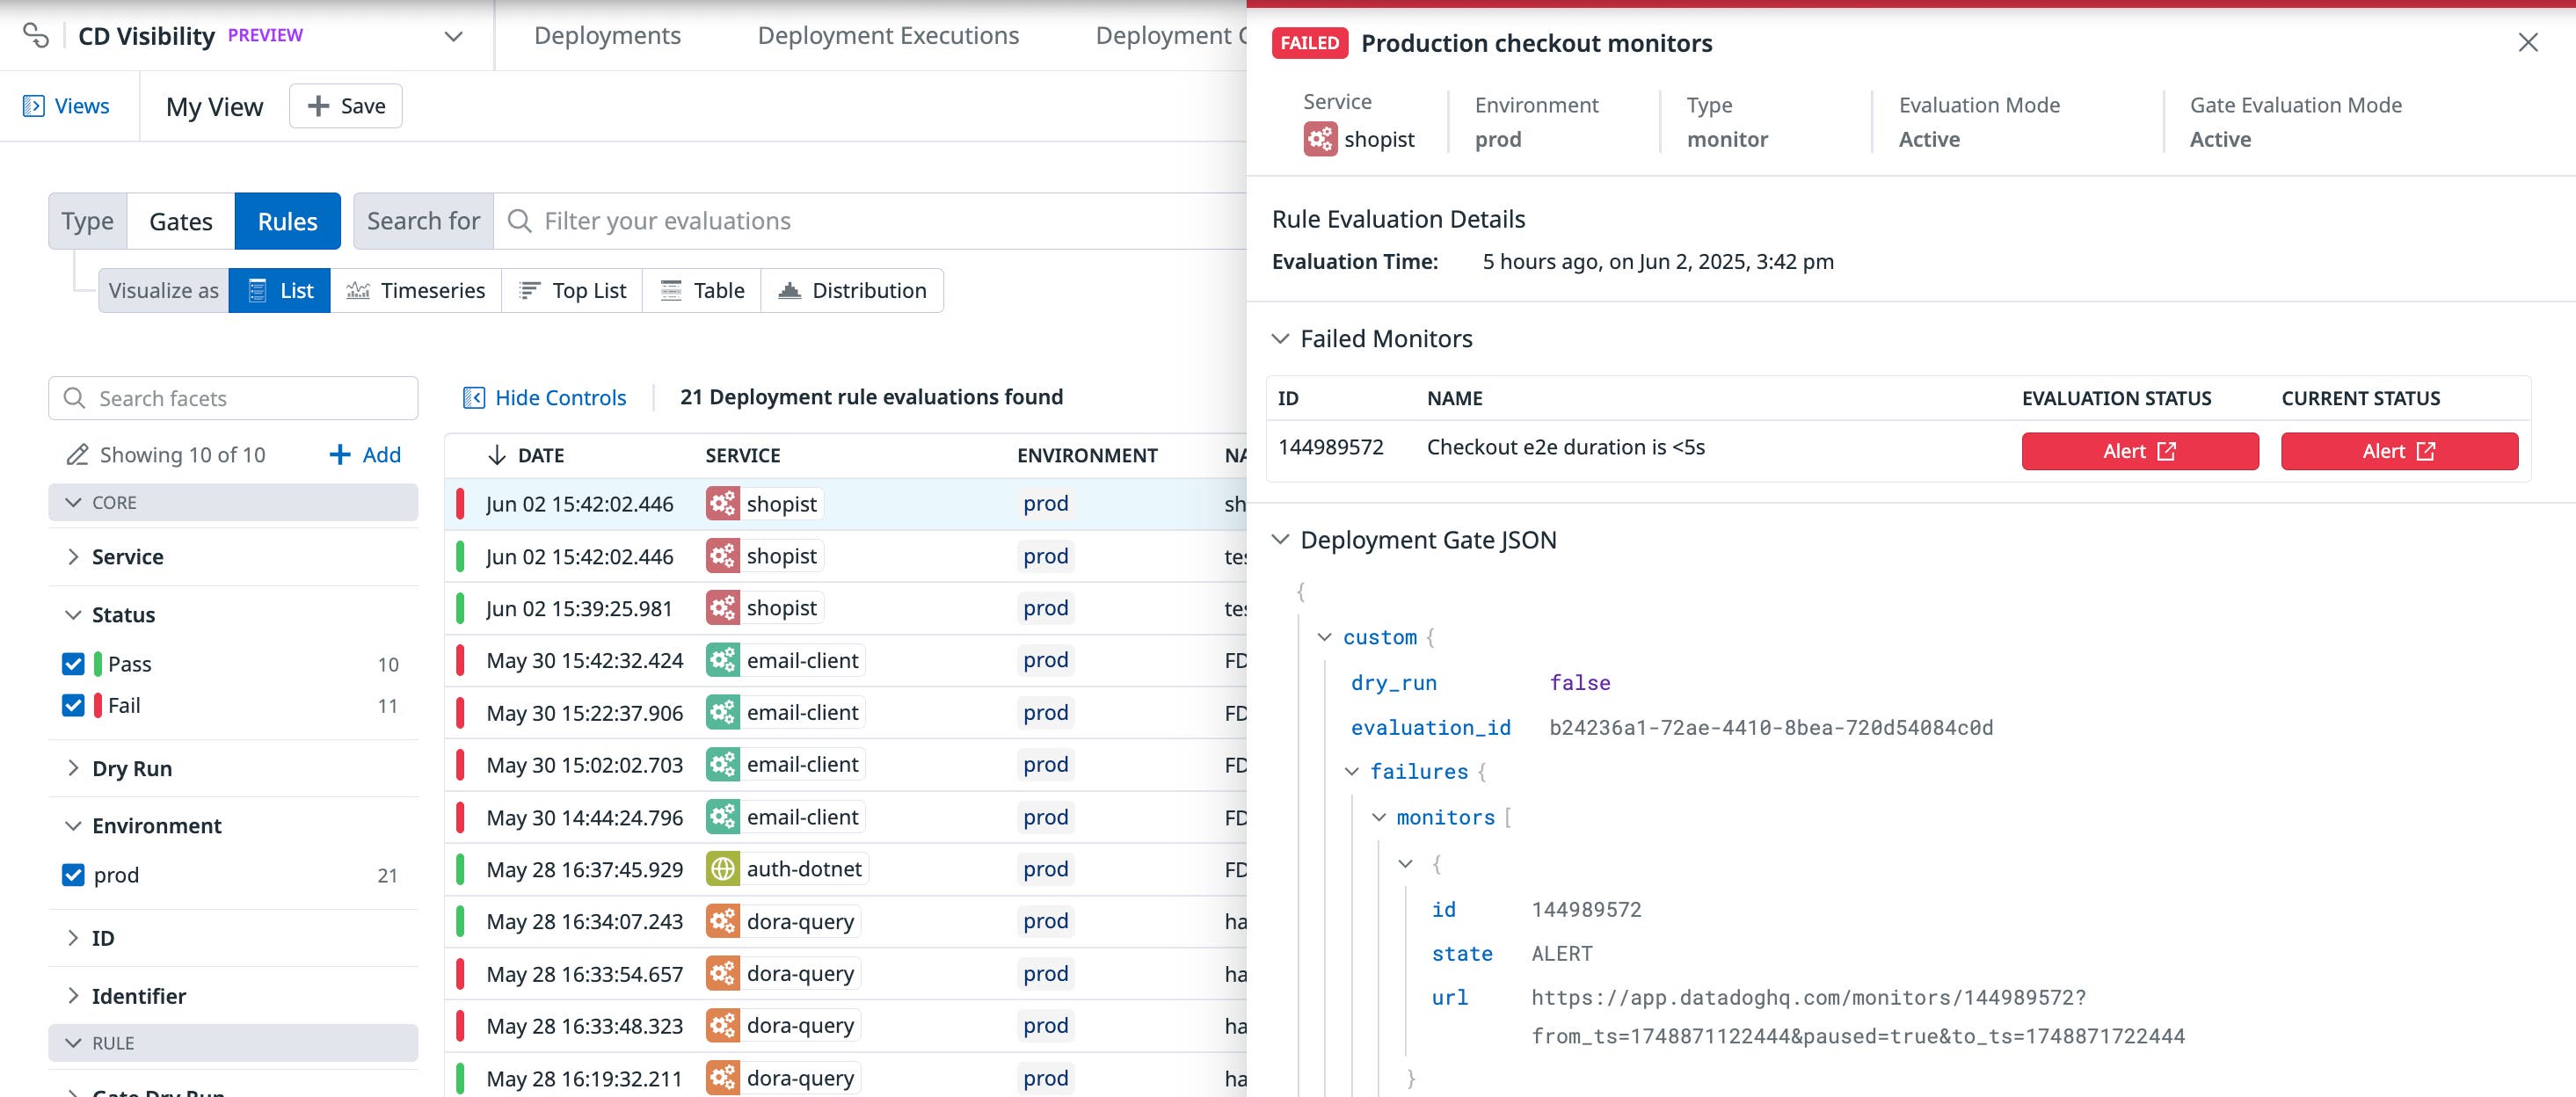
Datadog now lets you gate deployments using logs, APM, error tracking, infrastructure, network data—and more. This capability enables you to configure monitor rules that enforce deployment quality without writing complex queries for every service. This gives you a scalable way to apply gating logic across teams and services, with limited additional configuration work on each team.
You can also create APM Faulty Deployment rules that automatically detect statistically significant increases in error rate per endpoint, as well as new error types (e.g., unseen stack traces). This helps you get a baseline gating for all services, with no configuration work on each team.
Meanwhile, you can also track failure rates for your CD gates in the Datadog UI, helping reduce false positives and build trust in the gating process. And when a gate fails, developers can investigate the event in Datadog—no need to context switch into your CI/CD provider’s UI.
To join the Preview, fill out this form.
Orchestrate collaboration across teams and environments
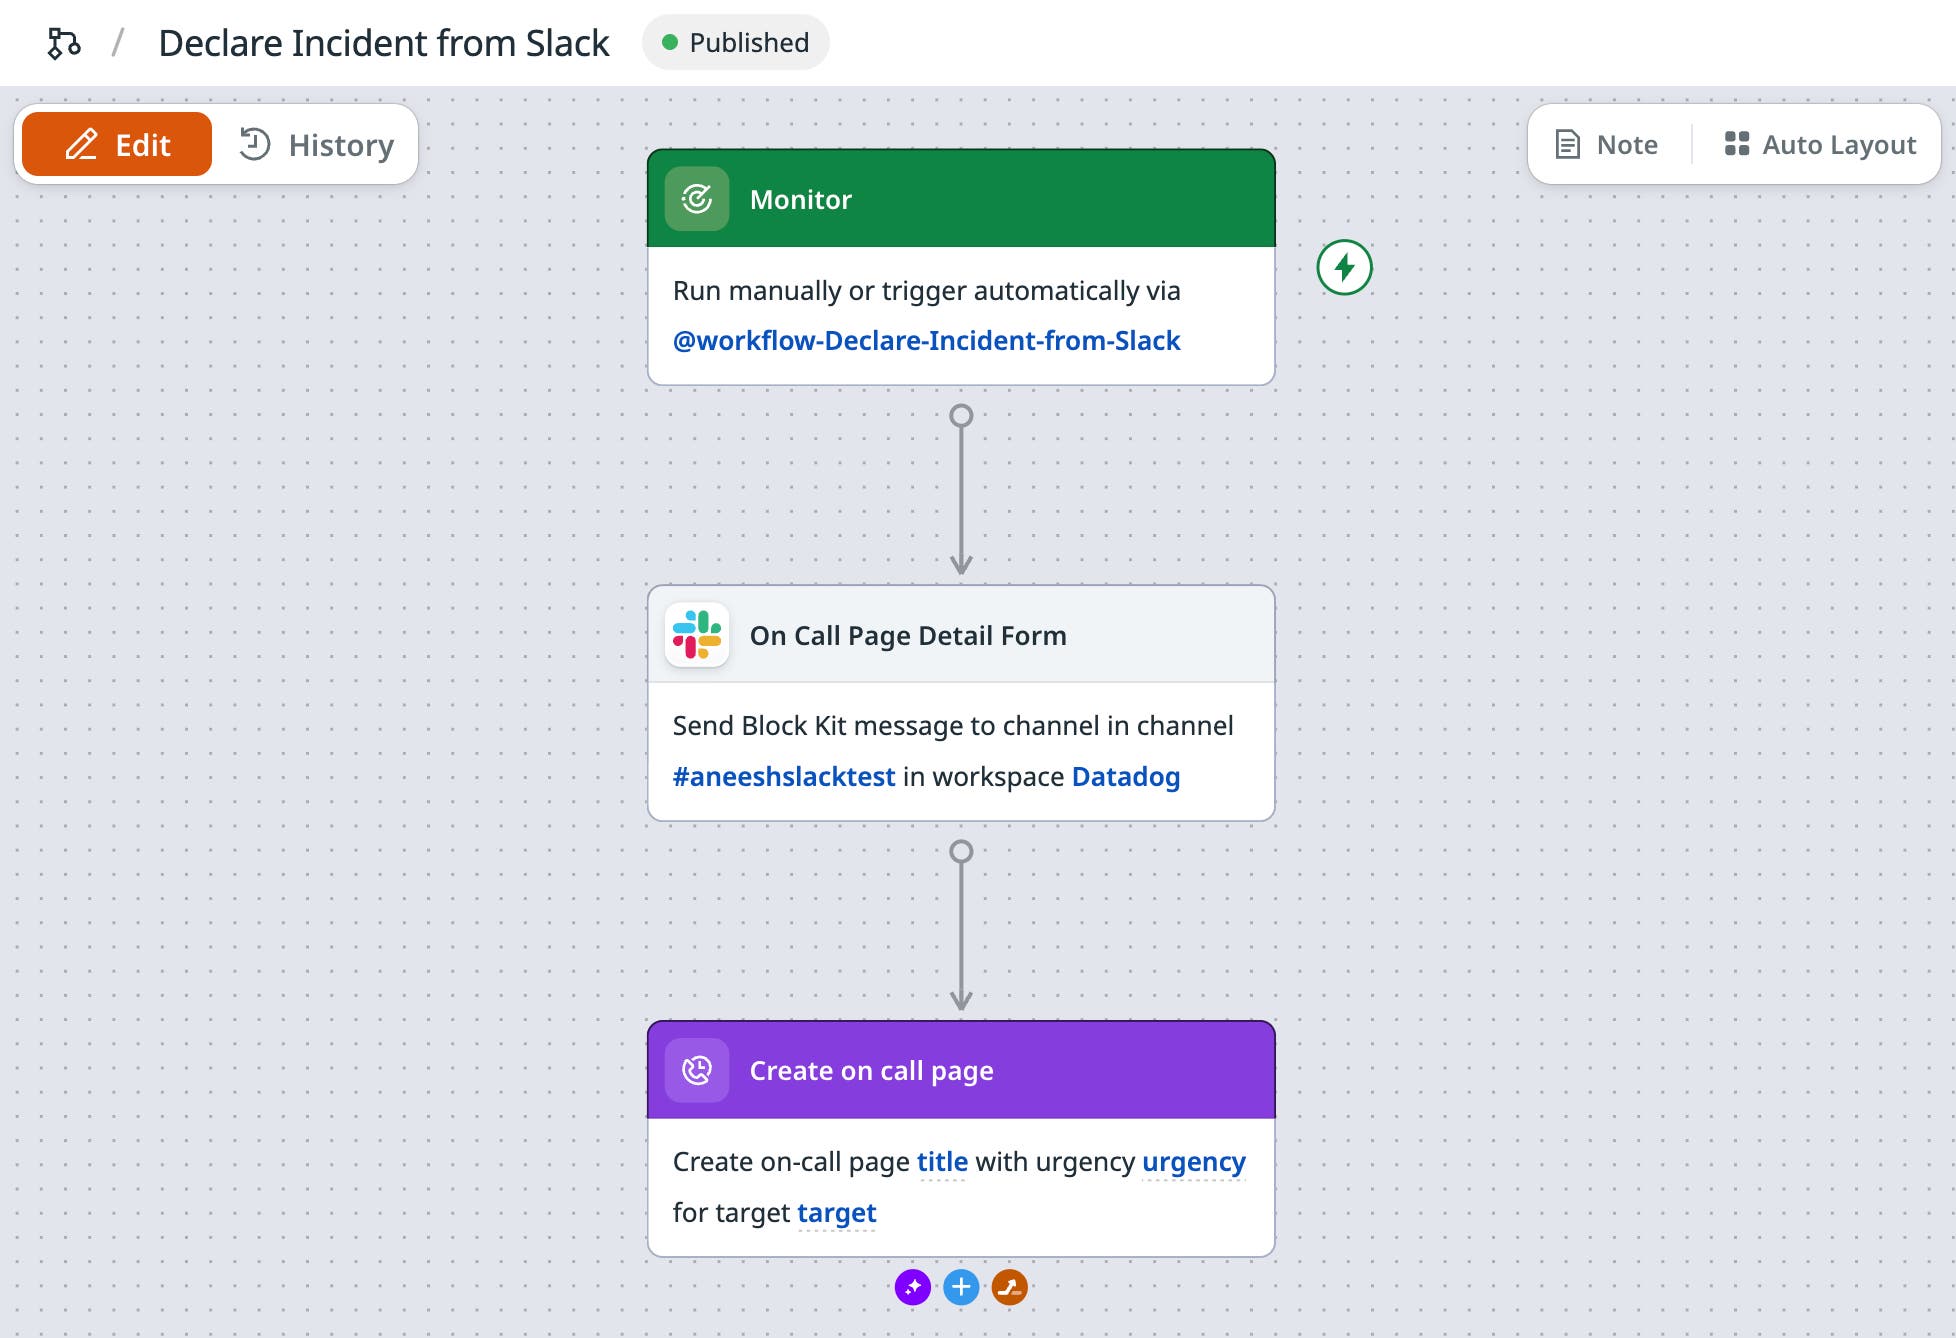
Send interactive and rich Slack messages in workflows with Block Kit
The Slack Block Kit Action lets you build Datadog workflows that deliver well-formatted context to your team and gather structured input or approvals directly from Slack. You can send files, buttons, checkboxes, date pickers, multiselect menus, and more to compose engaging messages that drive action. For example, you can:
- Include buttons and menus so engineers can acknowledge, approve, or route issues without leaving Slack.
- Send multi-block updates or release notes to spread awareness of your team’s latest activity.
- Collect incident details, postmortem inputs, or deployment notes and use them in downstream automation.
The Slack Block Kit is available to all users of Workflow Automation. Get started by creating a new Workflow and adding the Block Kit action.
Build workflows and apps to remediate issues across private environments
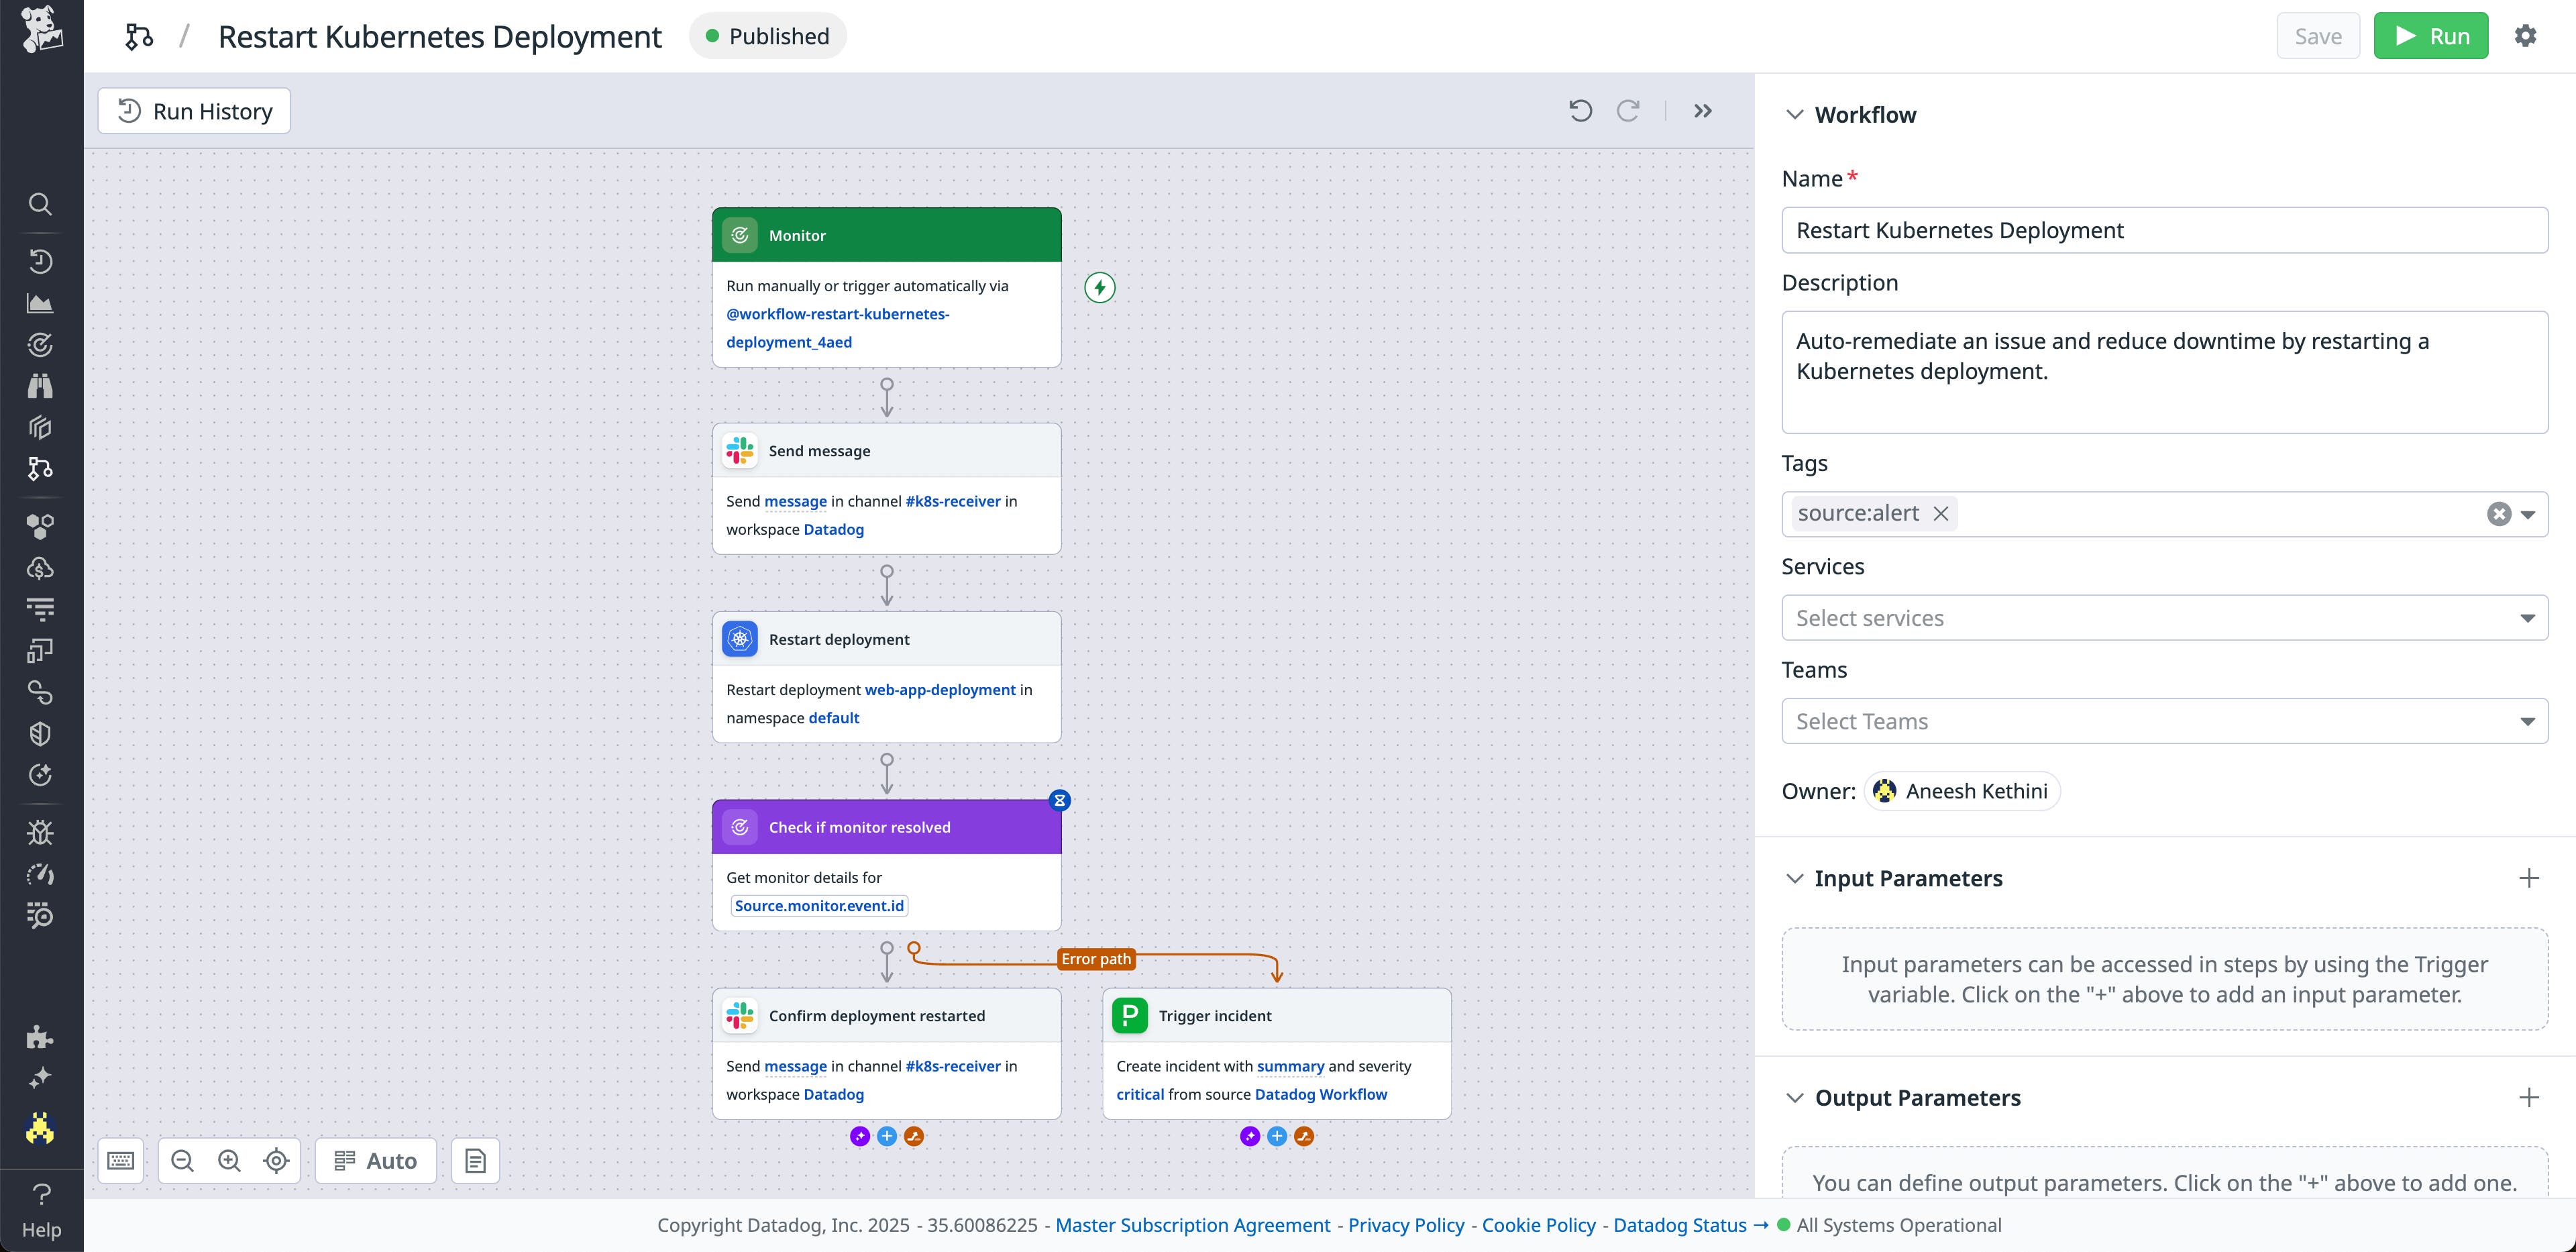
Build workflows and apps to remediate issues across private environments (such as self-hosted Kubernetes clusters, on-prem PostgreSQL databases, internal GitLab deployments, and private API endpoints) by using the 300+ private actions included in the Datadog Action Catalog.
With private actions, you can:
- Reduce downtime in self-hosted systems by using auto-remediation. For example, build a workflow that automatically restarts a Kubernetes deployment when a Datadog monitor detects high CPU usage.
- Accelerate private service creation and management all from within Datadog. For example, create an app that enables your engineers to create, monitor, and restart Kubernetes deployments directly from Datadog.
Learn more about private actions in our blog post.
Draft monitors let you build and refine monitors without sending alerts
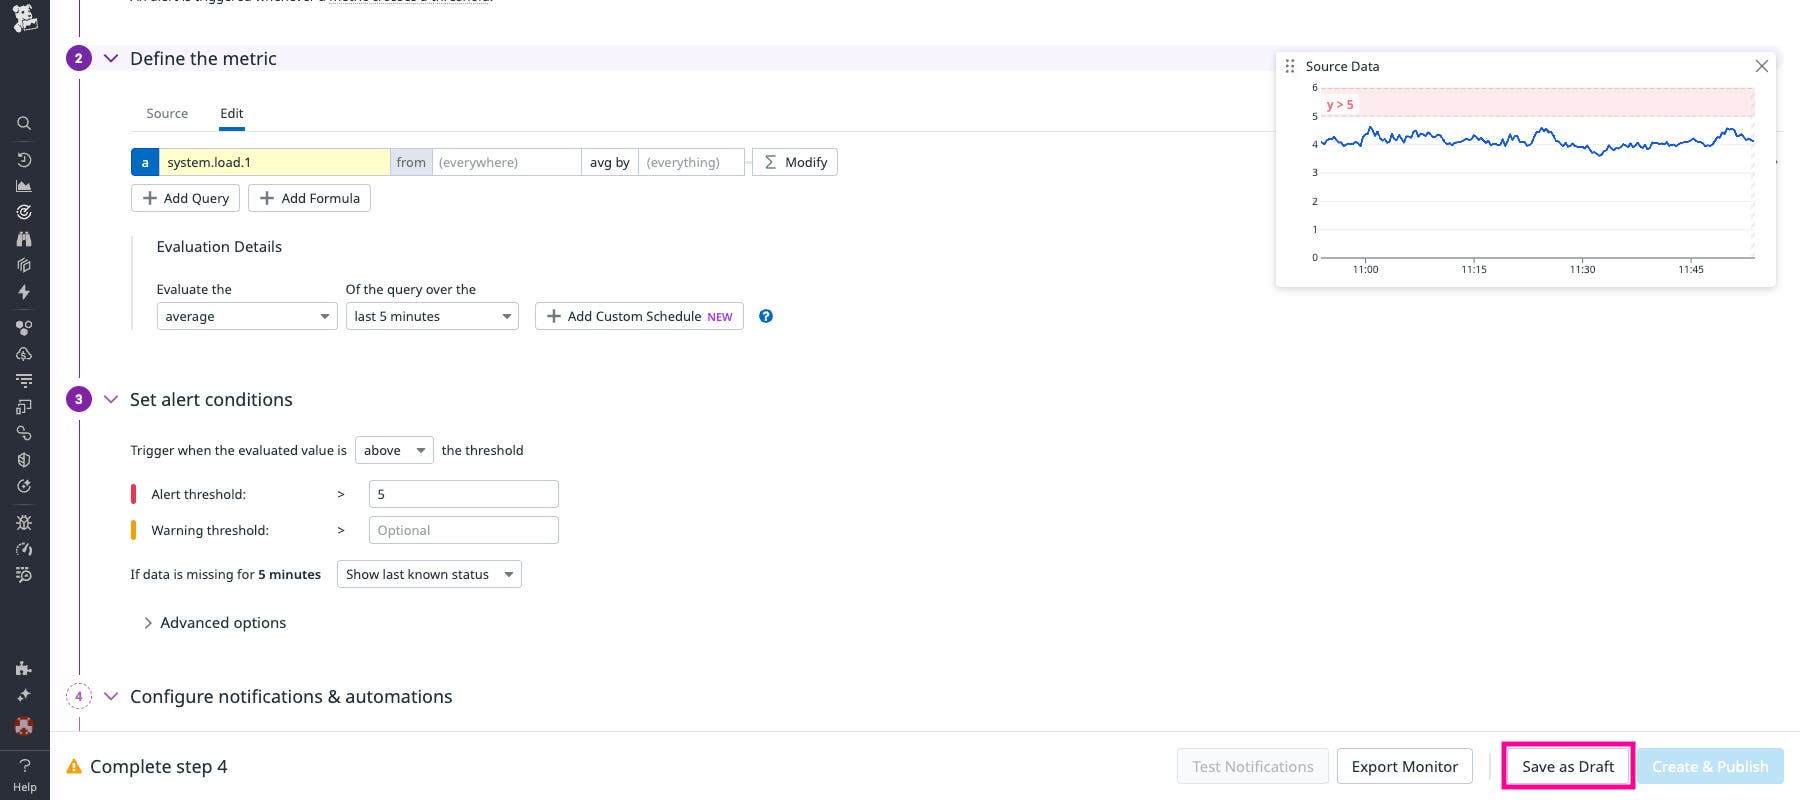
High-quality monitors reduce alert fatigue, prevent missed incidents, and ensure your teams trust the signals they receive. Draft monitors enable you to build and refine monitors without sending alerts. Save work-in-progress configurations, collaborate with teammates, and test logic until you are ready to publish a new, high-quality monitor. To learn more, see our documentation.
