Today at Dash 2021, we announced new products and features that give your team even greater visibility into the health and performance of your code, databases, CI/CD pipelines, and more. Now, you can monitor network devices, get visibility into your services' golden signal metrics without touching a single line of code, and integrate third-party tools into our platform with Datadog Apps. We expanded RUM to include iOS error tracking, Session Replay, and Watchdog Insights. And we introduced Datadog Observability Pipelines, which run on your infrastructure and put you in control of your observability data, from how it's processed to where it's sent. We'll recap these new offerings in this post—as well as all the other big announcements from Dash 2021—and help you get started using them to gain deeper visibility into your applications, infrastructure, and processes.
Infrastructure and Network Monitoring
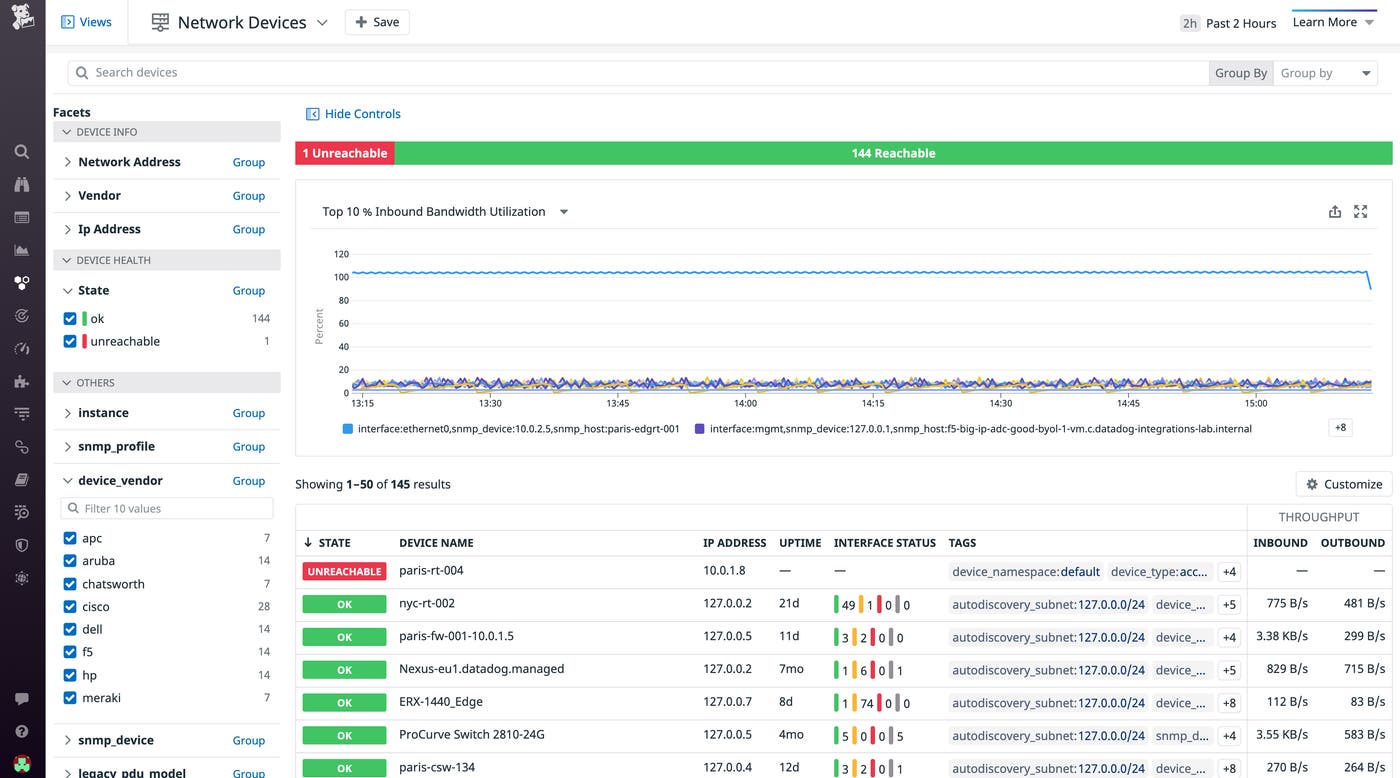
Network Device Monitoring
For many organizations, the success of their business depends on their ability to maintain on-prem or hybrid infrastructure, which can include thousands of servers, routers, switches, and firewalls. Any one of these network components can be a point of failure, which makes device-level visibility a crucial part of an effective monitoring strategy. Datadog Network Device Monitoring provides a device-oriented view that enables Network teams to easily monitor their entire infrastructure within the Datadog platform. With Network Device Monitoring, teams can spot widespread connectivity issues at a glance, zero in on specific subsets of devices, and dive into individual interfaces to troubleshoot further.
For more information about Network Device Monitoring, check out our dedicated blog post.
Universal Service Monitoring
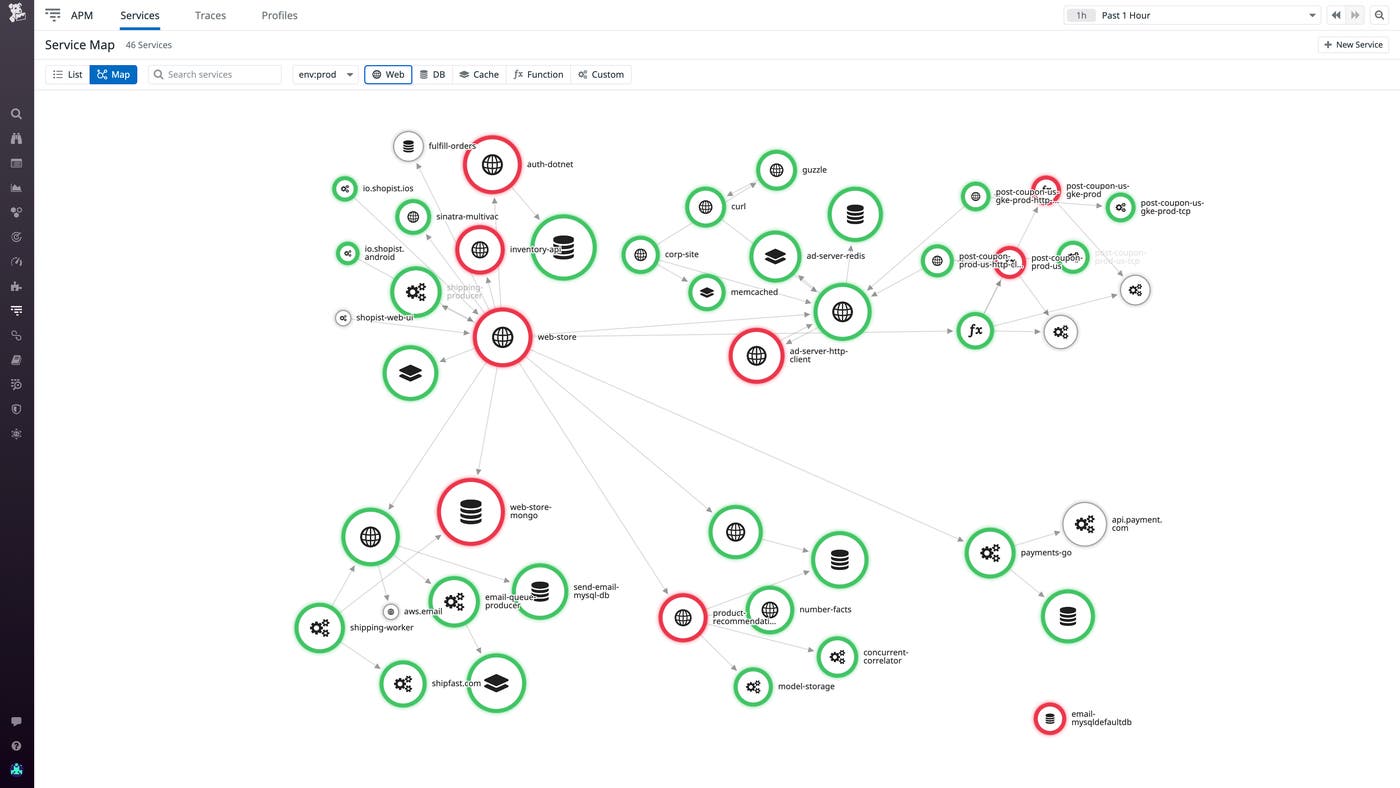
For organizations with ever-evolving fleets of applications, it can be challenging for SREs and developers to track the health and performance of every service they deploy. Universal Service Monitoring enables everyone in your organization to quickly and securely get visibility into traffic across all backend services—without touching a single line of code. Our eBPF-powered system probe automatically parses HTTP messages processed by the kernel, meaning that you can track the request rate, error rate, and latency of all your applications as soon as they come online. You can then use these metrics to drive SLOs, set alerts, visualize dependencies with the Service Map, and automatically track deployments of every service. Universal Service Monitoring is now available in Preview; to request access, please fill out this form.
Read our dedicated blog post to learn more about Universal Service Monitoring.
APM & Continuous Profiler
Database Monitoring
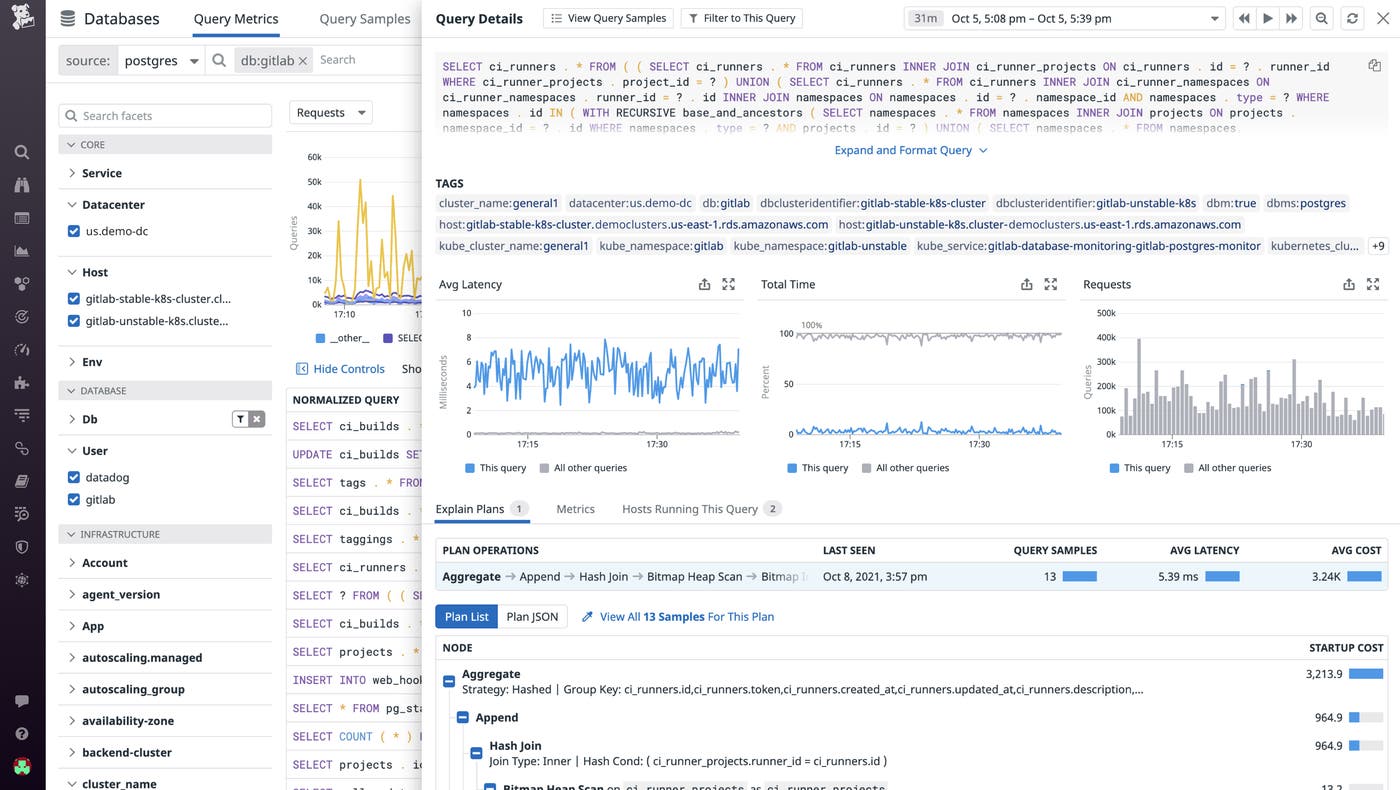
Database Monitoring provides deep visibility into the health and performance of databases across all of your hosts. Datadog collects query performance metrics directly from your databases and visualizes them to surface the slowest and most costly queries. Once you’ve identified a problematic query, you can examine its explain plan to see a breakdown of how it was executed and identify any bottlenecks. Additionally, Database Monitoring automatically correlates queries with host metrics to help you understand the impact of resource constraints on database performance. And with tags, you can isolate data from a specific segment of your fleet, such as a particular host or database cluster. All query performance metrics are stored for three months, which allows you to perform long-term analysis, create SLOs, set up alerts, and more.
Database Monitoring currently supports self-hosted and cloud-managed versions of PostgreSQL, MySQL, and SQL Server (beta). Read our blog post to learn more.
Search and filter your services with facets
Datadog's APM services list gives you a bird's-eye view of key performance metrics for all of your instrumented services. To make it even easier to scope your view to the specific services you need, you can now filter and search your services using tags and facets. Facets enable you to quickly filter your services by type (e.g., caches, databases, and web services) and whether Watchdog has detected a possible problem within them. This speeds up your troubleshooting by letting you immediately drill down to the services you're most interested in investigating.
Expanded Profiler support
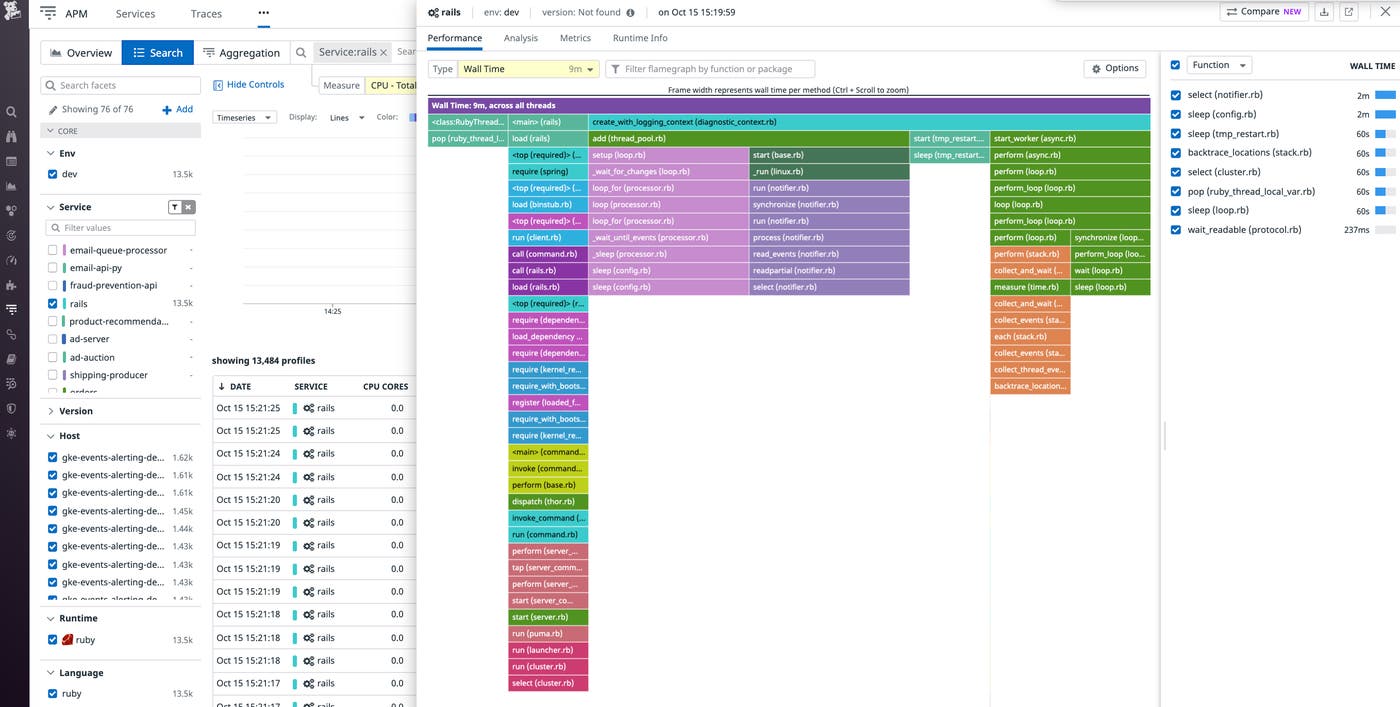
Continuous Profiler provides snapshots of code-level performance across your entire production environment. Profiles help you identify resource bottlenecks and get actionable insights for improving the performance of your applications. Earlier this year, we introduced the profile comparison view, which helps you optimize your services by seeing how code changes affect performance over time. Now, we're pleased to announce that Continuous Profiler is available in public beta for Ruby, with support for PHP, .NET, C, and C++ coming soon.
RUM
Session Replay
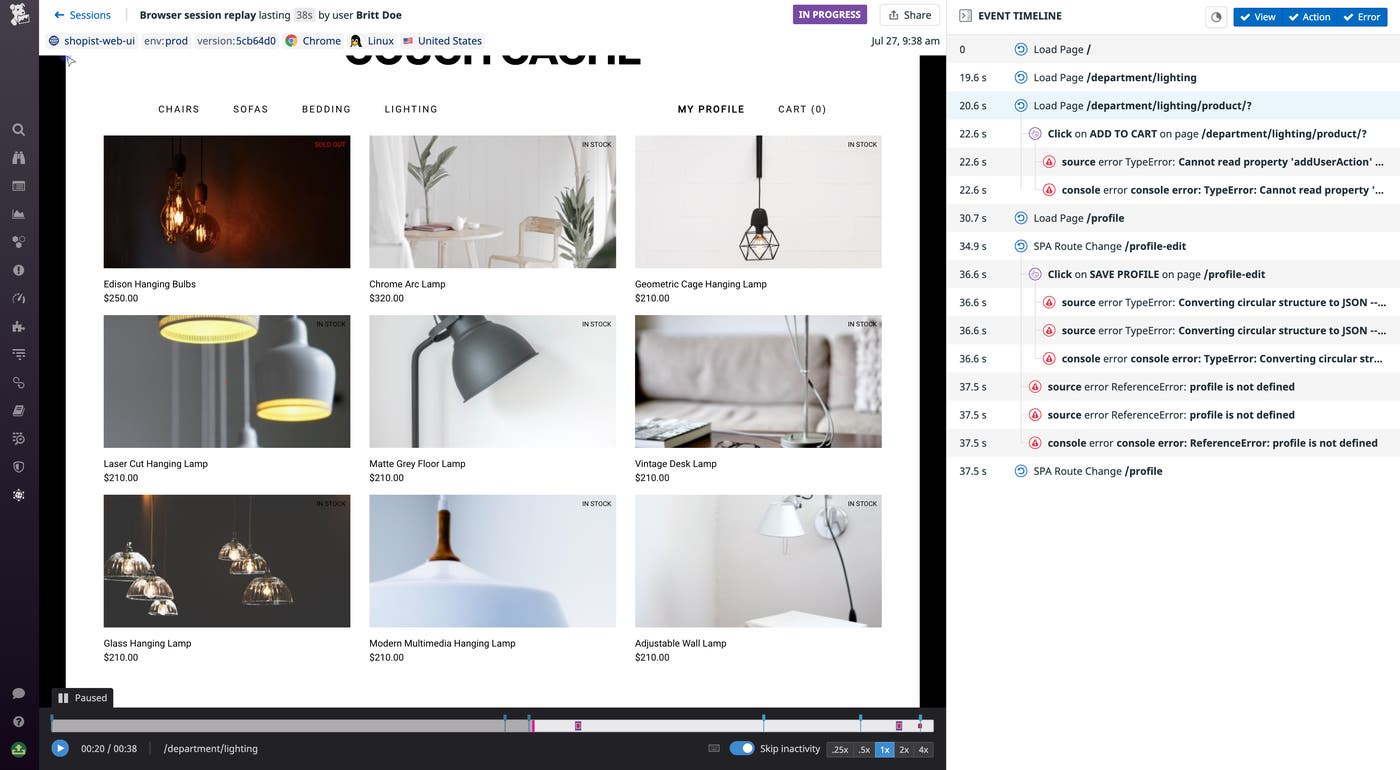
Session Replay captures video-like recordings of individual user sessions that take the guesswork out of troubleshooting frontend errors, accelerate resolution times, and provide crucial insight into user behavior. Session recordings are displayed alongside step-by-step event timelines, so teams can pinpoint the exact user action that triggered an error—and pivot seamlessly to contextual details in order to investigate further. Session Replay can also help surface patterns in how users navigate through an application and respond to broken elements, which allows UX designers to validate their assumptions and identify areas in need of improvement. Session recordings obscure sensitive data, such as credit card numbers and passwords, by default, so teams can trust that their customers' data will remain protected.
Read our dedicated blog post to learn more about Session Replay.
Funnel Analysis
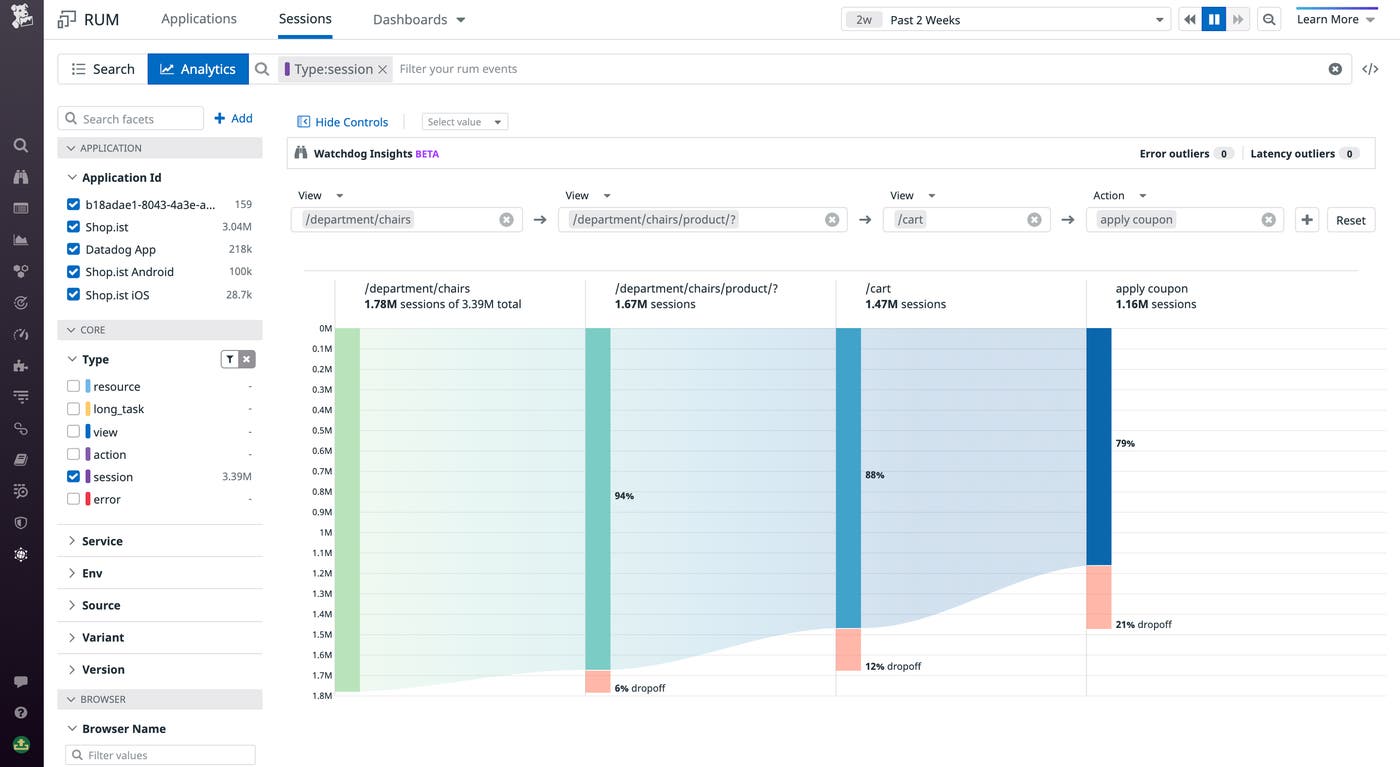
With Datadog Funnel Analysis, you can leverage Datadog RUM data to visualize and easily understand if users are successfully completing key workflows that are vital for your business's health. Once you choose the sequence of pageviews and actions that make up a workflow, Funnel Analysis graphs the percentage of user sessions that successfully moved from each step to the next, showing you where there are drop-offs in traffic. This enables you to quickly identify sources of friction causing users to churn away before completing the flow. To help you investigate potential causes of this friction, Funnel Analysis lets you drill into each step to surface key conversion rate metrics, and identify relevant Session Replays to get a better understanding of how users are interacting with your UI. Read our blog post to learn more about Funnel Analysis.
Watchdog Insights for RUM
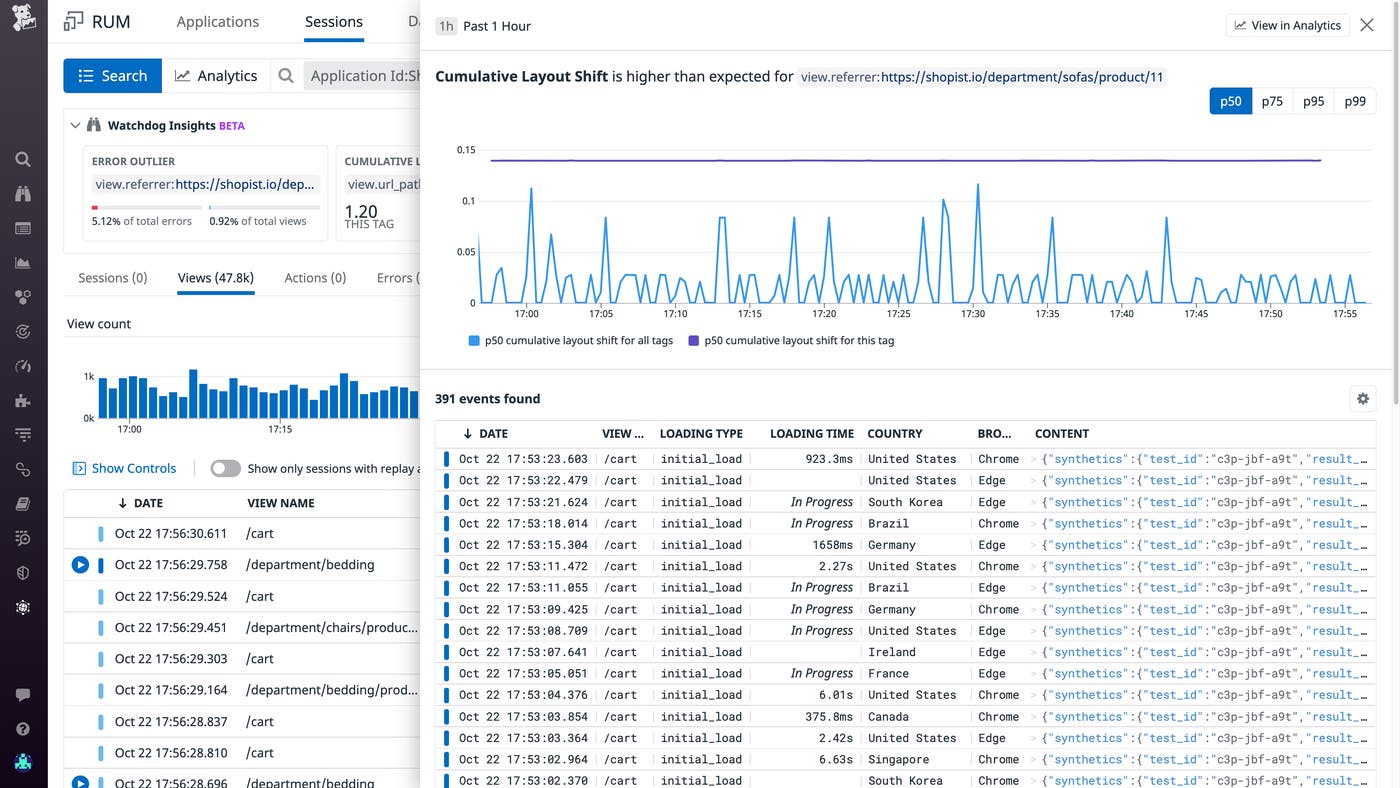
When troubleshooting issues with your web and mobile applications, it is often difficult to determine how to direct your investigation, since any combination of user device, operating system, backend services, and other factors can contribute. Watchdog Insights uses machine learning to augment your troubleshooting in Trace Search and Analytics, the Log Explorer, and most recently, the RUM Explorer. When you are investigating your data, Watchdog Insights suggests tags that you should focus on first, based on your current search query. In the RUM Explorer, for example, Watchdog Insights highlights tags that exist in a disproportionate number of RUM errors and views with poor loading performance, so you can quickly get to the bottom of faulty deployments, geography-specific UX problems, and other issues with your applications. Watchdog Insights for RUM is available in public beta. To learn more, view our documentation.
RUM Impact Analysis
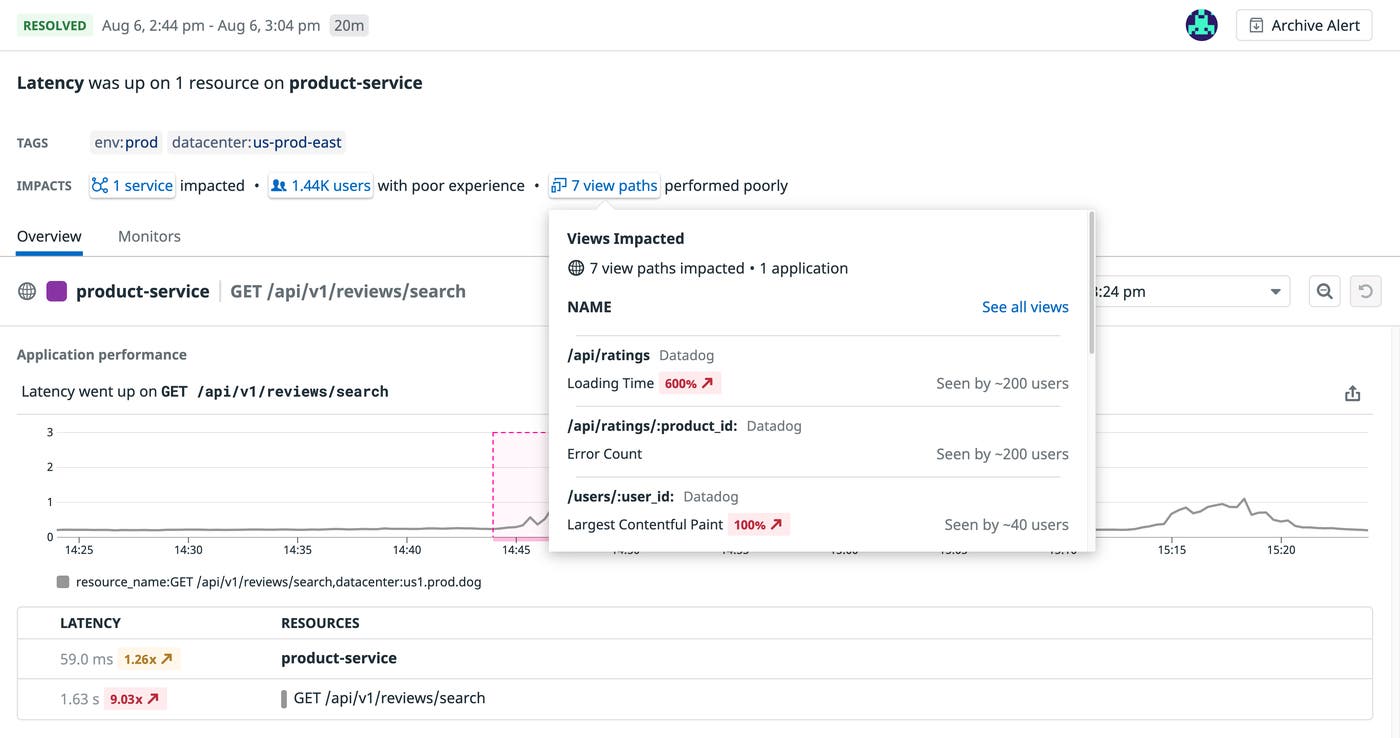
Watchdog makes it easier to identify issues in your infrastructure and applications by automatically highlighting anomalies in your metrics. Earlier this year, we released the Preview of Watchdog RCA, which automatically detects relationships between the services involved in an issue in order to speed up your root cause analysis (use this form to request access). To help you set priorities and triage work, RUM Impact Analysis (now in public beta) gives you quick insights into the user-facing impact of a Watchdog alert. When Watchdog identifies a new APM-related alert, RUM Impact Analysis analyzes Real User Monitoring data to inform you if any users were potentially affected, and which views of your application to investigate first.
iOS Error Tracking
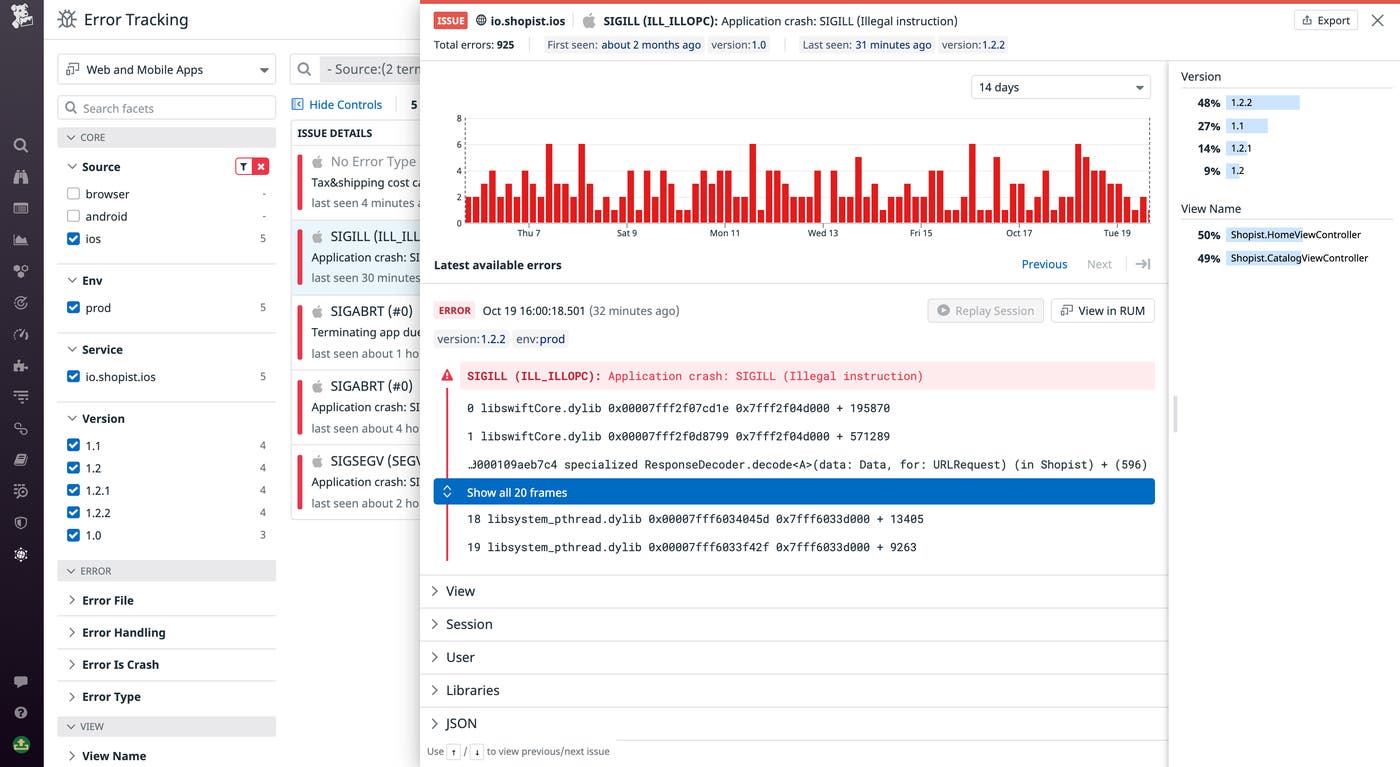
Datadog RUM's iOS SDK now enables you to forward crash reports from your iOS apps to Datadog for long-term storage and analysis. You can use Datadog RUM to correlate crash events with user metadata and detailed session information. This helps you triage the severity of bugs and see exactly how your users are reproducing them, facilitating efficient root cause analysis. Datadog Error Tracking automatically sorts your iOS crashes into issues, where you can view key debugging info (such as the stack trace and user session timeline) along with metadata like customer location, iOS version, and any custom attributes you include in your crash reports. You can set alerts on Error Tracking events to stay on top of fatal issues as they arise. By using Datadog to continually track, triage, and debug crashes in your iOS apps, you can more effectively manage their impact on users and reduce churn. Read our dedicated blog post to learn more.
Synthetic Monitoring
Private Location Monitoring
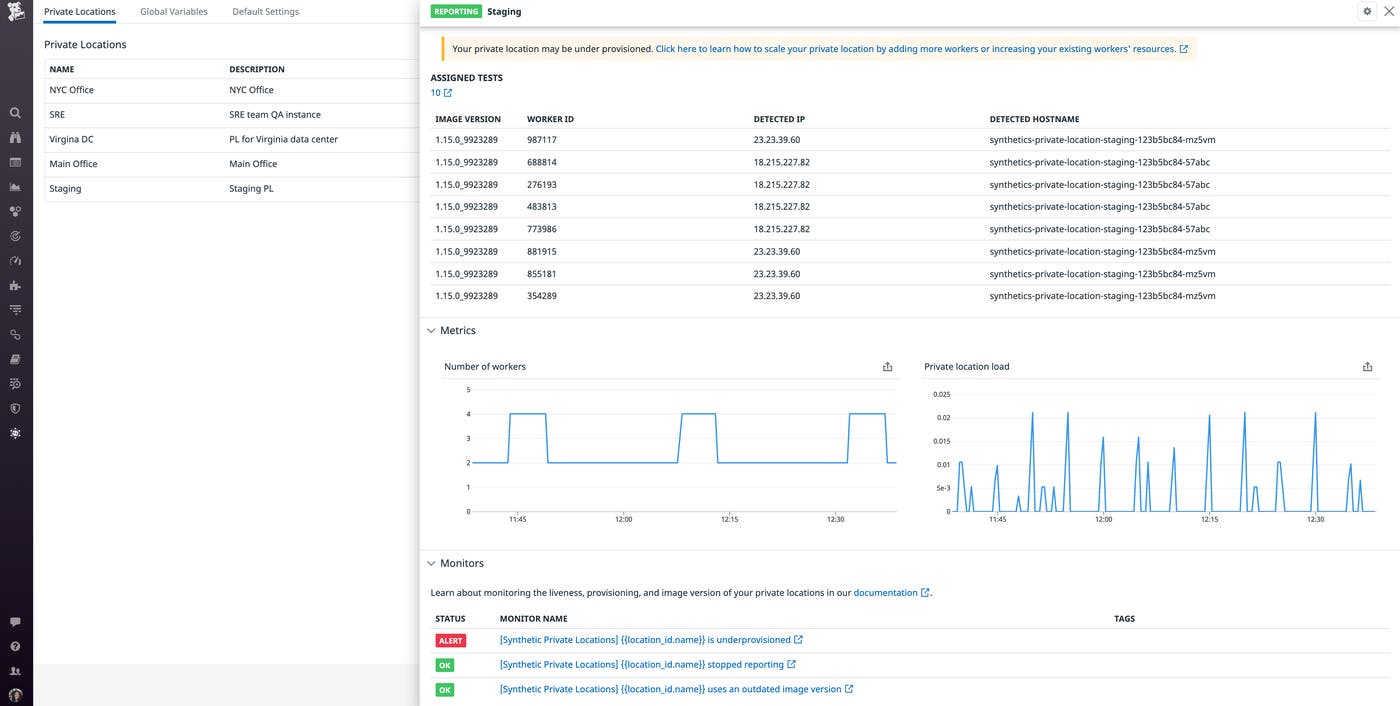
Datadog Synthetic private locations enable you to launch tests from inside your network, so you can expand test coverage to all of your critical internal applications. Because private locations are a core part of test infrastructure, it's important to have full visibility into their performance to ensure that they can support testing your on-premise applications. Now, with Private Location Monitoring, you can monitor the health and performance of all of your private location containers. We provide key metrics, such as the number of running workers, to give you a better understanding of the state of your containers. We also include out-of-the-box monitors that automatically notify you of performance issues, such as when a private location is underprovisioned, so your SRE teams know how to best scale them to support critical testing workflows. See our documentation for more information.
UDP and WebSocket tests
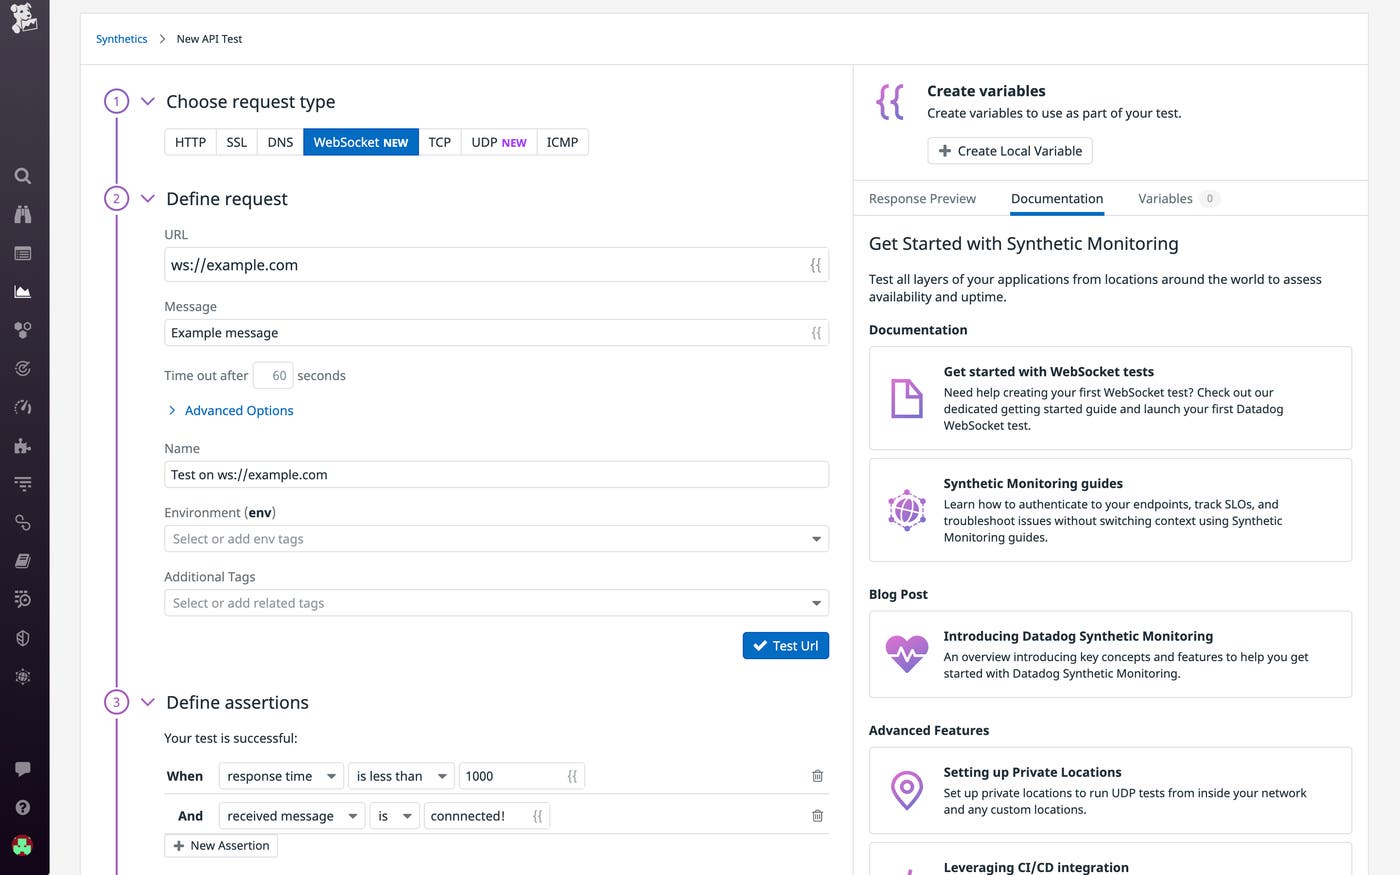
The UDP and WebSocket protocols are widely used in real-time applications, such as video streaming platforms, chat systems, and online multiplayer games. Monitoring these applications is therefore crucial for delivering a dynamic, low-latency experience to your end users. That’s why we’ve expanded our Synthetic API test suite to include UDP and WebSocket tests, which allow you to monitor the availability and responsiveness of your applications that rely on instant data exchange. If you're alerted of an issue, you can immediately troubleshoot it with your monitoring data in Datadog in order to minimize downtime. Learn more in our blog post.
Log Management
Online Archives
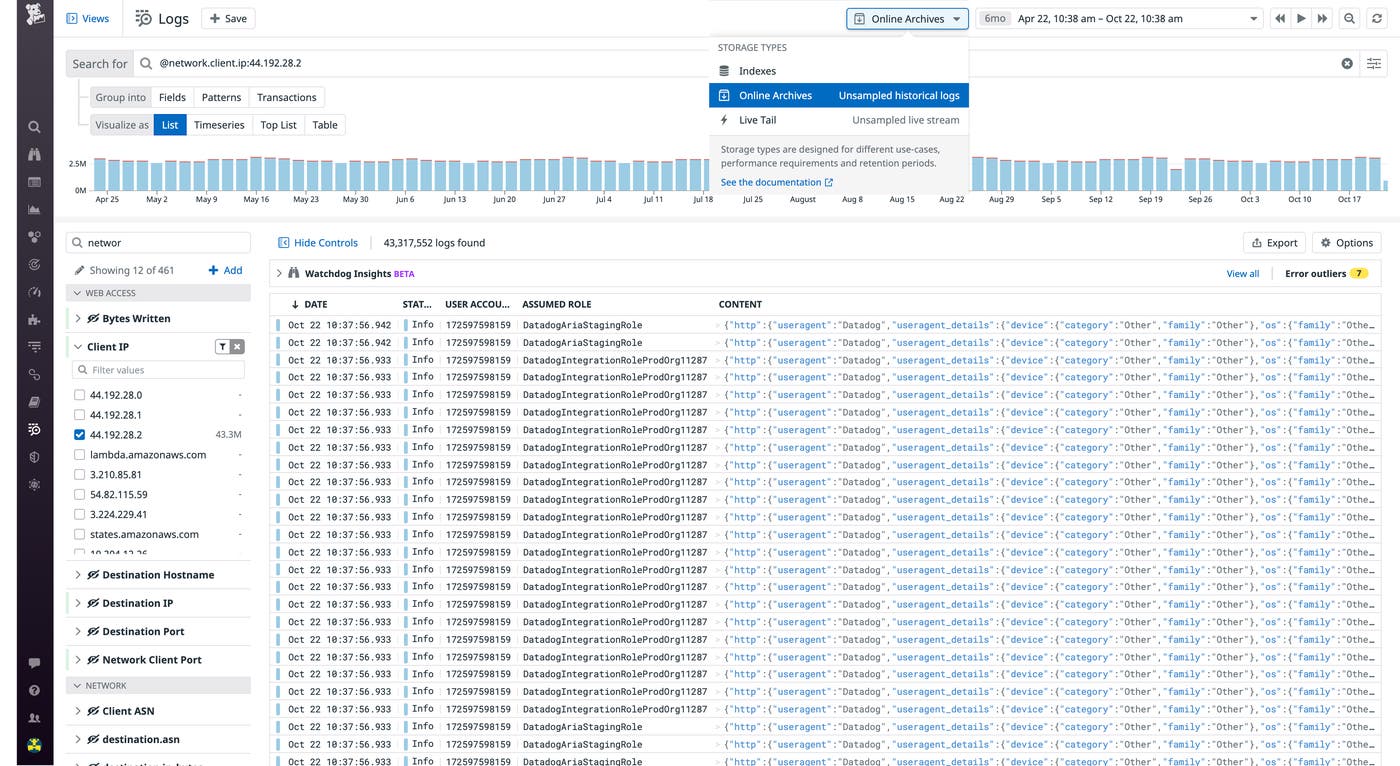
Indexed logs offer sub-second query responses, which is essential for most DevOps use cases, but there are many other investigations that prioritize comprehensiveness over speed, especially with very large datasets. Current logging solutions don't offer a cost-effective way to store and query your complete log data over a long period of time. Datadog’s Online Archives is a new log warehousing solution that offers retention of all your logs at cloud-scale volume in a queryable state for 15 months or more for a fraction of the cost of keeping them indexed. This makes it easy to access your log data for historical security investigations, periodic compliance audits, postmortems, or high-cardinality analytics. Online Archives is currently in limited availability. See our blog post for more information.
Sensitive Data Scanner
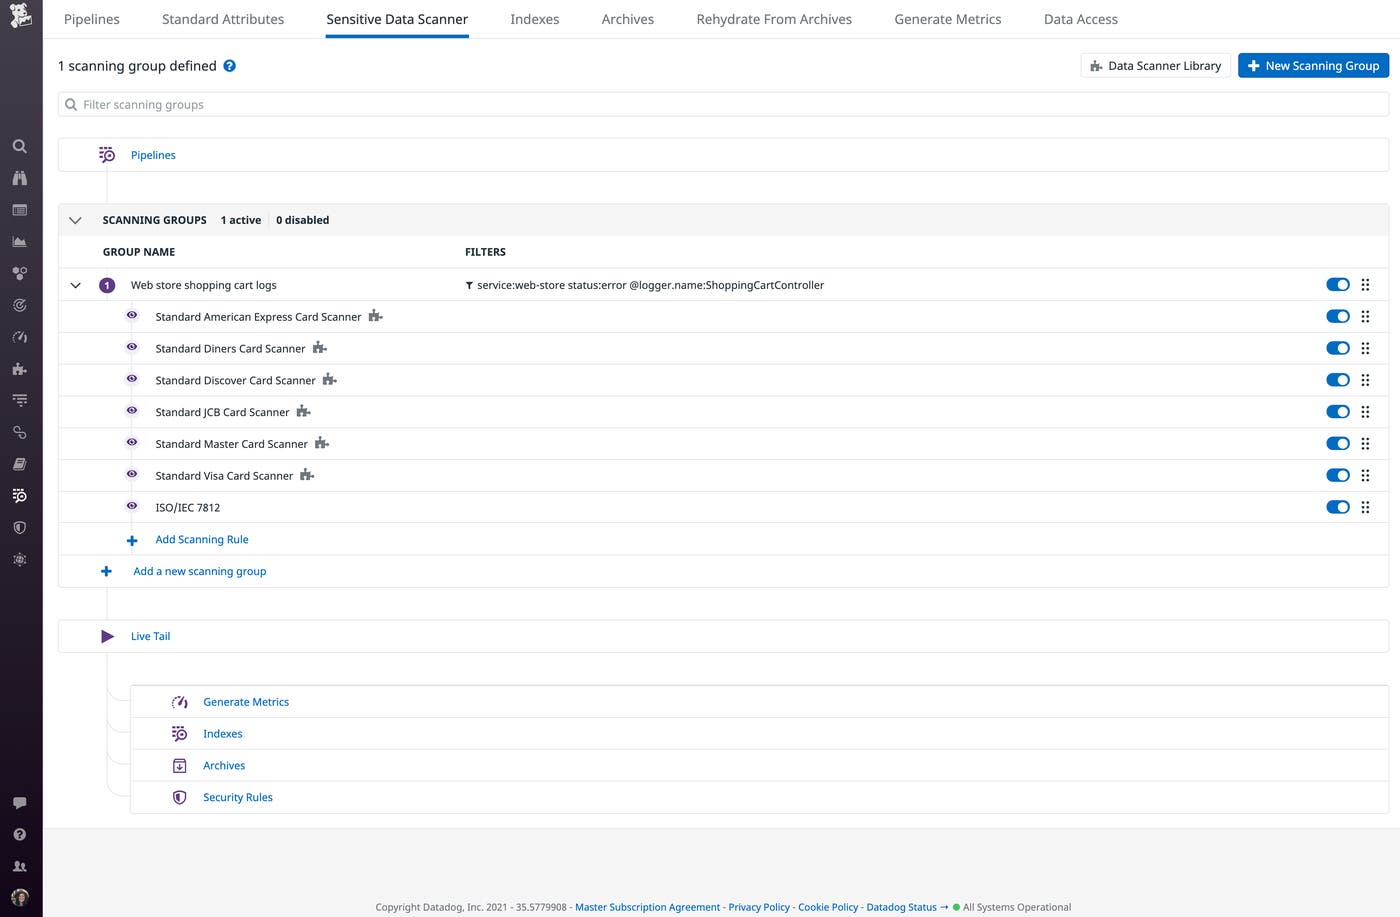
In distributed applications, data can move across many loosely connected endpoints and microservices, which makes it more difficult to know when services are unintentionally logging sensitive data. In these cases, you not only violate critical compliance policies but also potentially risk exposing your customers' personal information. Sensitive Data Scanner helps you detect services that are logging confidential information, so you can resolve any issues before a data breach occurs. Scanners monitor incoming logs and flag any that contain sensitive data, such as social security numbers, credit card information, and more. You can also configure scanners to automatically obfuscate that data in order to protect customer information and maintain compliance. Check out our documentation to learn more.
Log Anomaly Detection
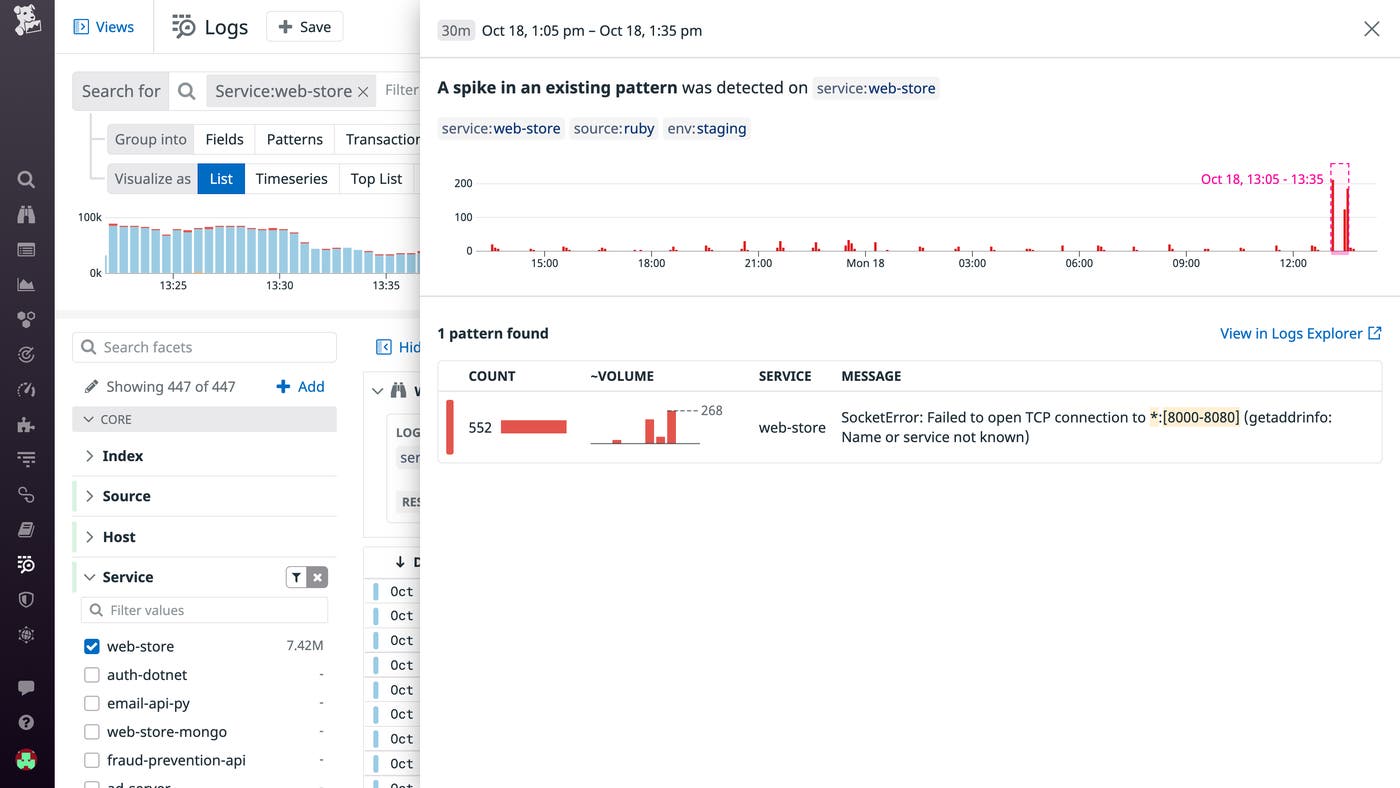
Searching through logs is helpful for responding to incidents—but it is also time-consuming, particularly when you're not familiar with the underlying application and its logging. Datadog’s Log Anomaly Detection feature makes it easier for users to quickly cut through the noise by highlighting new log patterns—or noteworthy spikes in existing patterns—that are likely to explain the root cause of an issue. For example, if you got alerted to an increase in errors for a service, Log Anomaly Detection helps you understand why (e.g., failed TCP connections to a particular service, as shown below), so you can take steps to address the issue. Log Anomaly Detection is now in Preview, and is the latest addition to Watchdog Insights, a recommendation engine that continuously analyzes logs and APM data to augment your investigations. Request access to the beta here.
Ecosystem
Observability Pipelines
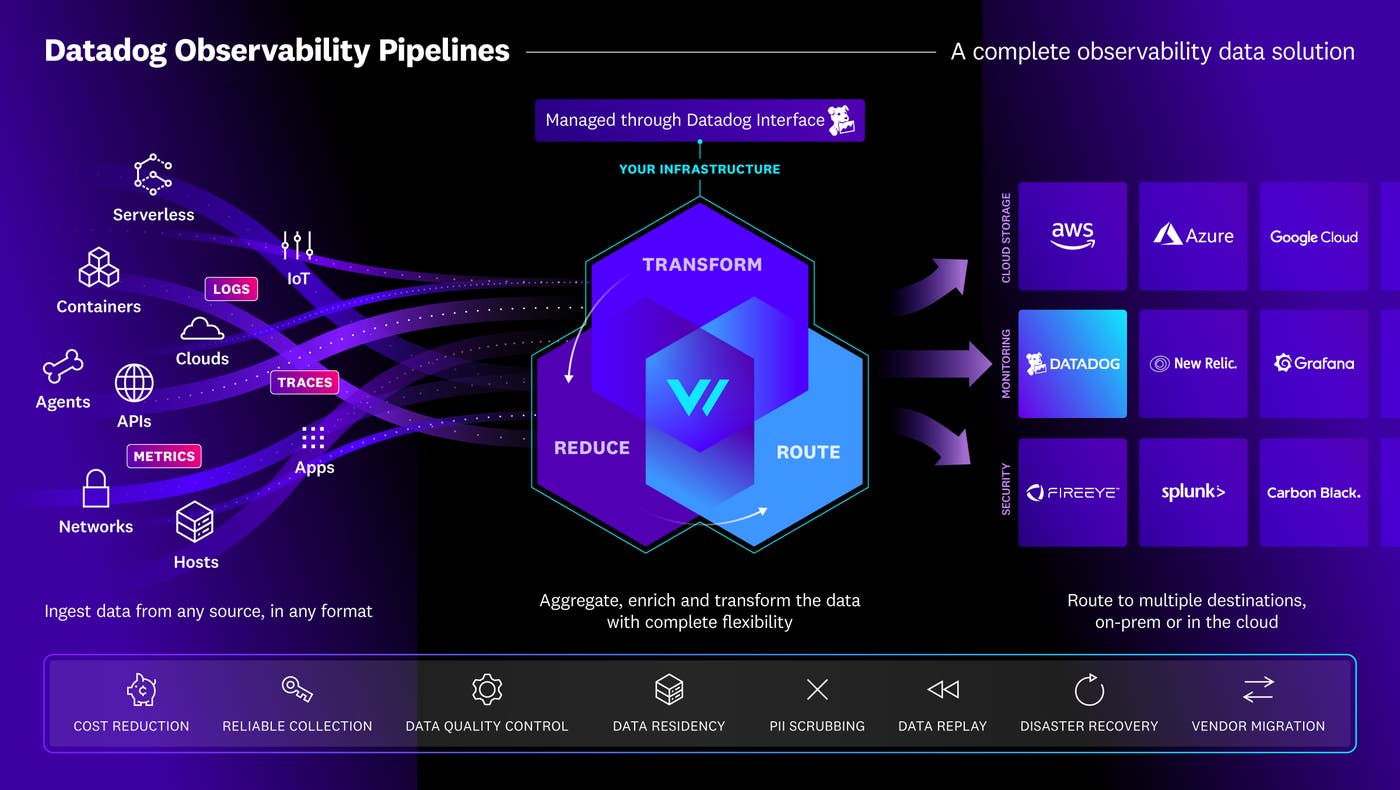
Datadog’s on-premise Observability Pipelines puts you in complete control of your observability data—from how it's processed to where it's sent. Our pipelines run on your infrastructure, whether that's on local hardware or in the cloud, which enables you to make decisions about your data before it leaves your system. With Observability Pipelines, you can perform a variety of data transformations (e.g., sampling, reduction, encryption, enrichment) to make your data useful for analysis, while remaining secure and cost-efficient. Once your data has been ingested and processed, you can route it to whatever tools are best suited for your needs. To request access, fill out this form.
Datadog Apps
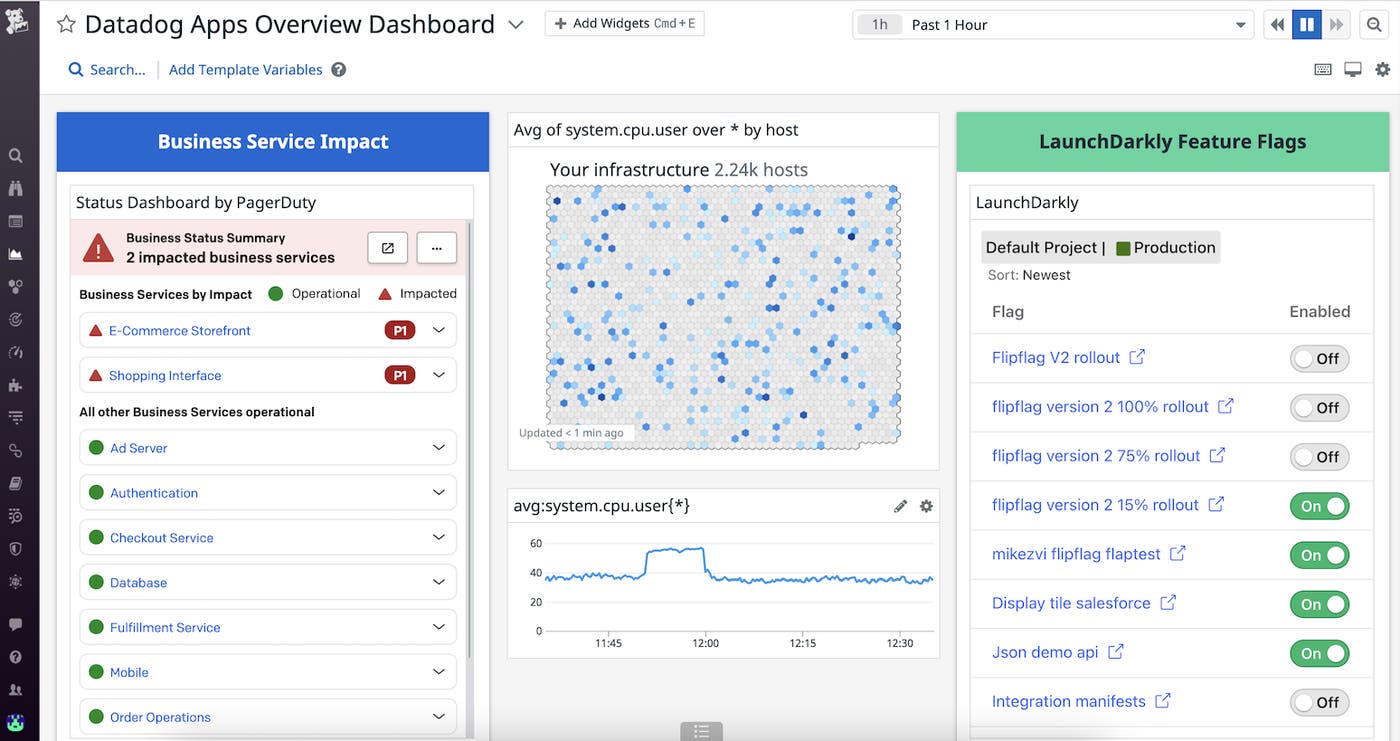
Datadog Apps enable you to embed data and functionality from your other key services directly into the Datadog platform. Using the Datadog Developer Platform, you can build custom widgets, side panels, modals, and other components that you can then add to your dashboards to unify your monitoring and application management workflows. Our current suite of Apps include widgets developed by our partners at LaunchDarkly, PagerDuty, Fairwinds, Embrace, Harness, Rookout, and Shoreline, with more to come.
Developer experience
CI Visibility
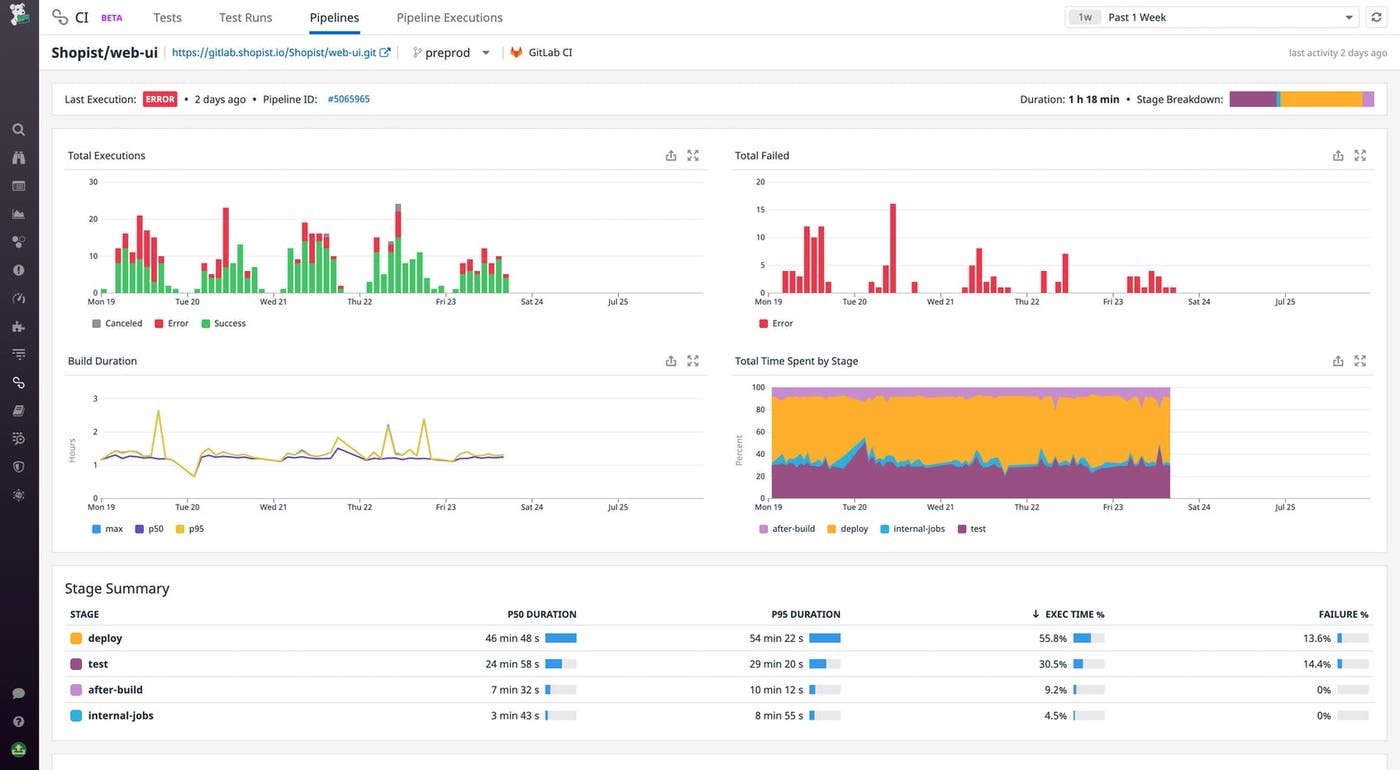
We’re excited to announce the GA release of Datadog CI Visibility, a new product that provides deep insights into the health and performance of your CI/CD workflows. With support for key services like GitLab, Jenkins, CircleCI, GitHub Actions, and Buildkite, CI Visibility enables you to track which pipelines are failing often or frequently taking too long to build, leading to development outages. CI Visibility also provides a distributed trace for each of your tests, automatically surfacing flaky tests and providing key insights to help you debug broken tests and track the effectiveness of your test suite over time. And now, you can use alerts to automatically notify your teams about new problems in your pipelines. Learn more about CI Visibility in our blog post.
Mobile dashboard widgets
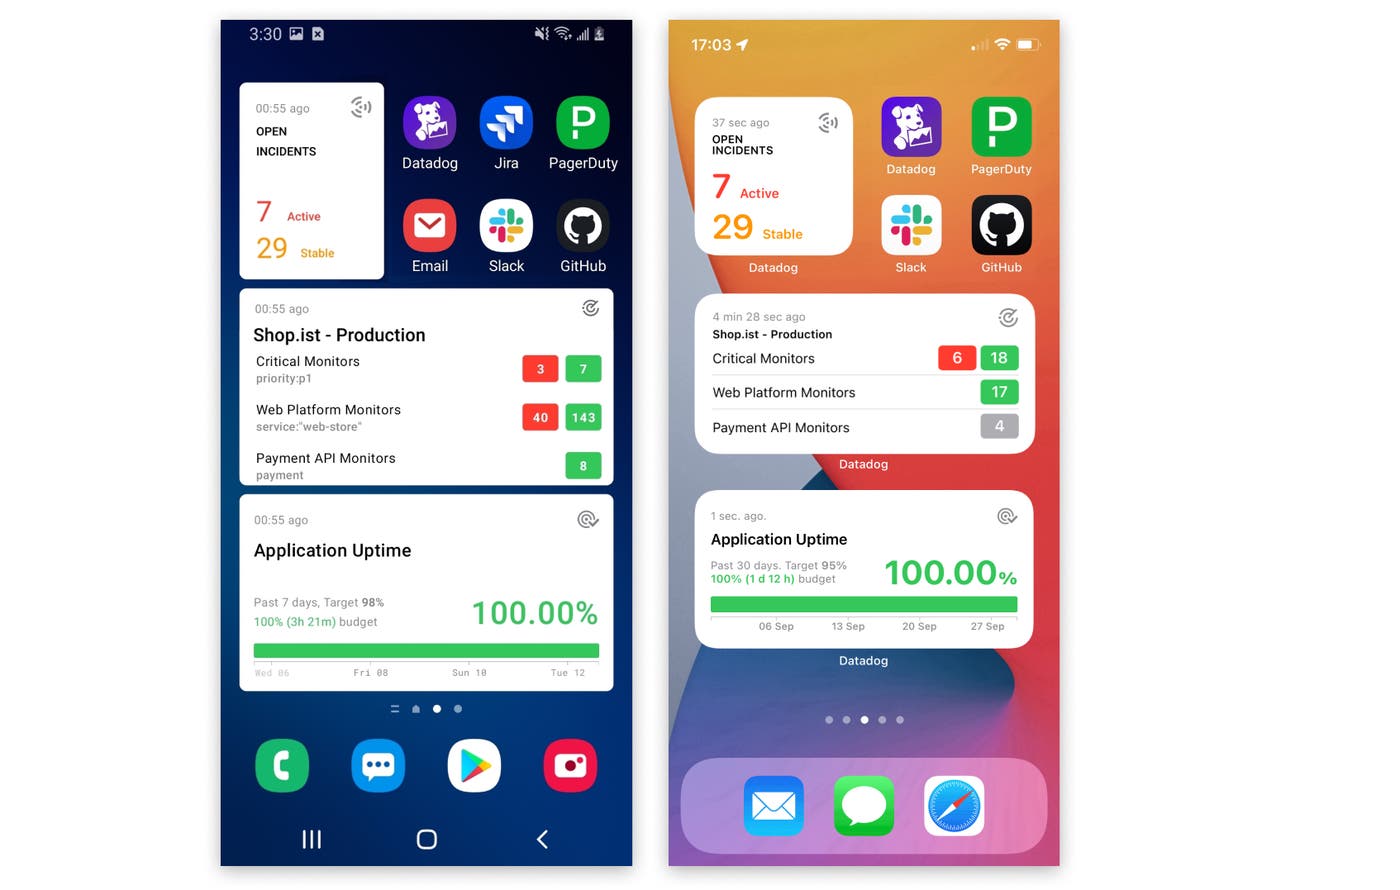
A successful on-call shift balances monitoring the health of your services and going about your life as planned. You can't take your laptop everywhere, though, so it's important to be able to rely on your phone for quick insight into system activity—even when you're eating, riding the train, or working out. That's why we're excited to announce mobile widgets, which you can use to build on-call mobile dashboards. Mobile dashboards enable you to see the status of your Datadog monitors, incidents, and SLOs—in context and at a glance from your phone's home screen. You can customize your mobile dashboards to include the apps you need most for troubleshooting and incident response, and use them with your phone's focus mode to help you concentrate on your on-call priorities.
Mobile dashboards simplify your on-call experience, letting you investigate, communicate, and collaborate without opening your laptop—or even the Datadog mobile app. See our blog post to learn more.
Integrate with GitHub repositories
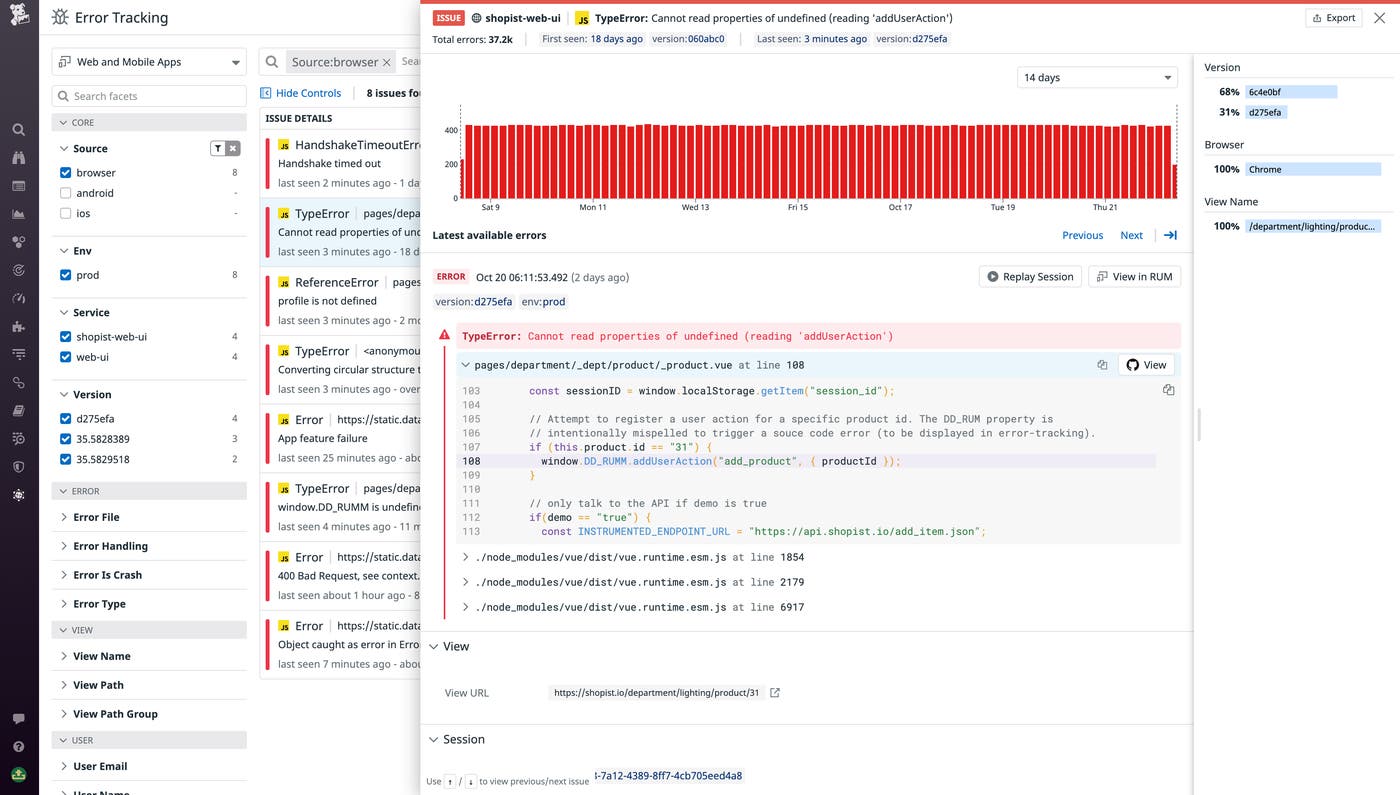
We are excited to launch a new GitHub App that integrates your GitHub repos with Datadog APM, Log Management, Error Tracking, and more, so you can get inline visibility into relevant source code and pivot directly to its location in your repo to investigate issues further. For example, stack traces in Error Tracking are now augmented with an excerpt from the method that threw the error, allowing you to get an initial understanding of the root cause without leaving Datadog. Links to pull requests in Notebooks are similarly enriched with a preview, so you can see key info about PRs directly in any Notebook. Our new GitHub App also enables you to use Datadog CI Visibility to monitor GitHub Actions, giving you key health and performance metrics for your pipelines, stages, and jobs across your GitHub repos. Check out our documentation for more information.
Cloud Cost Management
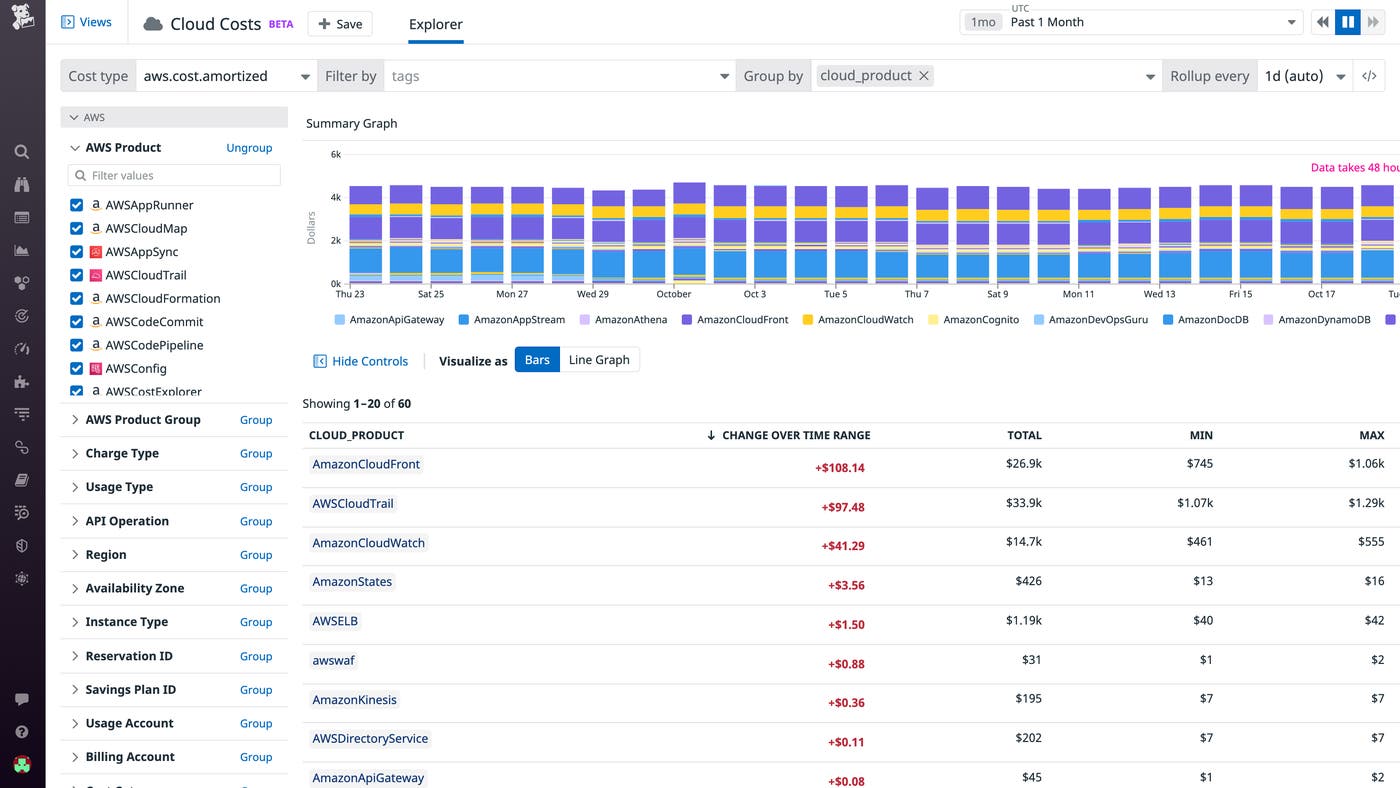
The proliferation of cloud services has made it easier for organizations to innovate quickly in order to keep up evolving customer demands. But as organizations migrate to the cloud and adopt more services, they are also finding it increasingly challenging to manage their cloud costs. On one hand, finance teams are unable to properly attribute costs to individual teams and products, especially when teams share the same compute resources (e.g., containers). They also cannot determine whether rising costs are a consequence of reduced efficiency or increased usage. On the other hand, engineers regularly make application changes without knowing their financial implications. Datadog Cloud Cost Management addresses these challenges by bringing cloud costs and operational data into a single view. With this new release, cost managers can easily understand trends in cloud costs, allocate spend across their organization, and identify cost-optimization opportunities. Read more in our blog post.
Serverless
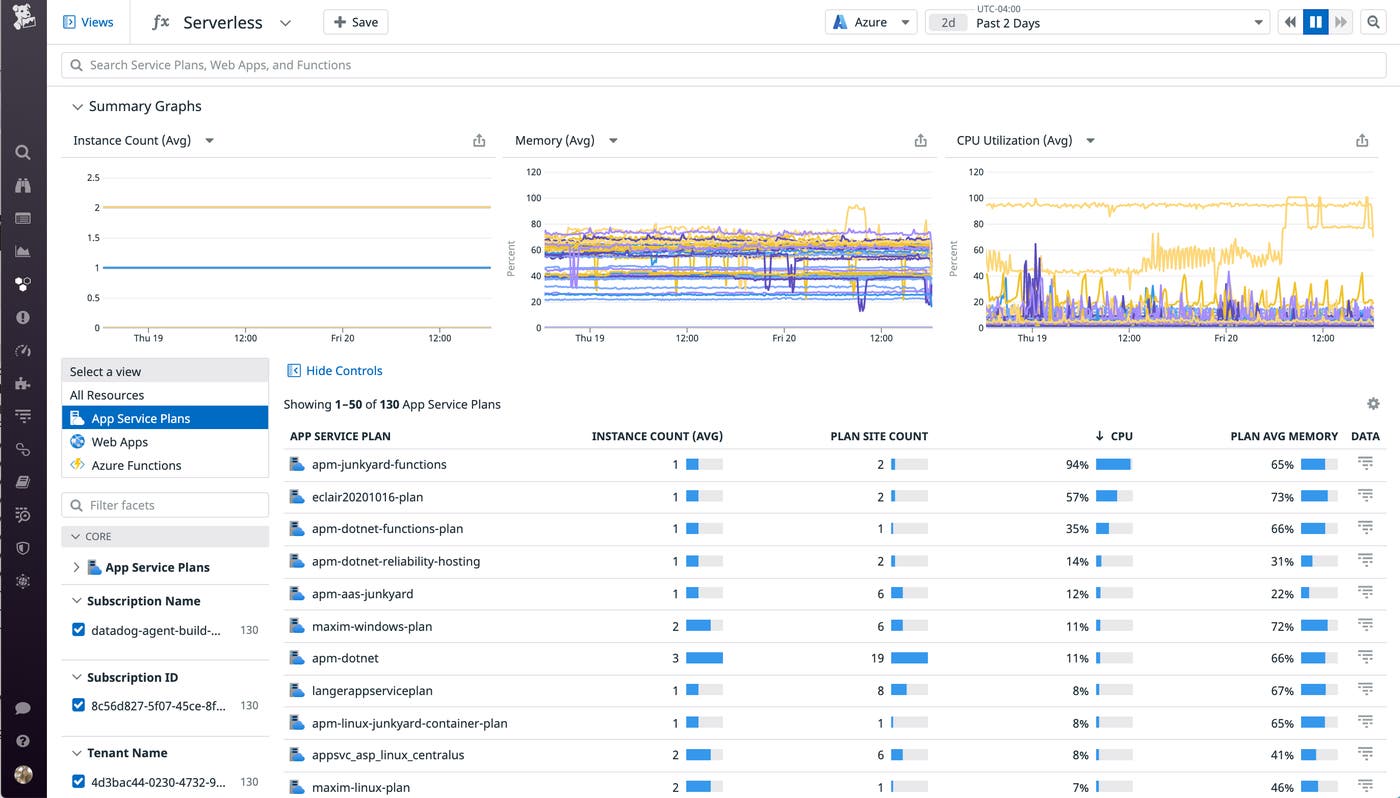
Explore Azure App Service in the Serverless view
The Datadog extension for Azure App Service allows you to automatically collect distributed traces and custom metrics from your web apps, and can be deployed and managed directly from the Azure portal. To provide even more visibility into App Service, Datadog's Serverless view now helps you visualize all your App Service resources and map the relationships between them. Understanding the relationships between apps and their hosting plans can be critical for troubleshooting, security, performance optimization, and cost management. The Serverless view makes it easy to filter down to the resources that are relevant to you and see associated metrics, logs, traces, and metadata at a glance. Read our blog post to learn how the Serverless view can help you analyze key metrics from resources, identify overloaded or underutilized plans, and more.
SLOs
SLO Alerts
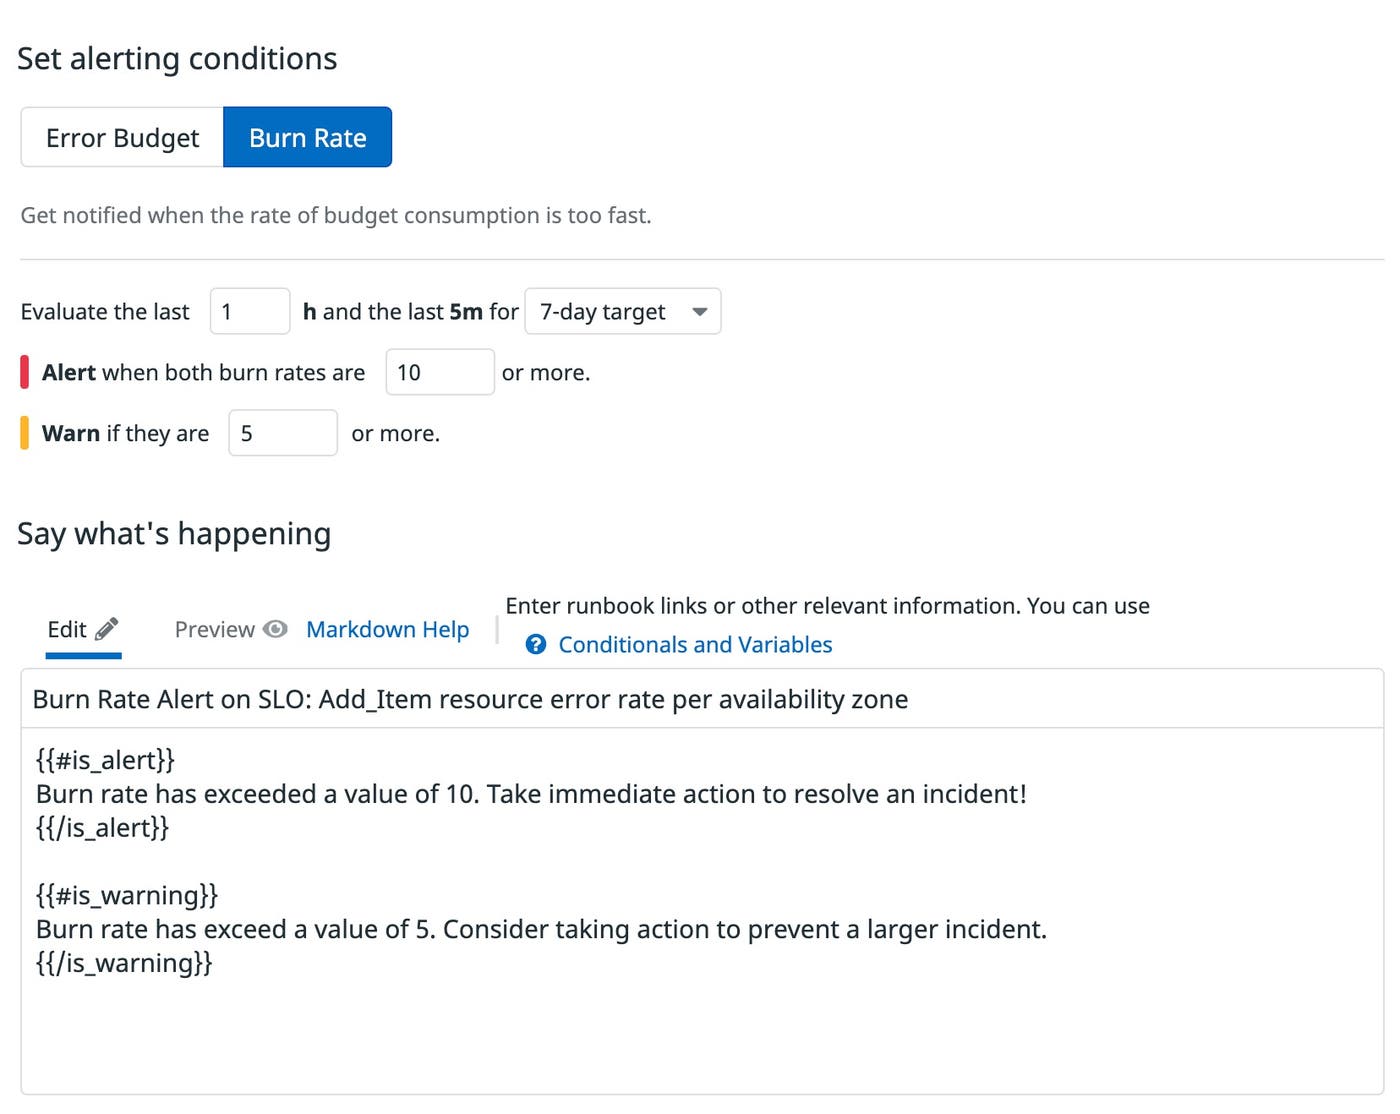
SLOs can help you manage the reliability of your services, and now SLO Alerts proactively notify you if a service might fail to meet its target. Two types of SLO Alerts provide information you can use to prioritize your team's work: error budget alerts and burn rate alerts.
Error budget alerts detect when a service has consumed a specified percentage of the SLO's available budget. Product owners can use this information to know when to prioritize reliability work over feature development to avoid a breach. Burn rate alerts can automatically page your team if a service is consuming its error budget too quickly, so you can take immediate action to fix the problem.
SLO error budget alerts and burn rate alerts are available now in public beta. See the documentation to learn more.
Scale up, speed up
Dash 2021 brought together industry experts and practitioners of modern software development to share knowledge around building and scaling diverse, secure, and reliable processes and teams. You can check out videos of Dash 2021 sessions—featuring speakers from HashiCorp, Shopify, and many more—on our YouTube channel. And if you're not already using Datadog, get started today with a free 14-day trial.
