
Brad Menezes
With [anomaly detection], [outlier detection], [forecasting], and [composite alerting], Datadog enables you to reliably alert the right people at the right time. But what happens when latency starts to increase, or error rates spike, in areas of your application where you haven’t set alerts? That’s what Watchdog is for.
Watchdog is a new auto-detection engine that surfaces performance problems in your applications without any manual setup or configuration. Using our extensively field-tested machine learning algorithms, Watchdog automatically detects issues in your data, such as latency spikes in your microservices, elevated error rates on any of your endpoints, or network issues in one of your cloud provider’s zones.
What’s the story?
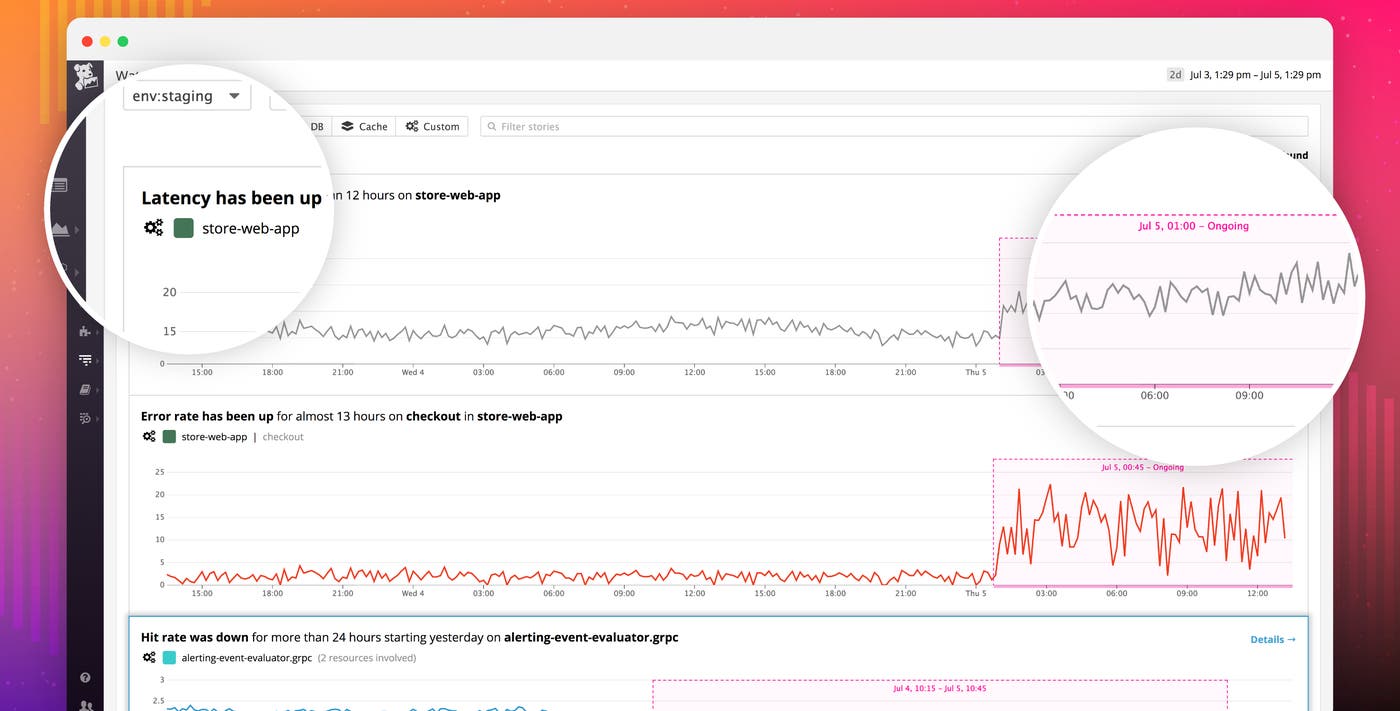
As Watchdog detects anomalies across your environment, it creates a feed of “stories” with notable findings. Each story automatically highlights the timeframe of interest on a timeseries graph and provides a plain-language summary of what happened: which resource was affected, where, and for how long.
Automatically surface performance anomalies with Watchdog from Datadog.
Dive into the details

Each story in the Watchdog feed links directly to a detail page that provides further context for that specific service, endpoint, SQL query, or availability zone at that moment in time. The detail page automatically aggregates performance statistics (throughput, errors, and latency percentiles) for the particular service or resource.

For the indicator that triggered the Watchdog story (e.g., the latency or error rate for your web application), the detail page displays the recent values of that indicator along with the expected values based on historical trends, so you can see just how significant the anomaly is.
Identify likely culprits

On the detail page for a Watchdog story, Datadog automatically surfaces related behavior that might have the same underlying cause, so you can see at a glance if the problem is widespread or confined to one particular part of your application.
For error events, Watchdog automatically pulls in common stack traces, so you can go from not knowing about an issue to knowing exactly which line of code is causing the issue in one click.
It’s not you, it’s your cloud

Watchdog automatically detects network issues in your cloud infrastructure, so you can failover to an unaffected zone or re-route traffic to another cloud provider. In each network health story, you can see a map of the affected zones, as well as detailed metrics on TCP retransmits per availability zone to see exactly where and when the issue began to affect your applications.
Detect all the anomalies
Watchdog builds on Datadog’s established machine learning features, such as [anomaly detection], [outlier detection], and [forecasting], to produce high-quality results specially tuned for high-scale infrastructure and applications. At launch, Watchdog evaluates key application metrics, such as latency or error rates, from Datadog APM. We’re continually adding algorithms to apply Watchdog to new problems—like root cause analysis and Kubernetes anomaly detection—so it can detect new kinds of situations anywhere in your environment.
If you aren’t yet using Datadog, you can sign up for a free 14-day trial today, and unleash Watchdog to start detecting anomalies across all your services automatically.
