Jordan Obey
Senior Technical Content Writer

Omri Sass
When monitoring highly distributed applications—which might rely on hundreds of services and infrastructure components across multiple cloud-based and on-premise environments—it can be challenging to identify errors, detect causes of high latency, and determine the root cause of issues. Even if you already have robust monitoring and alerts, your infrastructure and applications will likely change over time, which may make it difficult to reliably detect irregular behavior. To meet this challenge, we developed Watchdog Insights for Datadog APM.
Watchdog Insights watches the indexed spans returned by your Trace Analytics queries in real time, and scans all available tags in the results. It automatically detects which tagged objects from your environment including users, hosts, services, and any other reserved or custom tags are associated with higher-than-usual error rates or latency. This feature enables devops teams to quickly identify issues and dig deeper into the relevant traces and associated services, infrastructure components, and code profiles to discover possible root causes.

Dig deeper into indexed spans in Trace Analytics
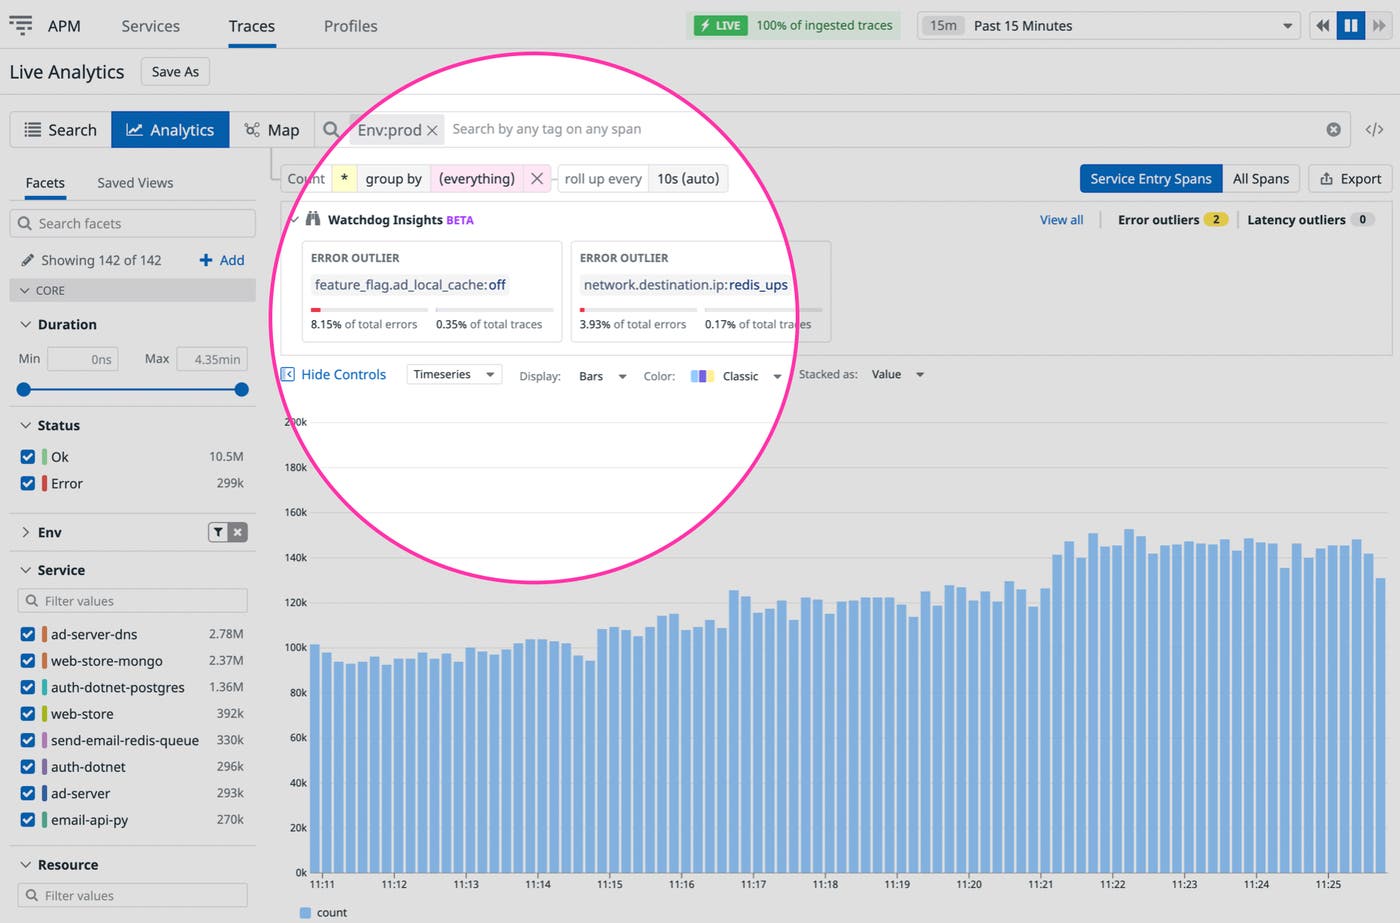
Watchdog Insights is embedded in our Trace Analytics UI, so you can investigate indexed spans and outlier data in a single view. Simply navigate to the Analytics view under the Traces tab, and use tags like service and env to filter your spans. If a notification appears in the Watchdog Insights widget (highlighted above), click on it to see any outlier behavior and a list of tags that appear in indexed spans exhibiting that behavior.
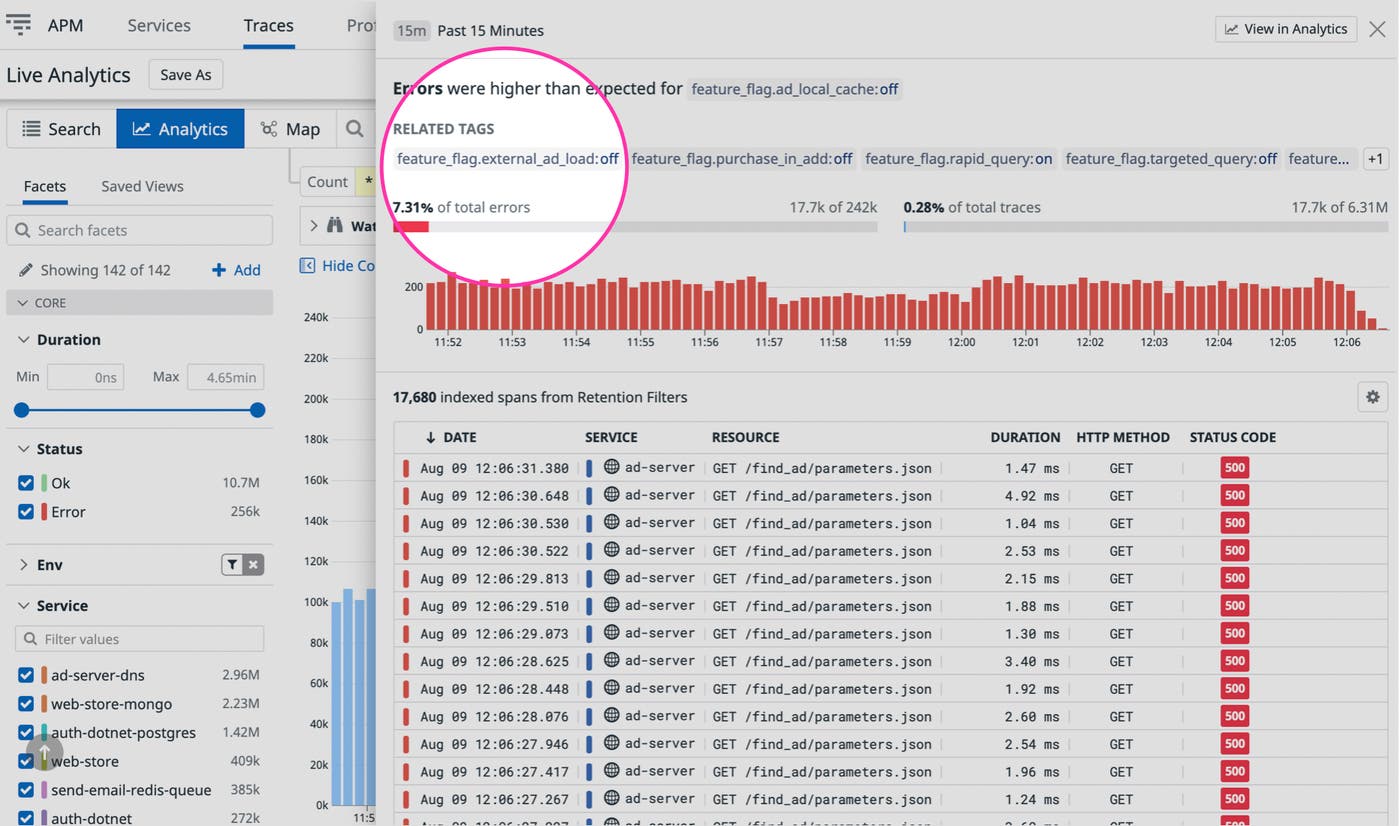
Clicking on any of the tags listed will let you drill down into their traces and view other associated tags for wider context. Once you've identified where errors or latency spikes originated, you can start taking steps to resolve the issue. For example, you can check the health metrics of the service throwing the errors to see if it's the result of a bottleneck and determine whether to provision more resources. You might also discover a database shard associated with high latency that needs to be scaled up after it's exceeded its transaction throughput capabilities.
Find the outlier in the haystack
Even with comprehensive monitoring and a robust set of alerts, you can still encounter challenges spotting issues, understanding their impact, and identifying their root cause. Watchdog Insights helps discover unexpected and erroneous behavior in your applications and infrastructure.
Quickly pinpoint issues in multi-tenant architecture
One common hurdle you'll encounter while managing a multi-tenant application is knowing which infrastructure components are underperforming and what customers might be affected. If a customer says they're experiencing issues with an application, identifying the exact resources the customer is using, which might be provisioned across thousands of hosts, partitions, and shards, can be difficult and time consuming. In Trace Analytics, indexed spans can include tags so that they are associated with both the underlying infrastructure components and the users. This way, you can easily see the user whose request generated the indexed span and the resources behind it.
Watchdog scans indexed spans for error patterns and abnormal latency, surfacing any tags attached to a disproportionate number of spans from traces ending in errors or executing slowly. For further convenience, Trace Outliers groups together the tags that often appear together on the same erroring or slow traces. This means that if Trace Outliers detects that a specific tagged infrastructure component is correlated with unusually high error rates, it will quickly identify tagged users with similar error rates that are also associated with those components, so you can immediately know where to focus your efforts. This also means that when a specific tagged resource is correlated with an unusually high latency, Watchdog will quickly flag it along with other tags that are associated with that resource so you can identify the root cause faster.

Whether identifying the resources behind a customer's issue, or finding customers affected by underperforming infrastructure or code, Watchdog Insights will save you time and effort by quickly identifying which elements have similar error rate or latency patterns.
Spot feature flag performance degradation
Feature flags allow engineering teams to safely test new features and deliver additional functionality to their users. When you enable a feature, you'll want to know quickly if it's behaving as expected or if it's affecting application performance. Watchdog can immediately identify whether indexed spans tagged with a new feature flag are showing performance degradation. This lets you quickly course correct and roll-back the feature or troubleshoot as needed.
AIOps and beyond
Watchdog is powered by artificial intelligence for IT operations (AIOps), which makes it easy for teams to spot unusual behavior and pinpoint the origin of an issue in their applications and more than 1,000 integrations. Our many AIOps-driven features include Watchdog Insights for Log Management, Metric Correlations, and Log Patterns. Monitoring your system with Datadog's AIOps-driven features can save you time detecting potential issues by quickly identifying abnormal behavior so you can start troubleshooting and reduce MTTR.
If you are not already using Datadog, sign up today for a 14-day free trial.

