
Shanel Huang
Senior Product Manager
The recent announcement that OpenTelemetry (OTel) has achieved CNCF graduation further reinforces OTel’s credibility as the industry standard for vendor-neutral telemetry. As organizations increasingly adopt the OpenTelemetry Protocol (OTLP), the OTel Collector, and OTel SDKs, they need an observability platform that supports OTel-native data without sacrificing flexibility or portability.
To meet these important customer requirements, Datadog has been significantly expanding its support for OTel-native observability. Whether by enabling you to send OTLP telemetry through vendor-neutral ingestion paths, to investigate issues with OTel-native data, or to manage OpenTelemetry Collectors across a fleet, Datadog supports OTel at every step. Behind the scenes, Datadog is also continuing to make significant contributions to the OpenTelemetry project to further enrich the open source standard with additional powerful features.
Send OTel data to Datadog in a vendor-neutral way
Many teams adopt OTel because they want the flexibility to choose how telemetry is generated, collected, processed, and routed. Using OTel SDKs, the OTel Collector, and OTLP lets teams build pipelines that fit their architecture.
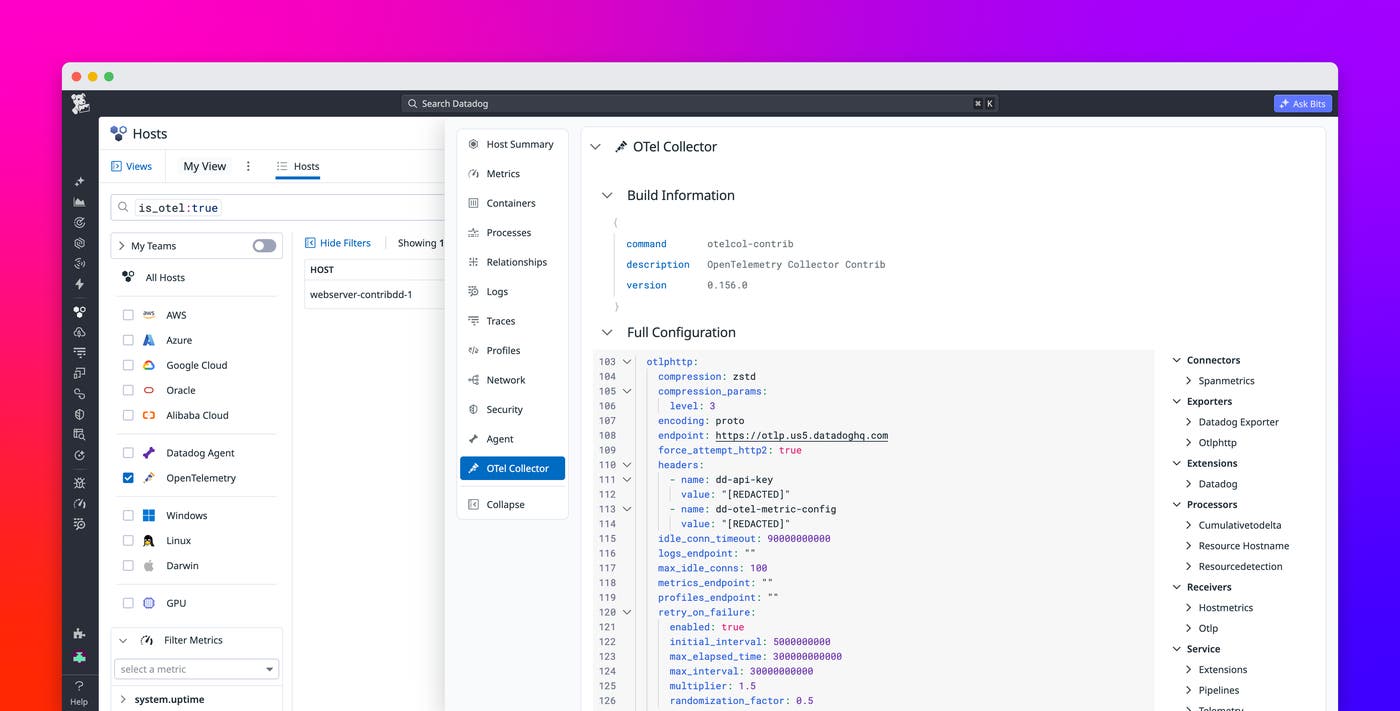
Previously, sending OTel data to Datadog via the OTel Collector required the Datadog Exporter. But Datadog now supports telemetry data ingestion via the standard OTLP HTTP Exporter, a fully vendor-agnostic component included in the standard OTel Collector. With this OTel-native instrumentation, teams can send OTel data to Datadog without relying on any proprietary components like the Datadog Agent, Datadog Exporter, or Datadog Connector. This method allows you to use standards-based telemetry end to end, from instrumentation to ingestion and analysis in Datadog, while supporting your journey toward complete vendor neutrality.
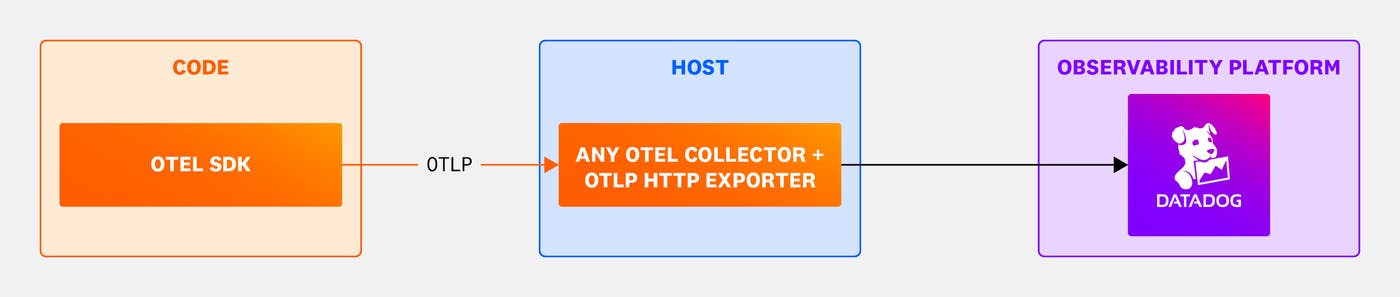
Additionally, for teams that don’t want to run an OTel Collector at all, Datadog’s direct OTLP intake endpoint is now generally available. With this feature, applications can send OTLP metrics, logs, and traces directly to Datadog without any intermediate collection layer, like an OTel Collector or Datadog Agent. This is particularly useful for managed services or serverless environments where running a sidecar or agent adds unnecessary overhead.

Investigate Kubernetes and application issues with OTel-native data
Once data from OTel sources reaches Datadog, it powers the same experience for products like Infrastructure Monitoring and Application Performance Monitoring (APM) that teams already rely on. No transformations, mappings, or Datadog-specific instrumentation are required. Previously, some of these experiences required signals gathered from the Datadog Agent or Datadog SDKs. Now, OTel-native data powers them directly.
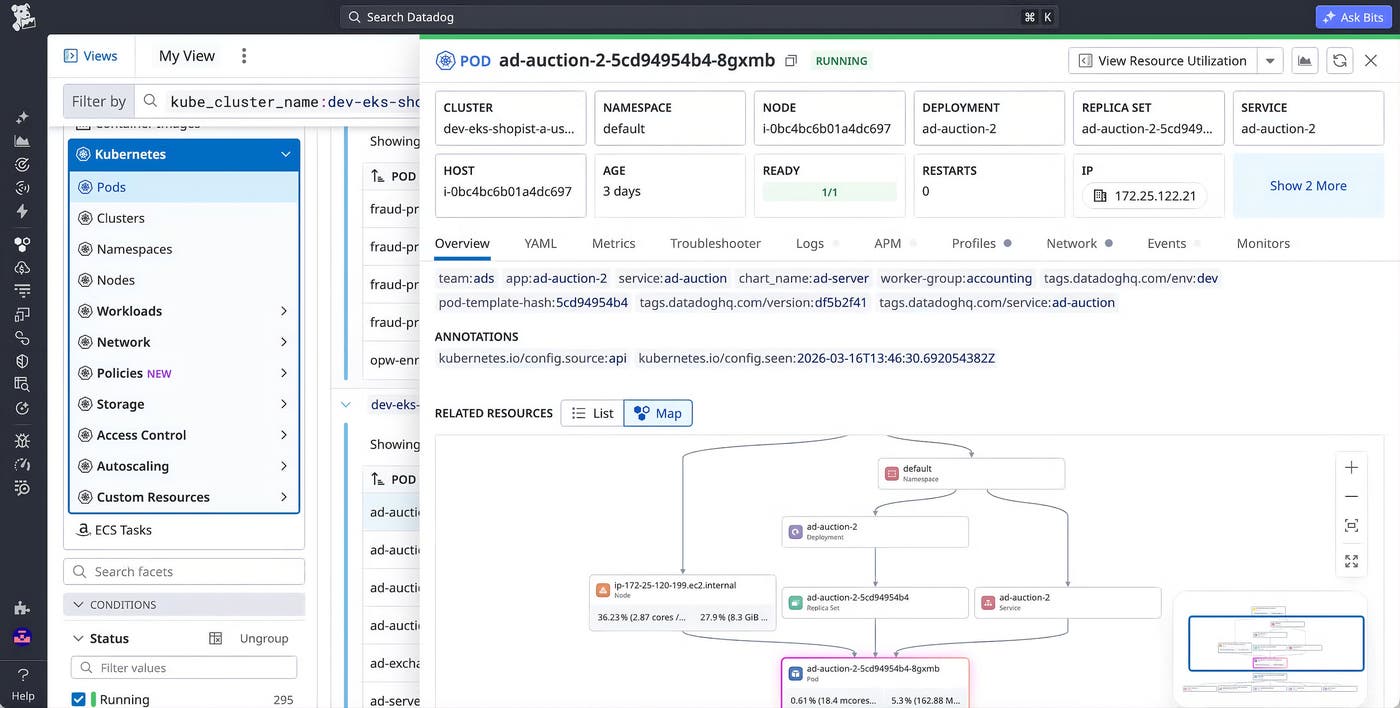
For example, the Kubernetes Explorer can now be populated directly with OTel data. Previously, this experience required signals from the Datadog Agent. Now, metrics collected from standard OTel receivers like kubeletstatsreceiver power the same cluster exploration and troubleshooting workflows, including table views of clusters, nodes, namespaces, and pods.
Datadog also handles semantic normalization automatically, so metrics collected from different receivers with varying units or types are represented across views in a consistent way. This means that, for teams running hybrid environments, the Kubernetes Explorer can join data from OTel pipelines and the Datadog Agent side by side. You can troubleshoot across clusters without worrying about how each signal was collected.
With the OTel-native instrumentation, Datadog APM also now works directly with services instrumented using OTel SDKs. Teams can view and query OTel-native traces in Datadog by using OTel span semantics and attributes, without requiring any translation or re-instrumentation.
Additionally, features like the Internal Developer Portal’s Catalog and each service page are powered by RED metrics generated from OTel trace data via the open source spanmetrics connector component. The connector is configured with dimensions that allow Datadog to compute host tags, peer services, and operation names directly from your traces. Out-of-the-box dashboards featuring runtime metrics from OTel SDKs are also automatically surfaced in Datadog, giving teams visibility into service health without requiring any Datadog-specific instrumentation.
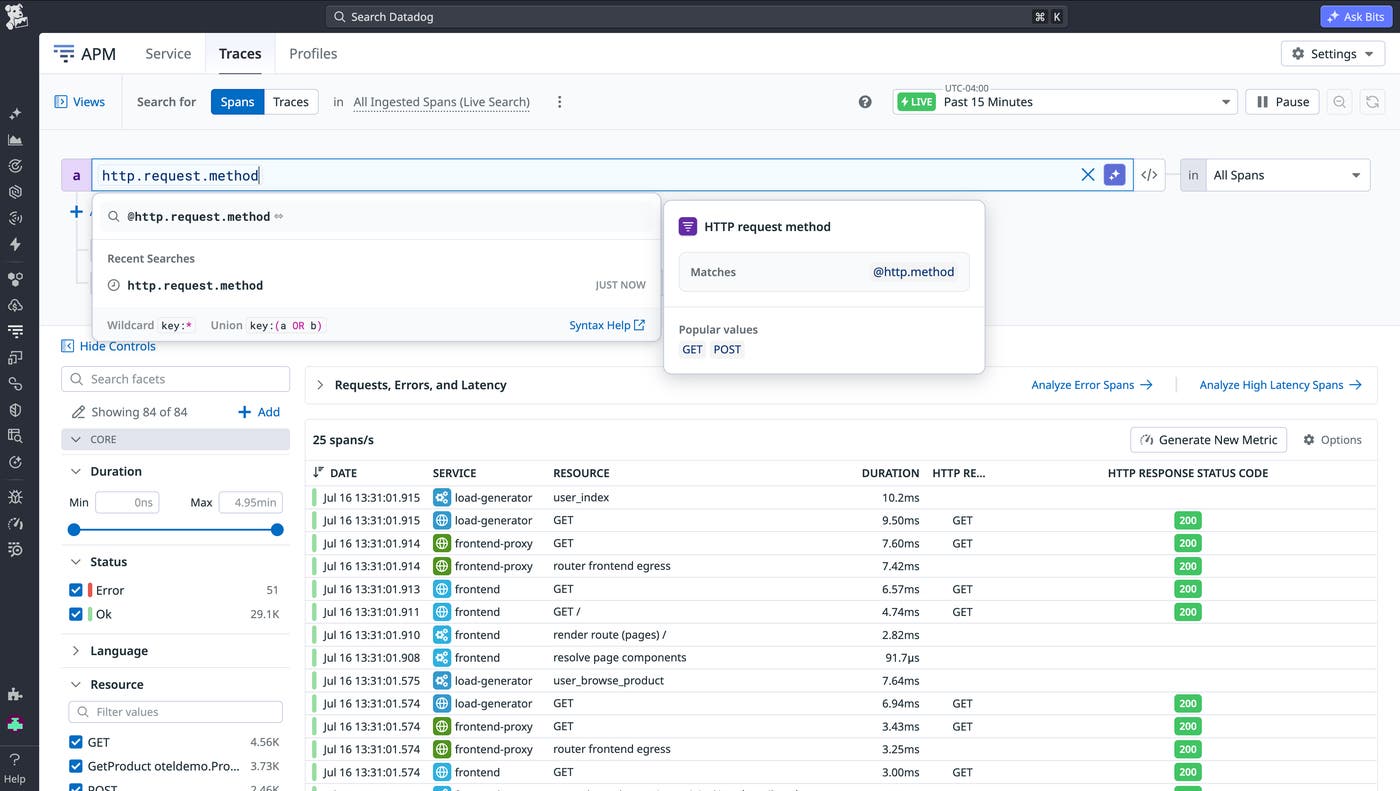
Whether telemetry comes from the Datadog Agent and Datadog SDKs or the OTel Collector and OTel SDKs, teams can adopt OTel incrementally and at their own pace. As a result, they can query OTel-native data in Datadog by using the same span semantics and attributes they’re most familiar with.
Investing in OTel beyond Datadog
Datadog’s commitment to OTel goes beyond supporting its own products. Datadog engineers actively contribute to OTel repositories, participate in special interest groups (SIGs), and help advance standards across areas such as the Collector, semantic conventions, profiling, sampling, real user monitoring, and Open Agent Management Protocol (OpAMP).
In March 2026, Datadog engineers co-authored the alpha release of OTel Profiles alongside contributors from Google, Elastic, and others. The work involved standardizing a unified profiling data format compatible with existing formats like pprof and integrating profiles as a first-class signal in the OTel Collector alongside traces, metrics, and logs.
As OTel’s profiling signal matures, Datadog intends to support it natively in its own profiling products. For example, the Full Host Profiler, now in Preview, is built on the OTel eBPF profiler. It profiles all processes on a host without requiring any code changes or instrumentation, giving teams visibility into every process, runtime, and language.
By investing upstream, Datadog is helping OTel mature as an open standard while making Datadog a stronger destination for teams that choose OTel. Customers can expect continued involvement from Datadog across OTel projects like real user monitoring, OpAMP, and semantic conventions for serverless workloads as the work on these standards continues.
Get started with adopting OpenTelemetry
Whether you’re just beginning to instrument services with OTel or expanding an existing deployment, Datadog can support your team at each step. You can build vendor-neutral pipelines with upstream OTel components; send OTLP metrics, logs, and traces to Datadog; and use Datadog’s infrastructure and APM workflows with OTel-native data. To learn more about Datadog’s OTel support, see our Getting Started with OpenTelemetry guide.
If you’re new to Datadog, you can sign up for a 14-day free trial.
