
Emily Chang
This post is the last of a 3-part series about monitoring Apache performance. Part 1 provides an overview of the Apache web server and its key performance metrics, and part 2 describes how to collect and monitor Apache metrics using native and open source tools.
If you've read Part 2 of this series, you know that there are a variety of ways to collect metrics from your Apache web servers, both natively and using open source tools. Although these methods are useful for checking Apache metrics in real time, they do not readily reveal long-term trends and patterns, nor do they offer any context about the rest of your infrastructure and applications. Datadog allows you to zoom out to see long-term performance trends across your Apache servers, or to zoom in to see your real-time and historical metrics at full granularity. And with more than 850 integrations with popular infrastructure technologies, plus distributed tracing and APM, Datadog enables you to monitor Apache in context with the rest of your stack.
In this post, we'll show you how to:
- set up Datadog's Apache integration to automatically collect most of the metrics discussed in Part 1 of this series
- collect and monitor data from your Apache access logs
- set up automated alerts to get informed of performance issues in real time
Set up Datadog's Apache integration
1. Configure Apache to send metrics
In order to collect metrics from Apache, you need to enable the status module and make sure that ExtendedStatus is on, as outlined in Part 2.
2. Install the Datadog Agent
The Datadog Agent is open source software that collects metrics and events from your hosts and forwards them to Datadog so that you can visualize, analyze, and alert on performance data, all in one place. Installing the Agent usually just takes a single command; see instructions for various platforms here. If you prefer, you can also install the Agent using tools like Chef, Puppet, or Ansible.
3. Configure the Agent to collect Apache metrics
Once you've installed the Agent, you will need to create an Apache configuration file so that the Agent will know where to fetch your Apache metrics. The location of the Agent's directory for integration-specific configuration files varies from platform to platform—consult the documentation for details.
In that directory, you should see an apache.d subdirectory, which contains conf.yaml.example, an example configuration file for Apache. Copy that file, save it as conf.yaml, and update it with the mod_status URL of your Apache instance (replacing "localhost" with the IP/hostname of your Apache instance, if you installed the Agent on a different host). The example below shows the configuration file for a user who is running Apache on the same host as the Agent.
init_config:
instances: - apache_status_url: http://localhost/server-status?auto # apache_user: example_user # apache_password: example_password # tags: # - optional_tagIf your Apache instance is not being accessed by localhost, make sure to enable access to your Agent's IP address in your Apache status module's configuration file, and replace "localhost" in the URL with the IP of your Apache server. You also have the option to add a user and password if you configured one (see Part 2 for details on how to only allow authenticated users to access the mod_status page).
Save your changes and exit the file. Restart the Agent to load your new Apache configuration file.
4. Enable the Apache integration
To start seeing your Apache metrics in Datadog, navigate to the Integrations page of the Datadog App, and click on the Apache integration tile. In the Configuration tab, click on "Install Integration". You should now be able to see your host reporting metrics in Datadog's infrastructure list, as shown below:

Customize your Apache dashboard
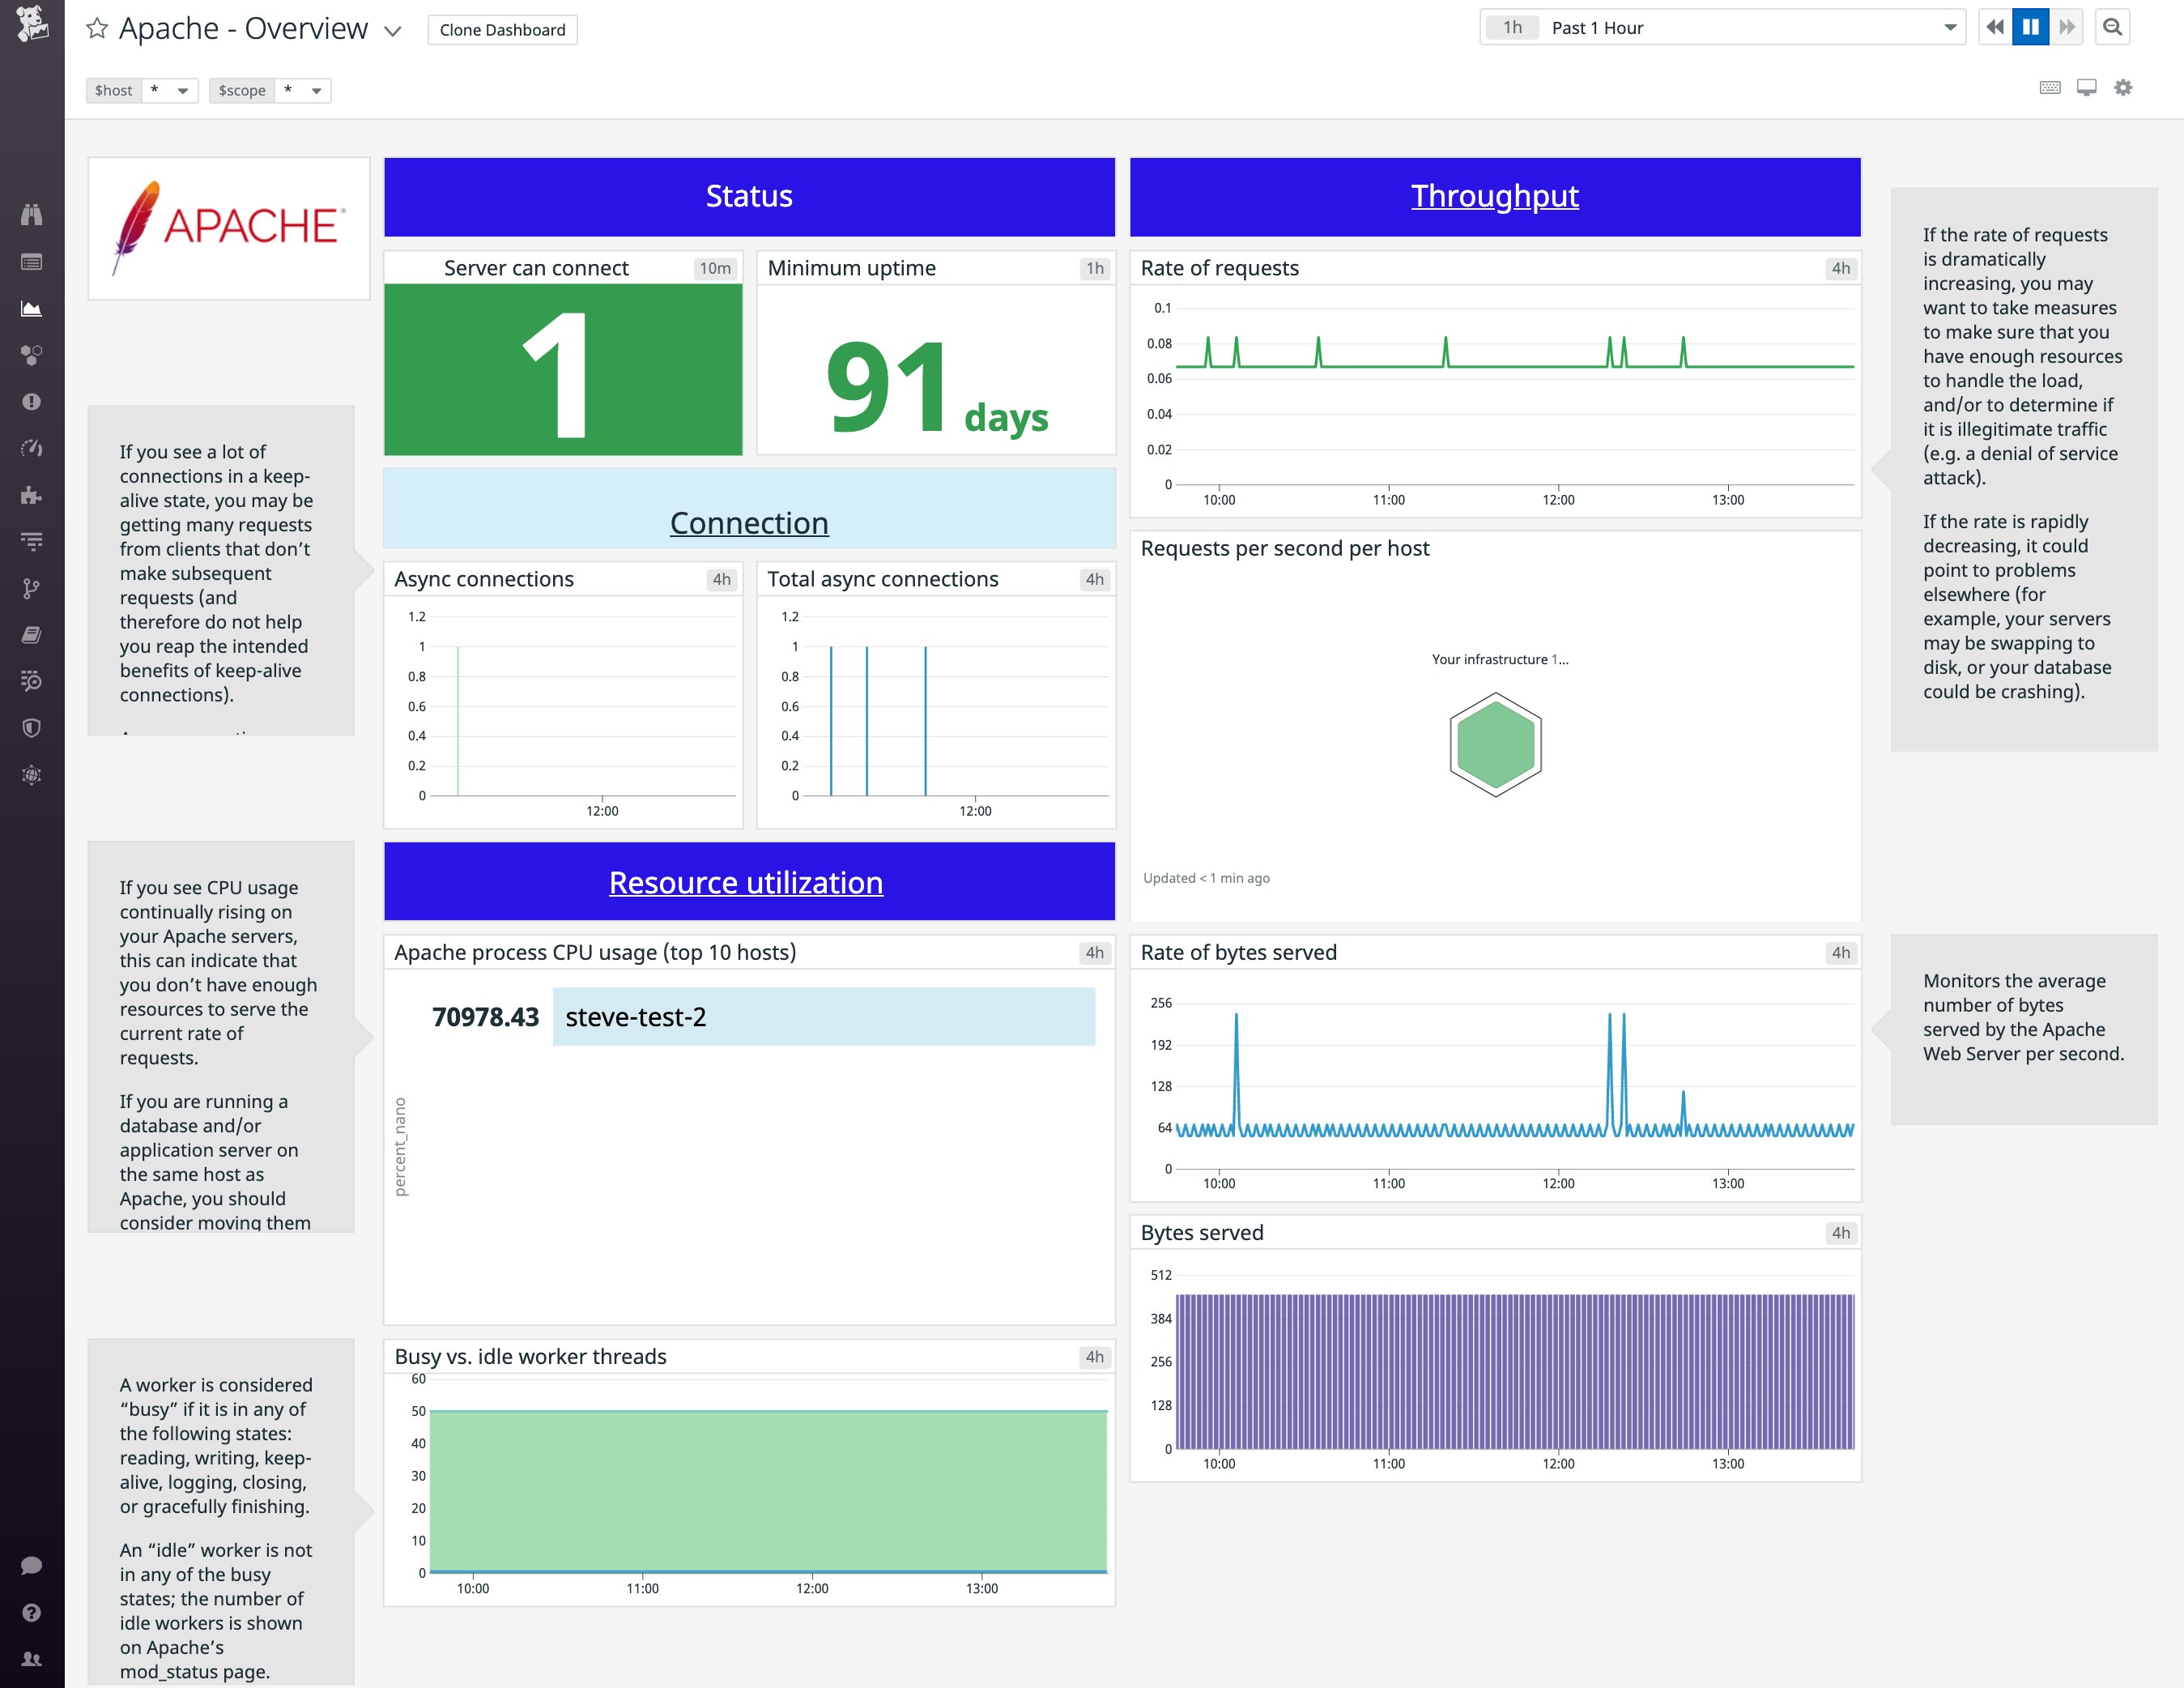
An Apache dashboard should now appear in your list of integration dashboards. This out-of-the-box dashboard displays most of the key metrics covered in Part 1 of this series, along with helpful pre-computed metrics that make it easier to understand real-time usage and performance. For example, the metrics apache.net.hits and apache.net.bytes are taken directly from mod_status and represent ever-increasing counters of the total number of requests and bytes that have been served over the lifetime of the server. The Datadog Agent provides these metrics, but also provides per-second rates (apache.net.request_per_s and apache.net.bytes_per_s), which are calculated by averaging the change in the number of requests and bytes served over each ~15–20 second collection period.
(Similarly, you should favor the real-time CPU metrics reported by the Datadog Agent over the CPU metrics collected from Apache's mod_status page, which are aggregated over the lifetime of the server.)
You can clone this dashboard and customize it with system-level metrics that are not available from Apache's status module, like memory usage and network traffic metrics, to add more context to your request throughput graphs. And because you can mix and match metrics from any source in Datadog, you can add metrics from databases, load balancers, or other services you are running alongside Apache, such as Tomcat or NGINX.
How to send Apache logs to Datadog
As mentioned in Part 1, certain metrics (including 5xx error rate and request processing time) are only available through Apache's access logs. With Datadog log management, you can parse, filter, and analyze your Apache logs by using facets like HTTP response code and URL path, and monitor them alongside the mod_status metrics you're already collecting.
Datadog's Apache logging integration supports two log formats by default—common and combined—and processes the log variables in those log formats into facets that you can search, visualize, and monitor in Datadog. If you're using a custom log format, skip ahead to see how you can set up Datadog to process your Apache logs.
Let's take a closer look at the variables that appear in the combined log format:
LogFormat "%h %l %u %t \"%r\" %>s %O \"%{Referer}i\" \"%{User-Agent}i\" combinedThe combined log format includes the following variables:
- remote hostname (
%h) - remote logname (
%l) - remote user (
%u) - the time Apache received the request (
%t) - the first line of the request in quotes (
\"%r\") - the final HTTP status of the response (
%>s) - the size of the response in bytes (
%O) - the referer (
\"%{Referer}i\") - the user agent (
\"%{User-Agent}i\")
Each of these log variables will be processed as a log attribute in Datadog. Note that the first line of the request (\"%r\") will appear as two log attributes: the HTTP request method (e.g., GET) and the URL path requested (e.g., /index.html).
Enable the Agent to collect logs
Log collection is disabled by default in the Datadog Agent, but you can enable it by making a quick update to the Agent configuration file, datadog.yaml. The location of the file will vary according to your platform; see the documentation for details. You'll need to uncomment the line that starts with logs_enabled and set it to true:
# Logs agent is disabled by defaultlogs_enabled: trueUpdate the Agent's Apache configuration file
Now you'll need to edit the Datadog Agent's configuration file for the Apache integration (conf.d/apache.d/conf.yaml). Update the logs section to specify the correct path to your access log:
logs:
# - type : (mandatory) type of log input source (tcp / udp / file) # port / path : (mandatory) Set port if type is tcp or udp. Set path if type is file # service : (mandatory) name of the service owning the log # source : (mandatory) attribute that defines which integration is sending the logs # sourcecategory : (optional) Multiple value attribute. Can be used to refine the source attribute # tags: (optional) add tags to each logs collected
- type: file path: /var/log/apache2/access.log service: apache_gob_test source: apache sourcecategory: http_web_accessThis configuration will tag all of your Apache logs with the name of the service specified above (service:apache_gob_test), which will help you easily link logs to any request traces and application performance metrics from that same service. Save and exit the file, and restart the Agent by using the correct restart command for your platform, according to the documentation.
Quickly reference key metrics and commands in our Apache HTTP Server cheatsheet.
Inspect your Apache access logs in Datadog
If you navigate to your Datadog account, you should see your Apache logs in the Log Explorer view. In the sidebar, you can click to filter the logs by one or more facets, such as the host, service, or source you're interested in viewing.
Datadog's Apache integration includes a log processing pipeline that automatically parses Apache logs that adhere to either the combined or common log format. This means that it can parse and extract key information from the log message, which is useful for graphing and alerting. In the Web Access section of the sidebar, you can filter by one or more of these facets, such as URL path or HTTP status code.
In the example log entry below, you can see that Apache received a GET request for the URL path /contact, and that it returned a status code of 404. All of this information was automatically parsed from the log message.
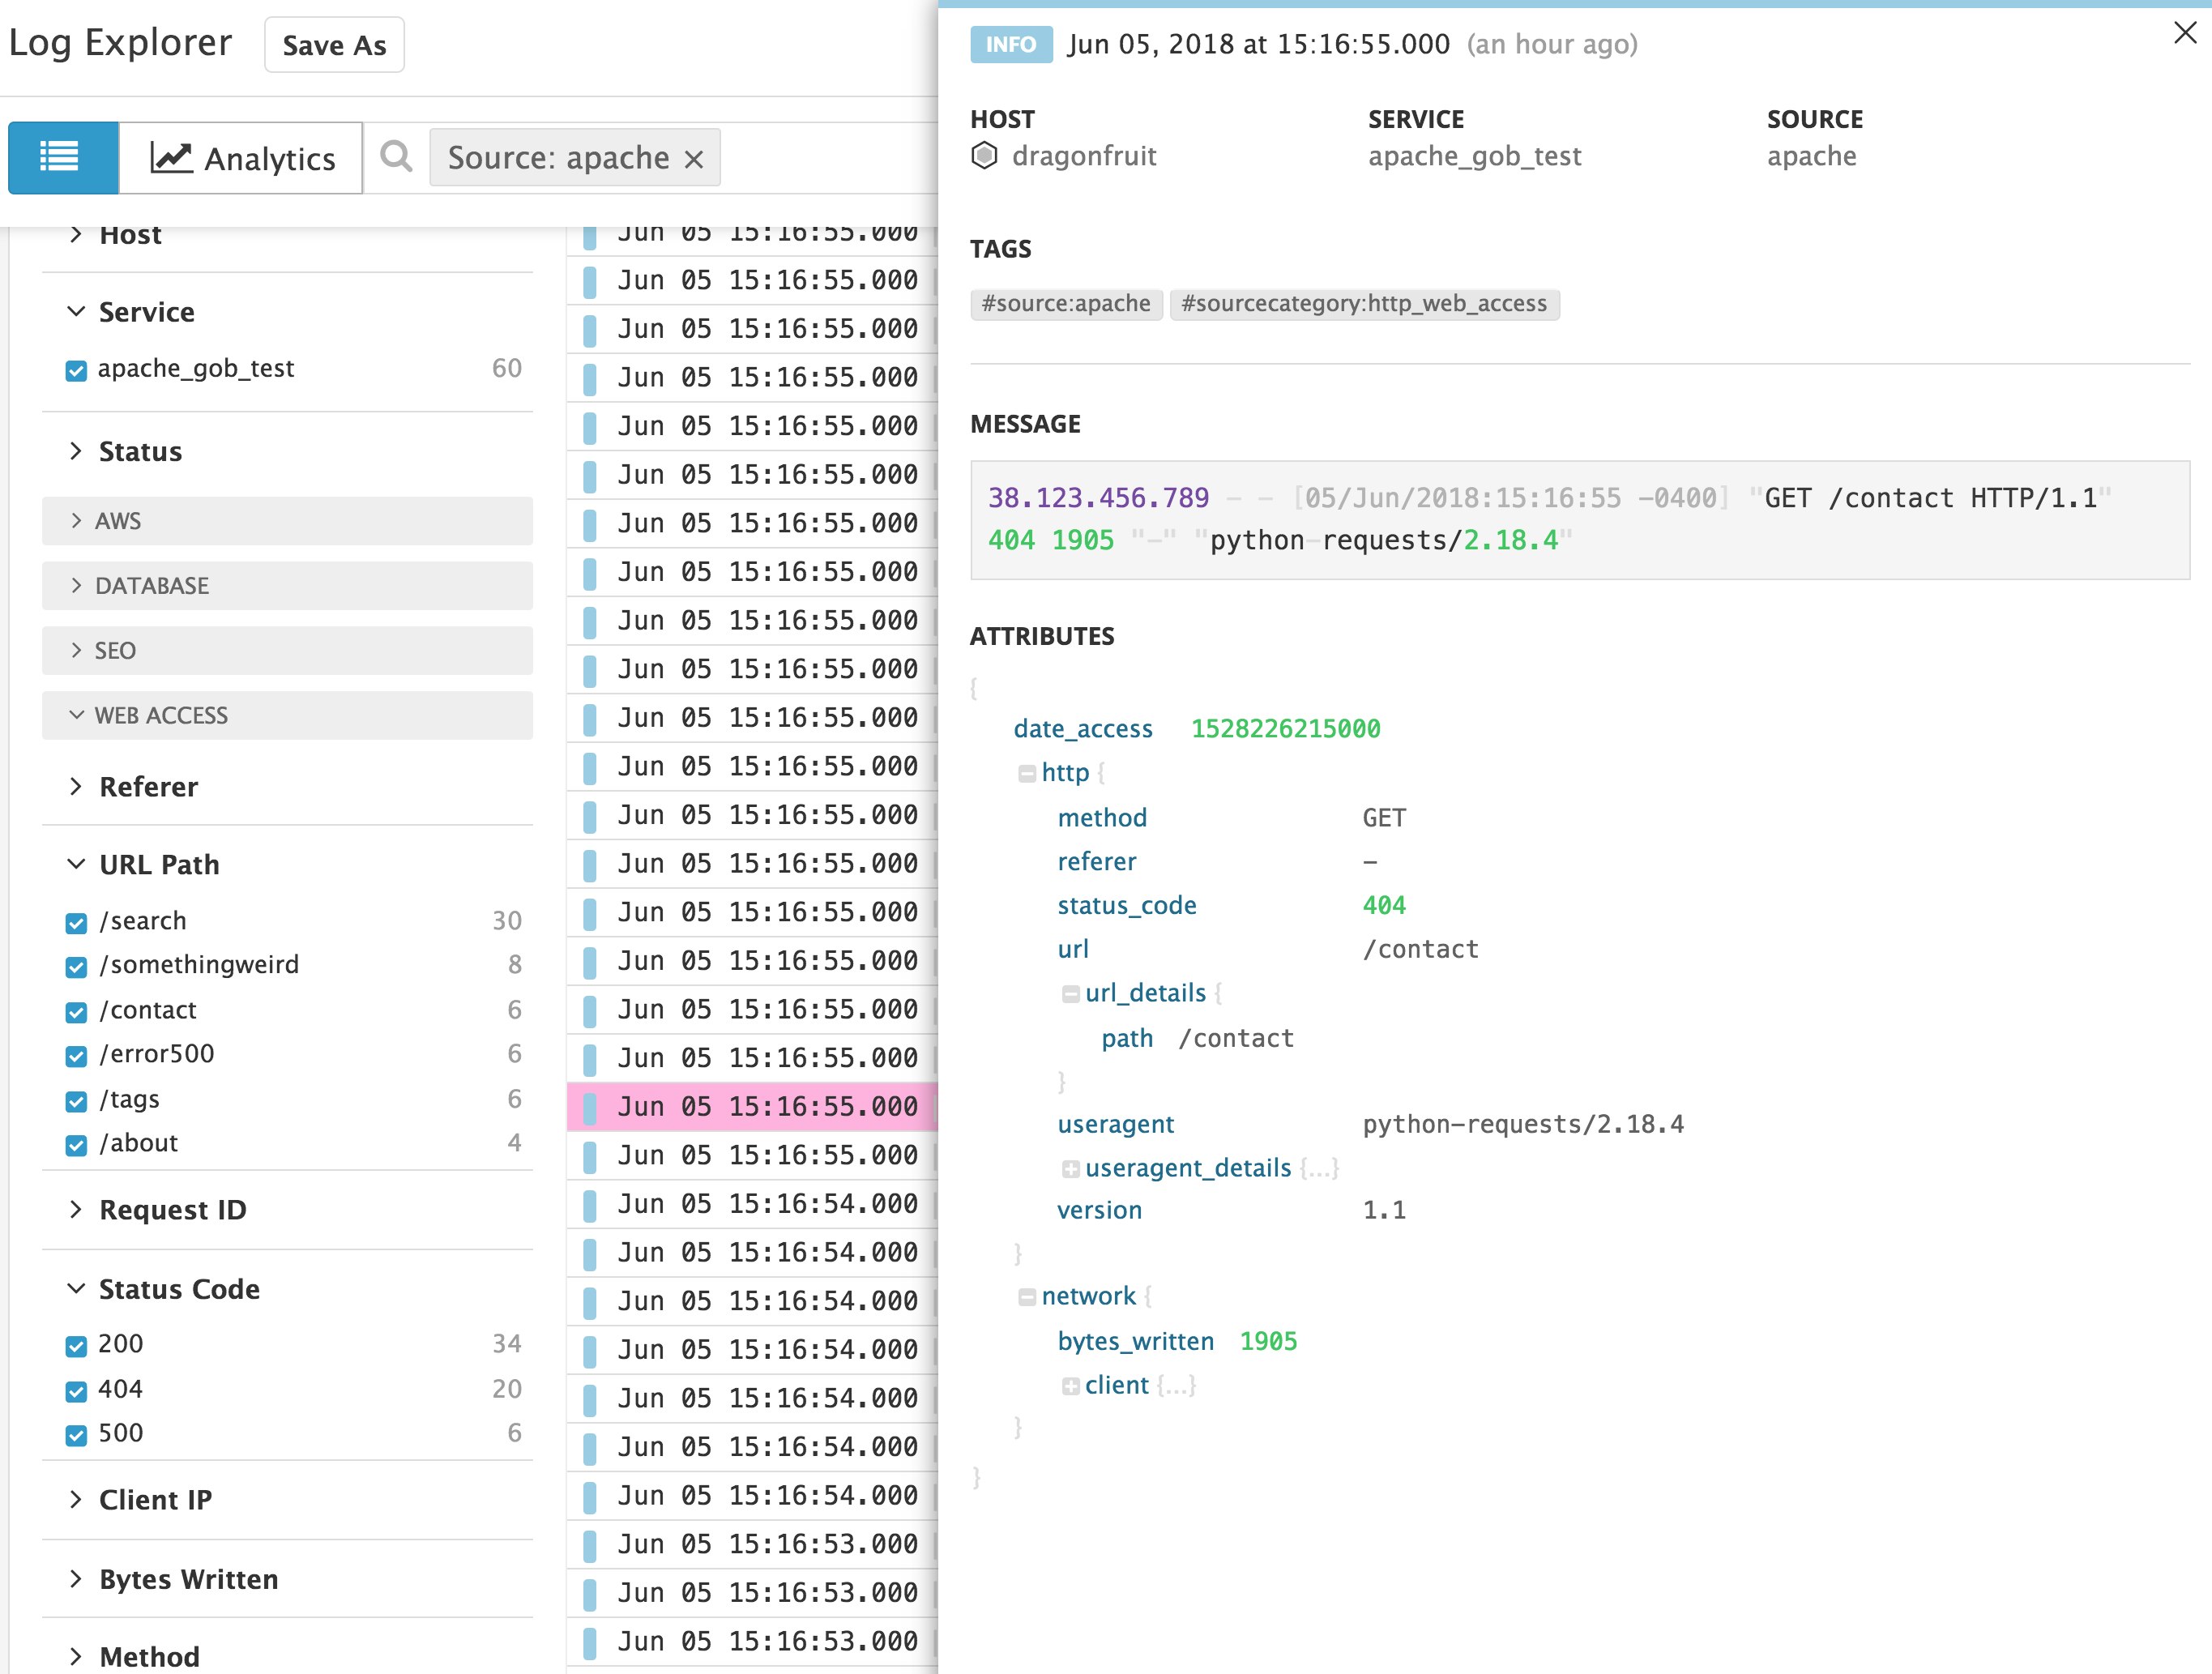
As you are inspecting a log, you can navigate to other sources of monitoring data to get a better sense of what was happening. You can click on the host to view a dashboard of system-level metrics from the host that generated this log, or click on the service to view application performance metrics and request traces collected over the time period in question.
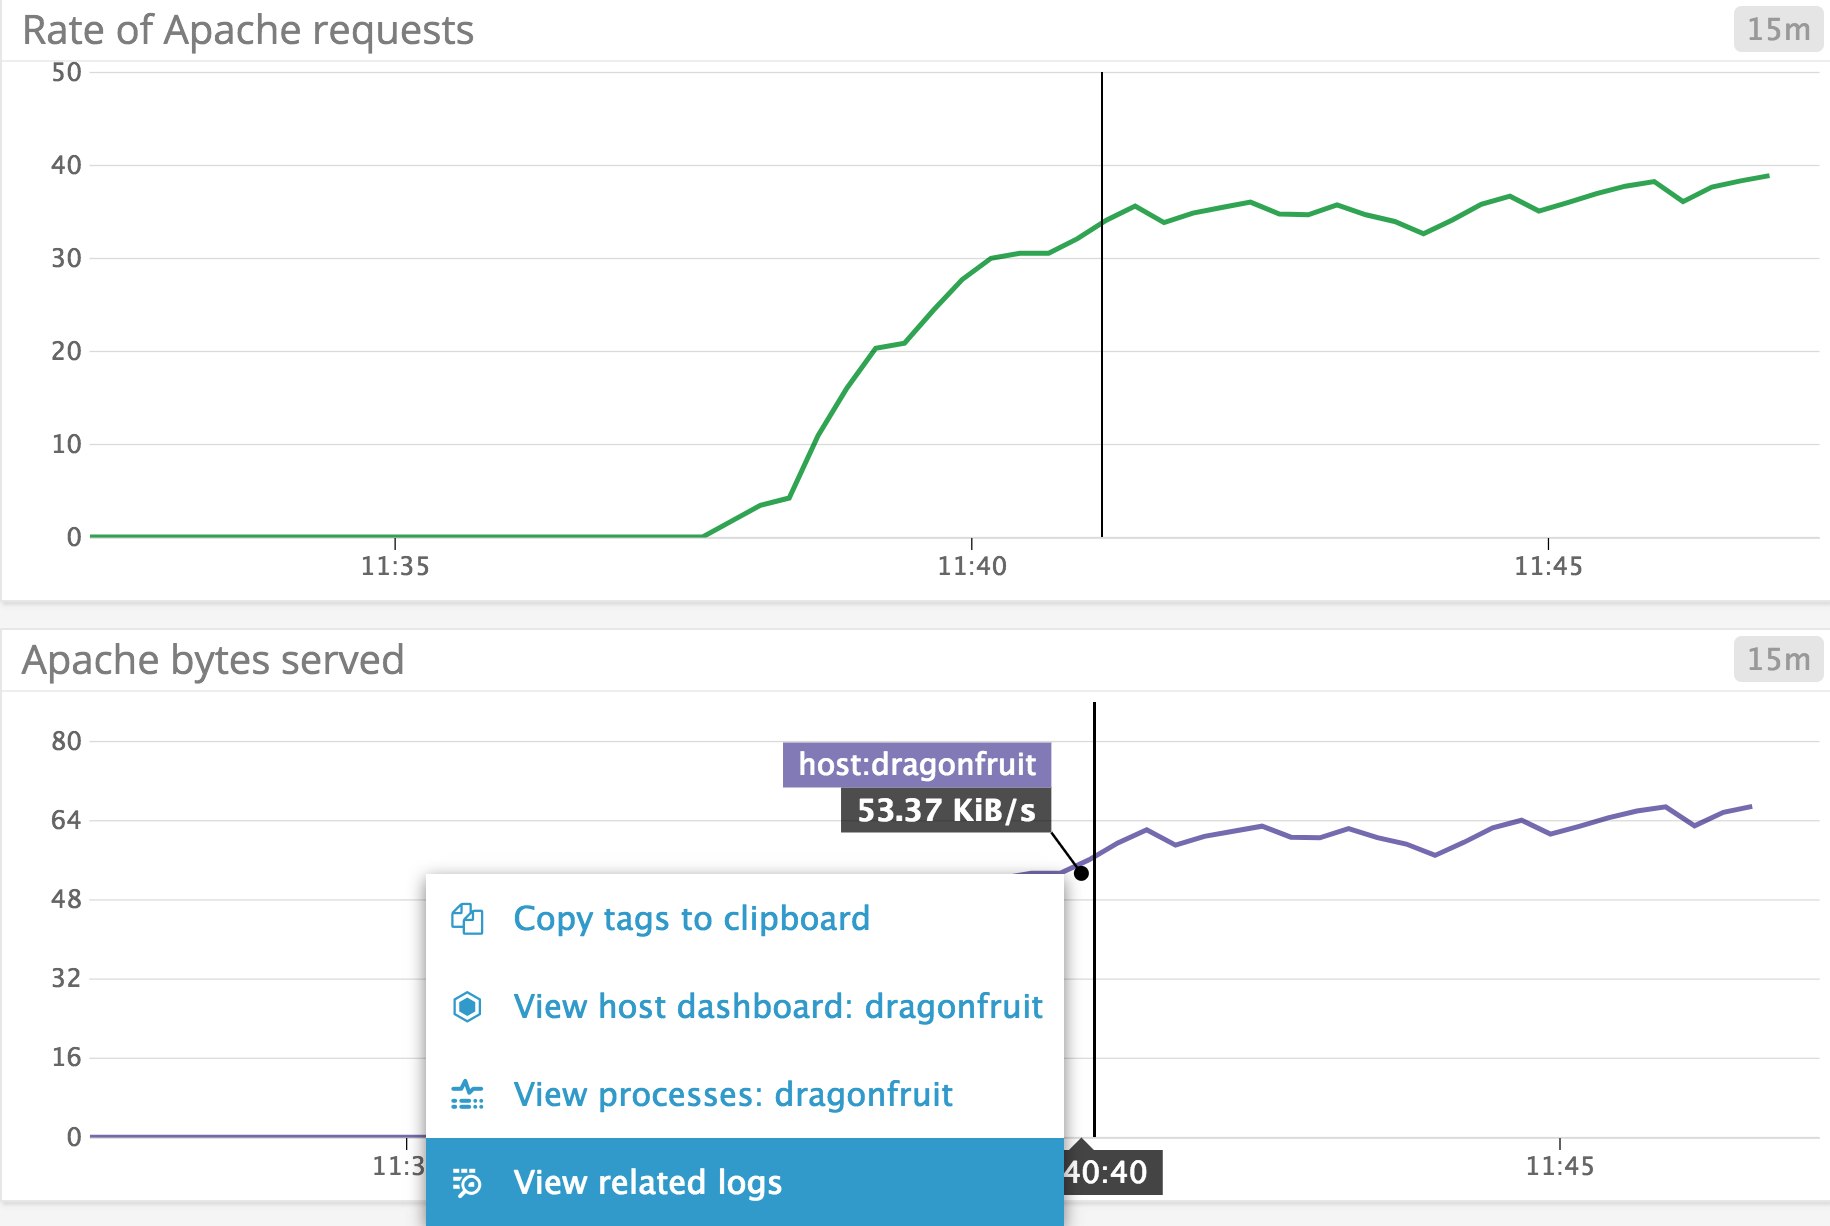
Similarly, you can easily pivot from any metric graph to view logs that help provide more context about the situation. For example, if you see a spike in any server's rate of Apache requests, you can investigate by clicking the graph to view related logs collected from the server during that time period.
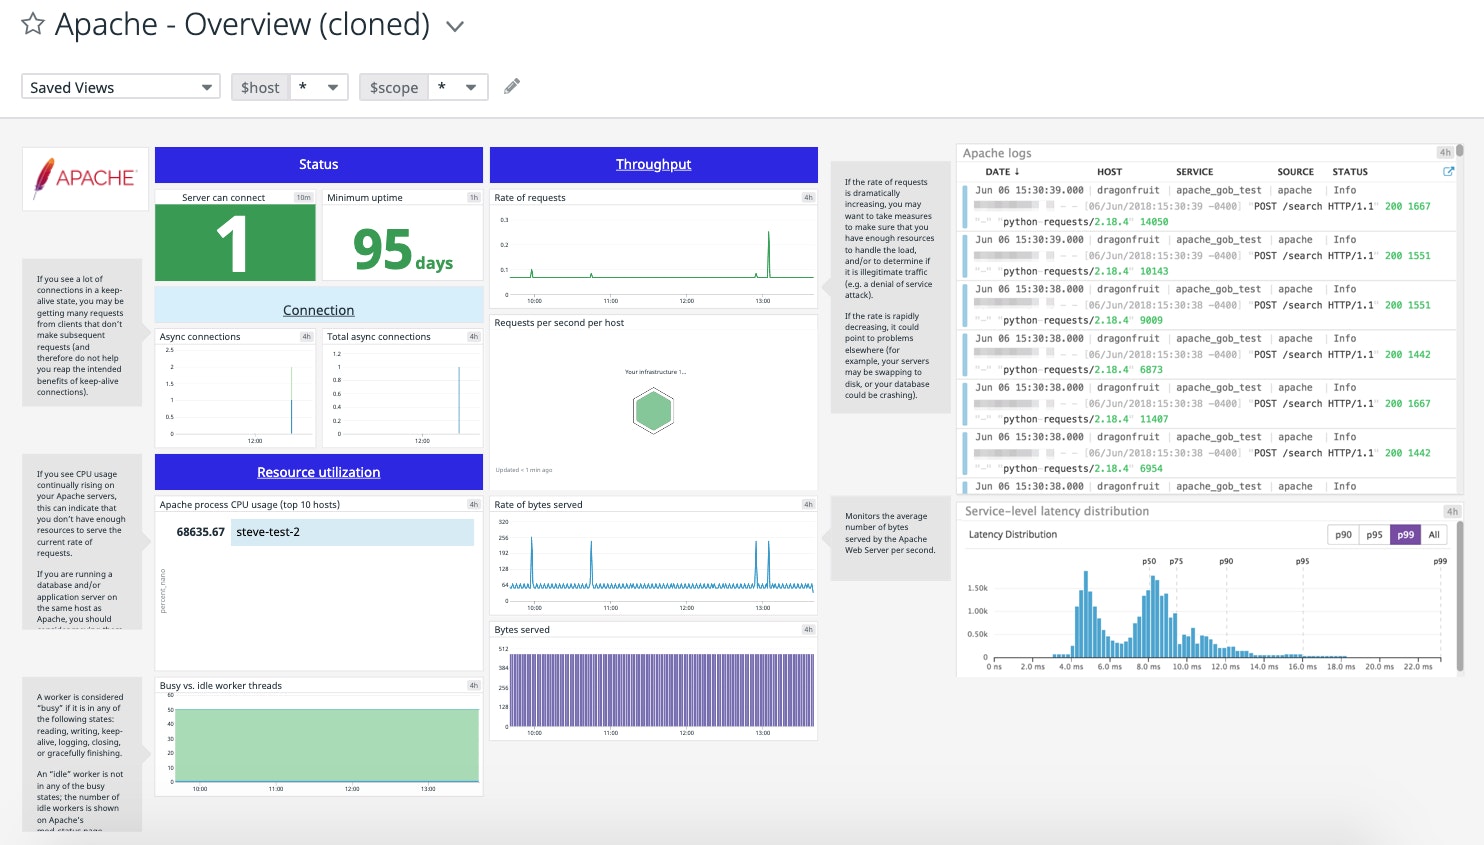
And, because you have access to all of these sources of data in one place, you can create custom dashboards that provide deep visibility into the health and performance of your Apache web servers, whether that data comes from mod_status or the access logs.
Doing more with custom Apache logs
We've seen how Datadog's Apache integration automatically parses useful information from your logs if they're following the common or combined log format. However, if you'd like to use a custom log format, you can modify the pipeline so that the Agent can parse your logs for any data you want to be able to monitor and analyze in Datadog.
In this section, we will show you how to collect request processing time as a metric from your Apache logs, and analyze this data in Datadog.
Create a custom log format for your Apache access log
Apache provides many options that allow you to customize the type of data you would like to include in the access log. Consult the Apache documentation for a list of all of the variables that you can use.
For example, let's say that you want to create a custom log format that is identical to the combined format, except that it also logs the amount of time that it took to process the request (%D):
LogFormat "%h %l %u %t \"%r\" %>s %O \"%{Referer}i\" \"%{User-Agent}i\" %D" reqtimeAdd this line to your Apache configuration file (apache2.conf). The last word should be whatever "nickname" you want to apply to your custom LogFormat (in this example, reqtime). You'll need to use this nickname in the next step.
Apply your custom log format
To apply this custom log format, you'll need to update your Virtual Host's configuration file. Locate the line that starts with CustomLog /path/to/apache/access.log. The last word in the line specifies which LogFormat the access log should use, so you need to edit it to point to your newly created reqtime log format (along with the correct path to your Apache access log):
CustomLog /path/to/apache/access.log reqtimeSave and exit the file, and restart Apache so that the changes will take effect. Your Apache server should now start including the request processing time in each access log entry.
Clone and customize the Datadog Apache log processing pipeline
To create a new pipeline to parse your custom log format, locate the Apache integration pipeline on the Log Pipelines page of your Datadog account, and click "Clone."
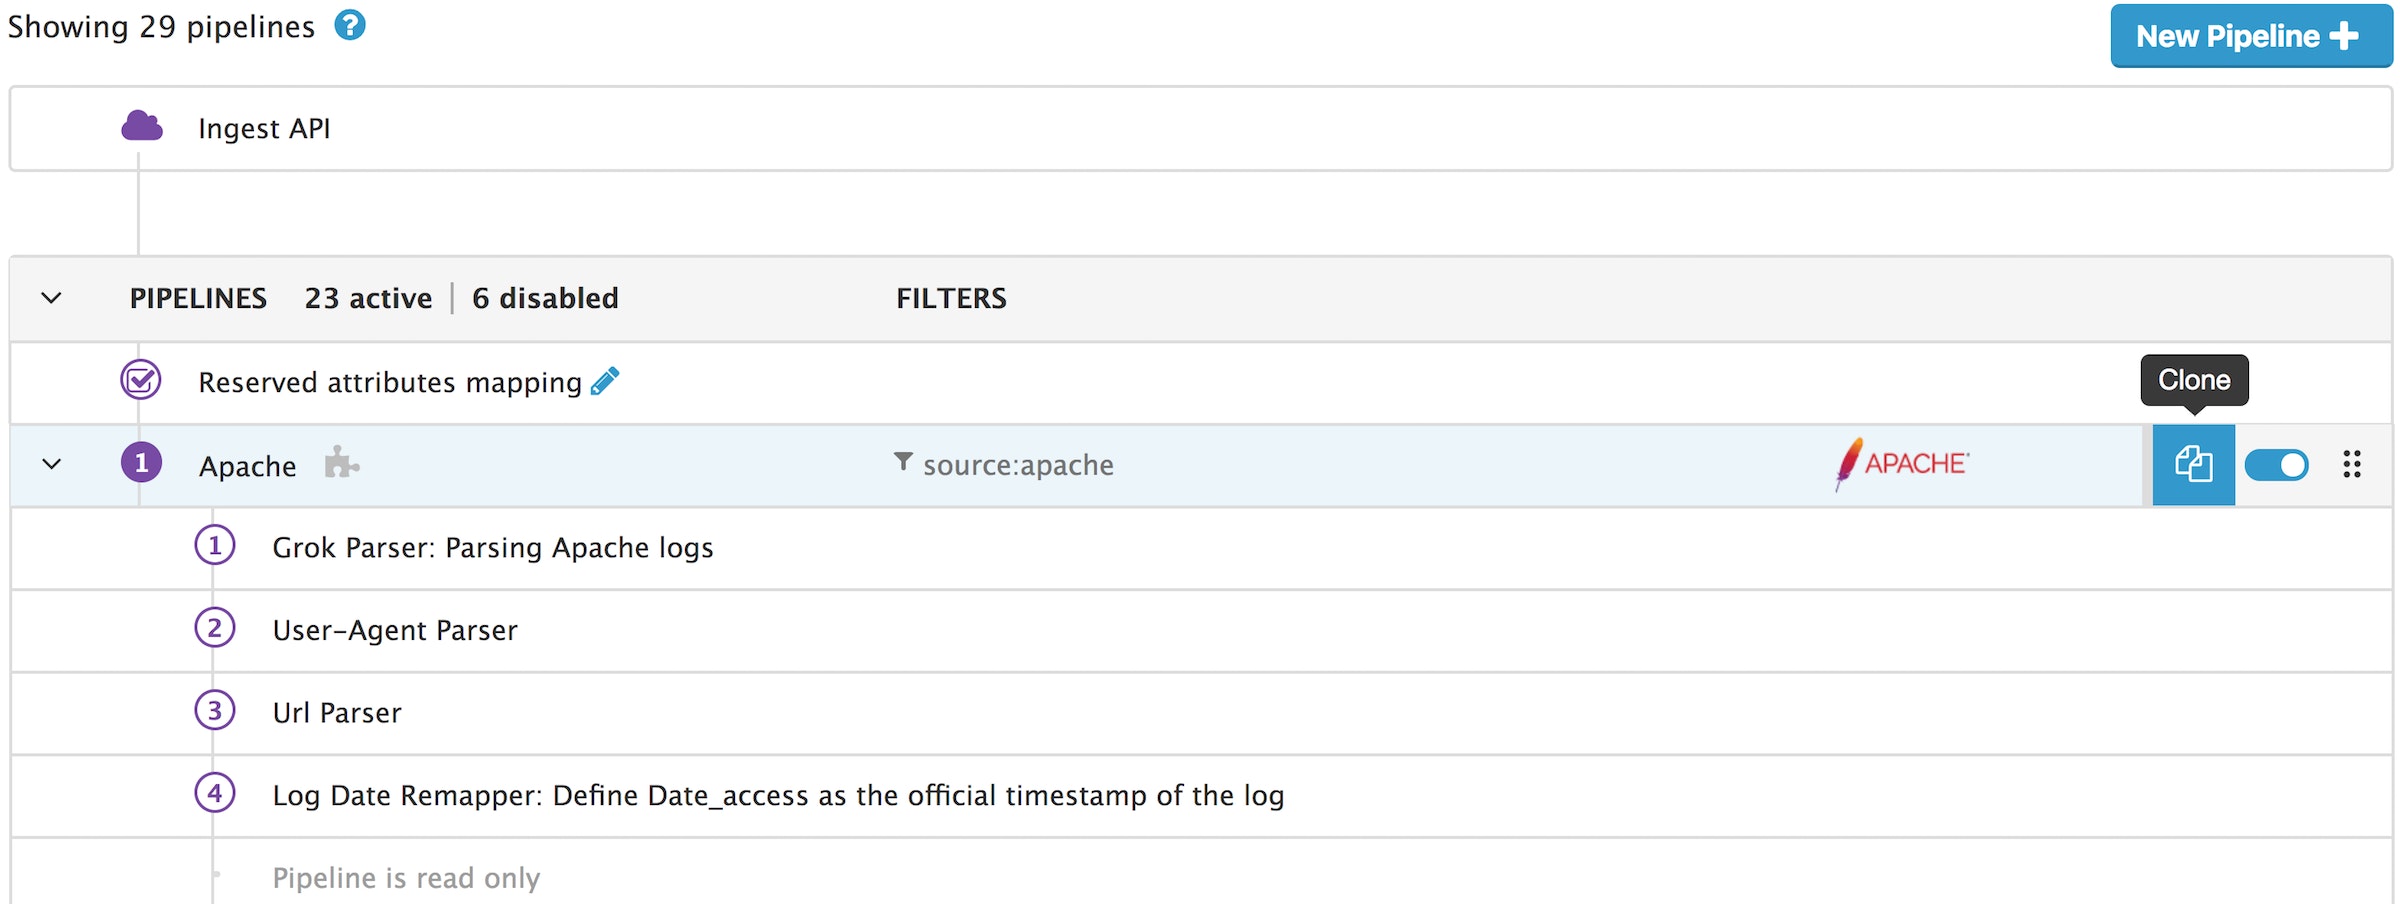
If you inspect the Grok Parser step of the cloned Apache integration pipeline, you can see that it includes two parsing rules that are designed to extract Apache log variables as attributes from the common and combined log formats in Apache:
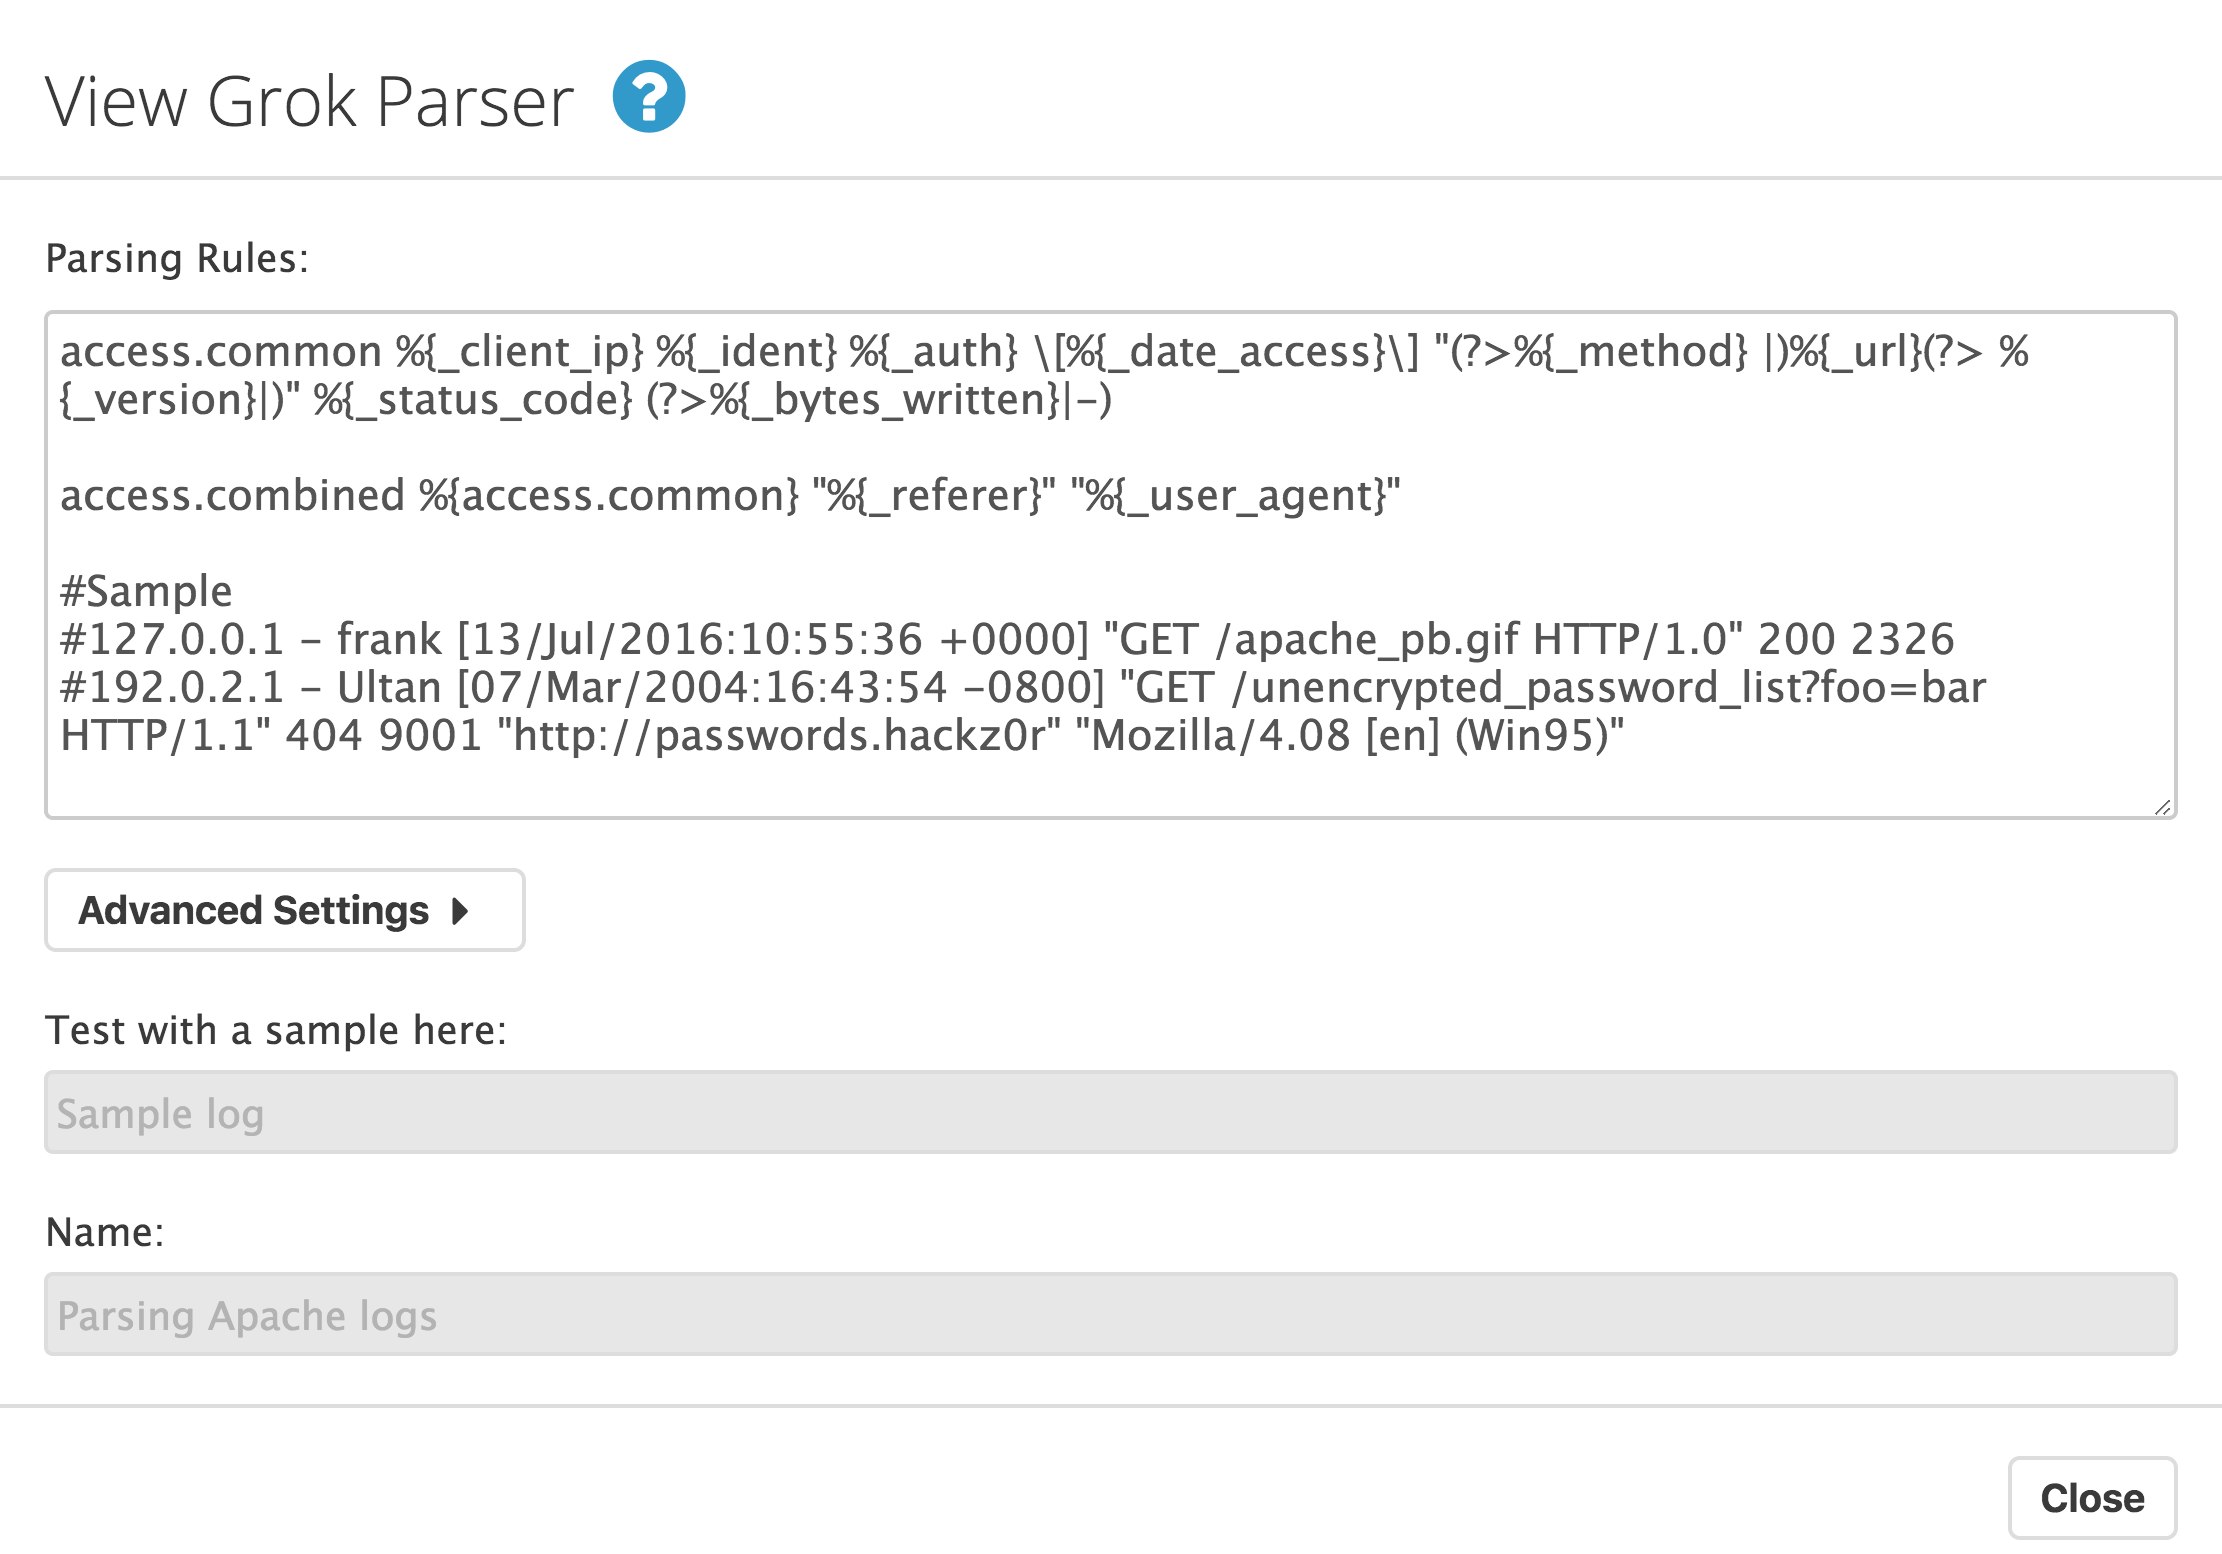
In this example, we've added a new parsing rule, access.reqtime, which builds on the existing access.combined rule. The new rule will parse the variable that appears as an integer at the end of our custom log format (request processing time), and extract it as an attribute called request_time:
access.reqtime %{access.combined} %{integer:request_time}After you save and enable the pipeline, Datadog will start processing your incoming Apache access logs correctly. This is just one example of how you might parse a custom log format for information you'd like to collect—consult the documentation for more details about parsing your logs.
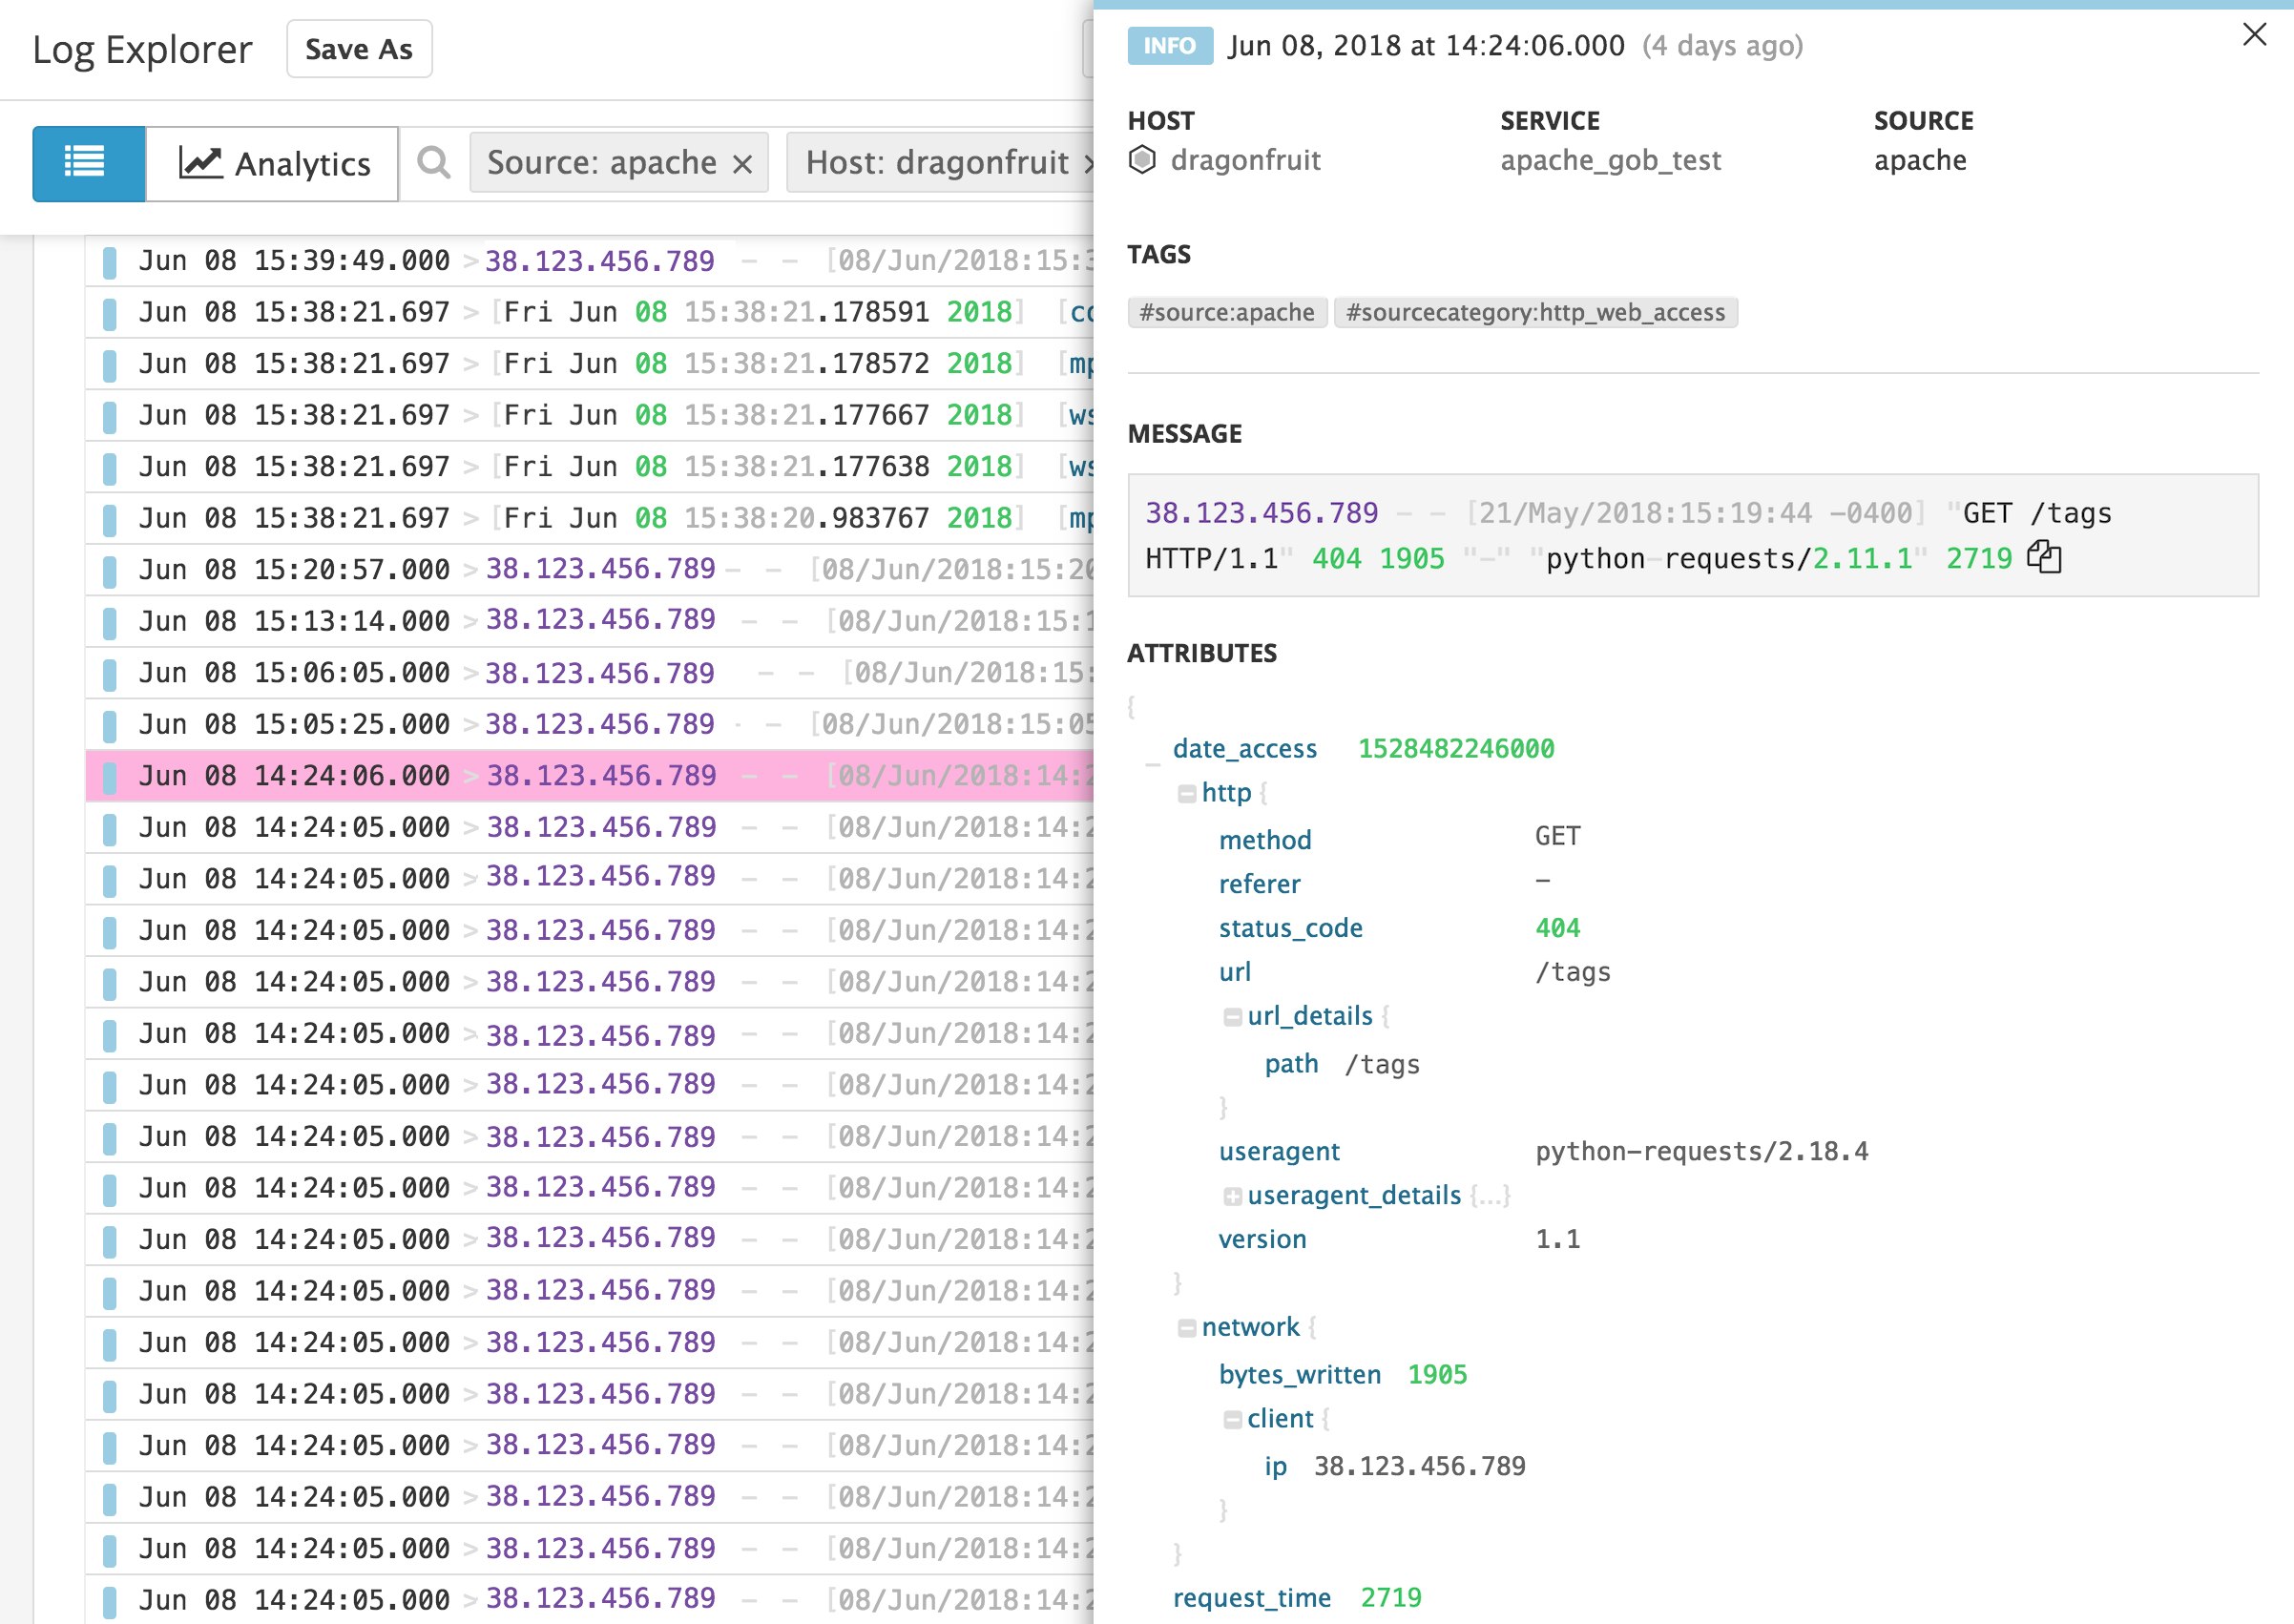
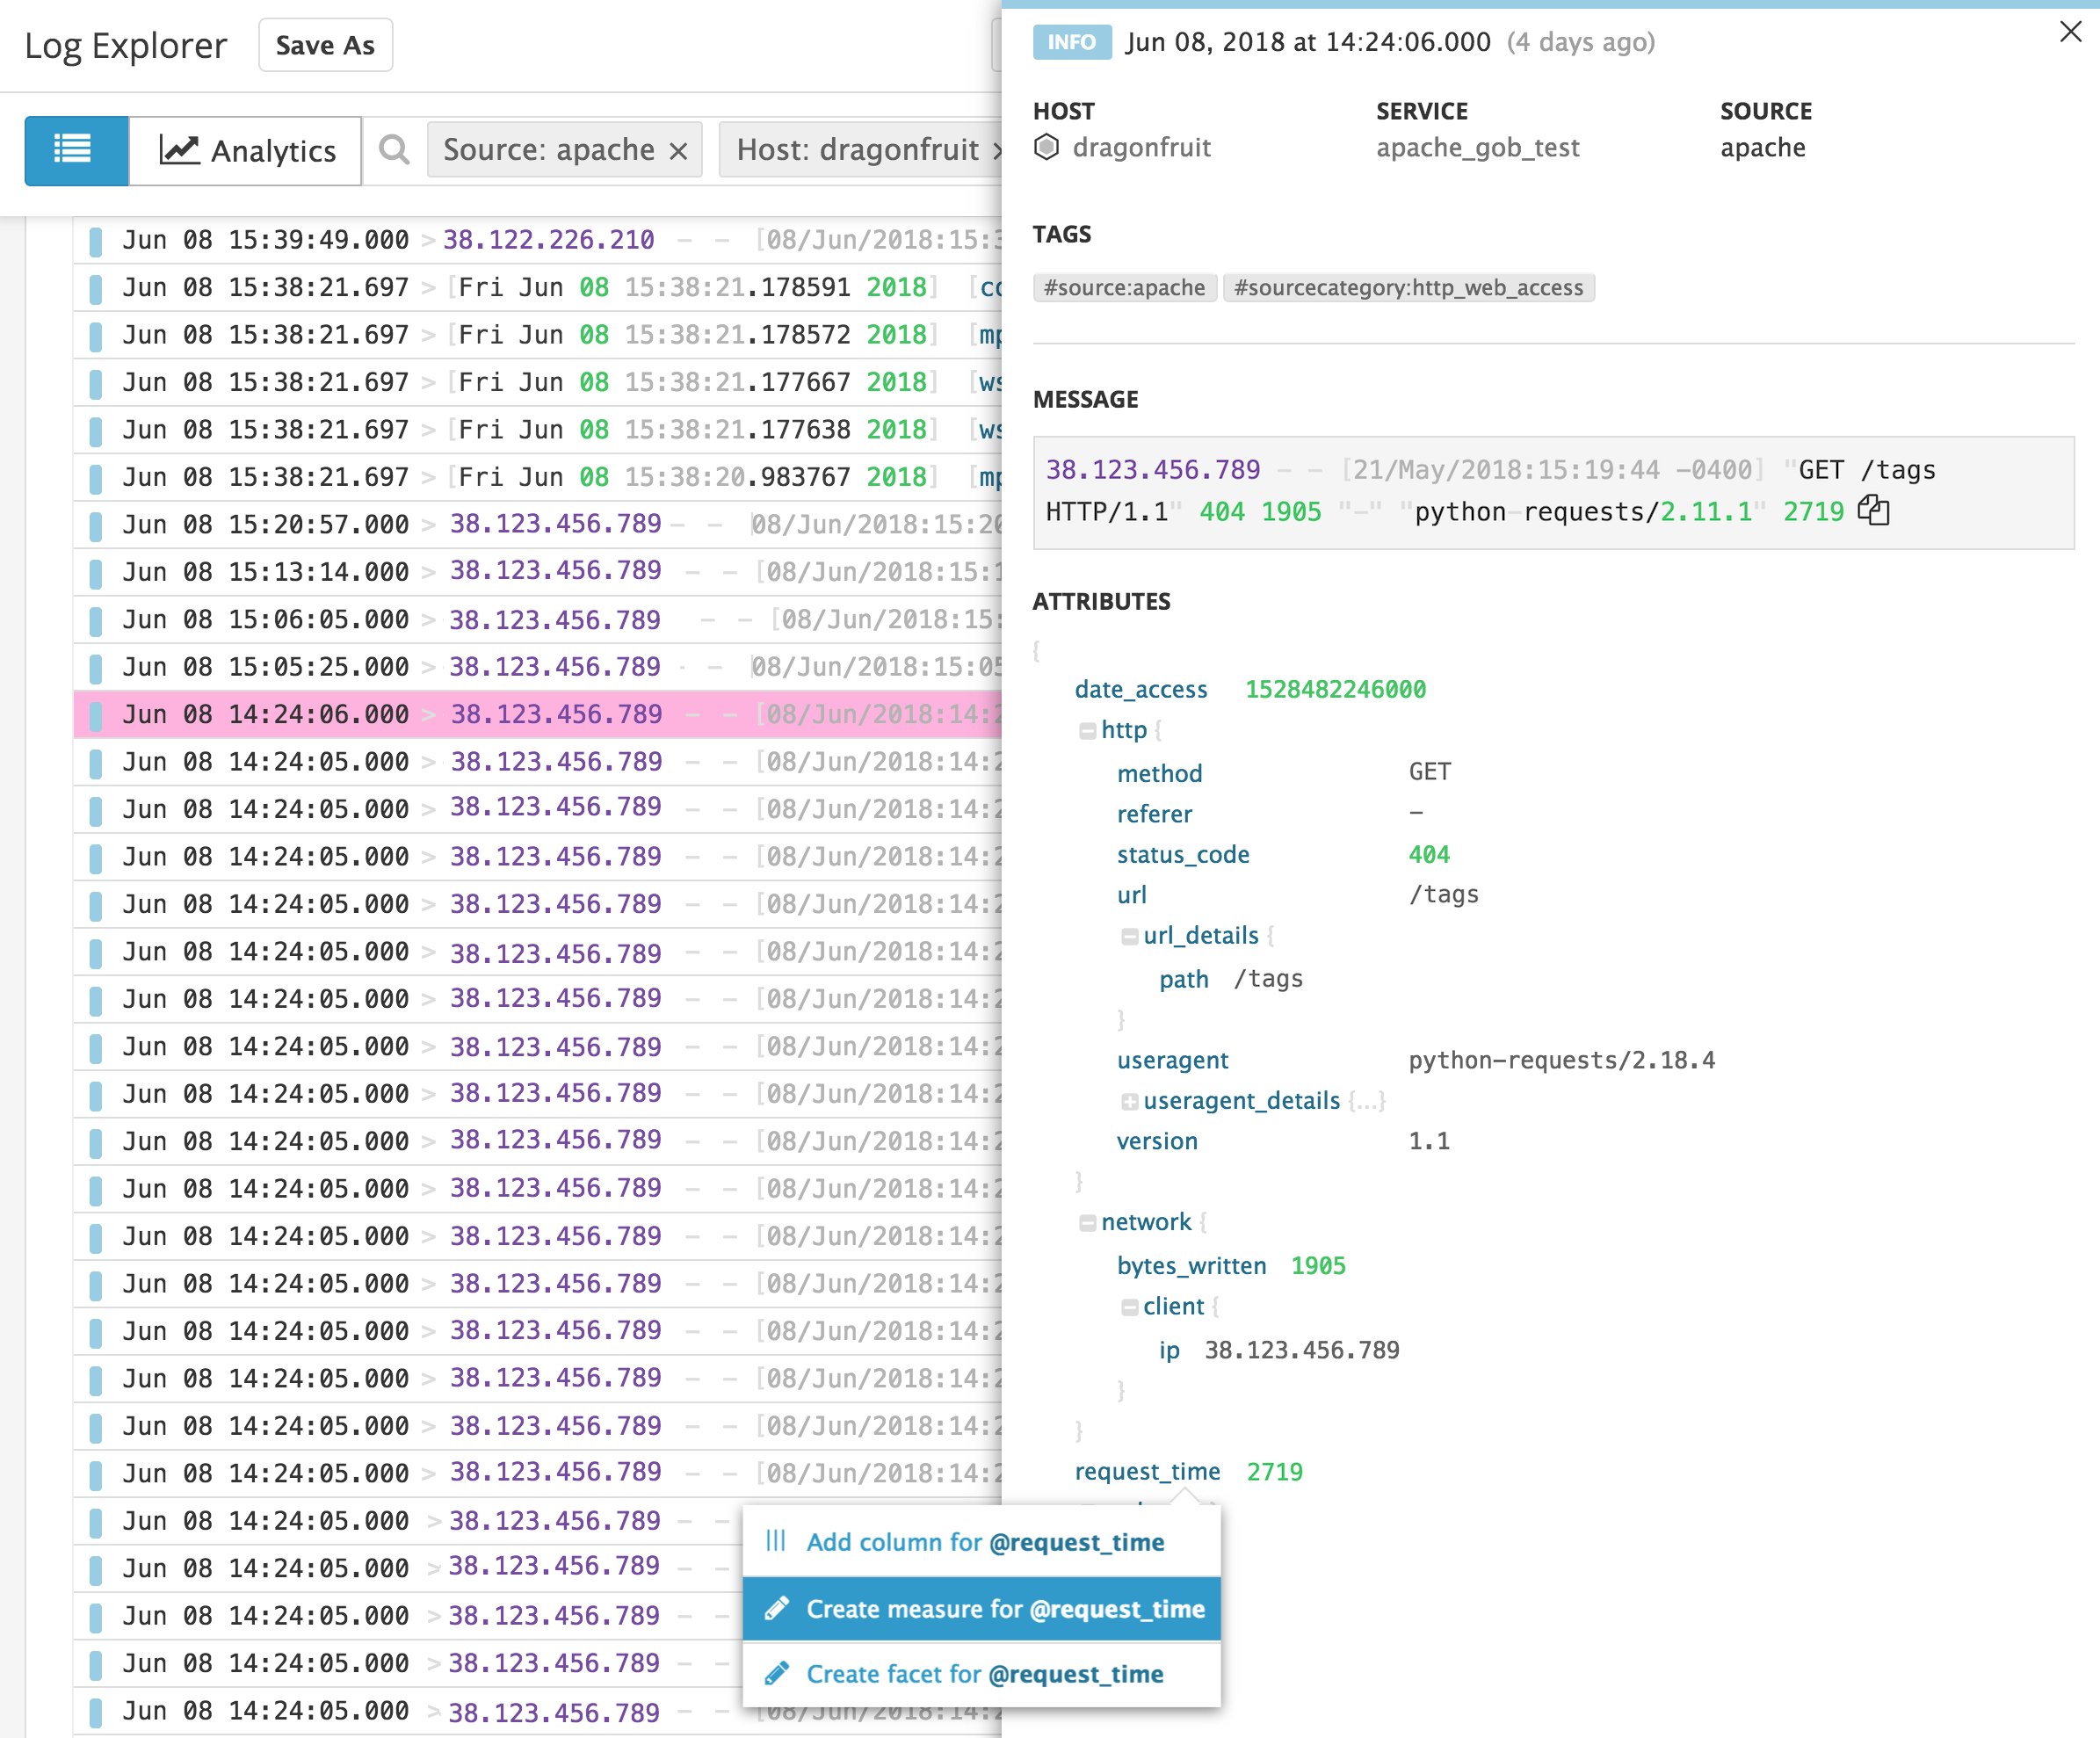
Create a measure for the log variable
Now that Datadog is parsing the request processing time from your custom Apache log format, you can create a measure for this attribute, in order to use it like a metric in graphs and alerts. When you're inspecting a log entry, you can create a measure for any numerical log attribute by clicking on it and selecting "Create measure for @<LOG_ATTRIBUTE_NAME>," as shown below.
You can give the measure a descriptive name (e.g., "Apache Request Time") and indicate the correct unit for the measure. In this case, since Apache measures the request processing time (%D) in microseconds, we've specified the unit accordingly.
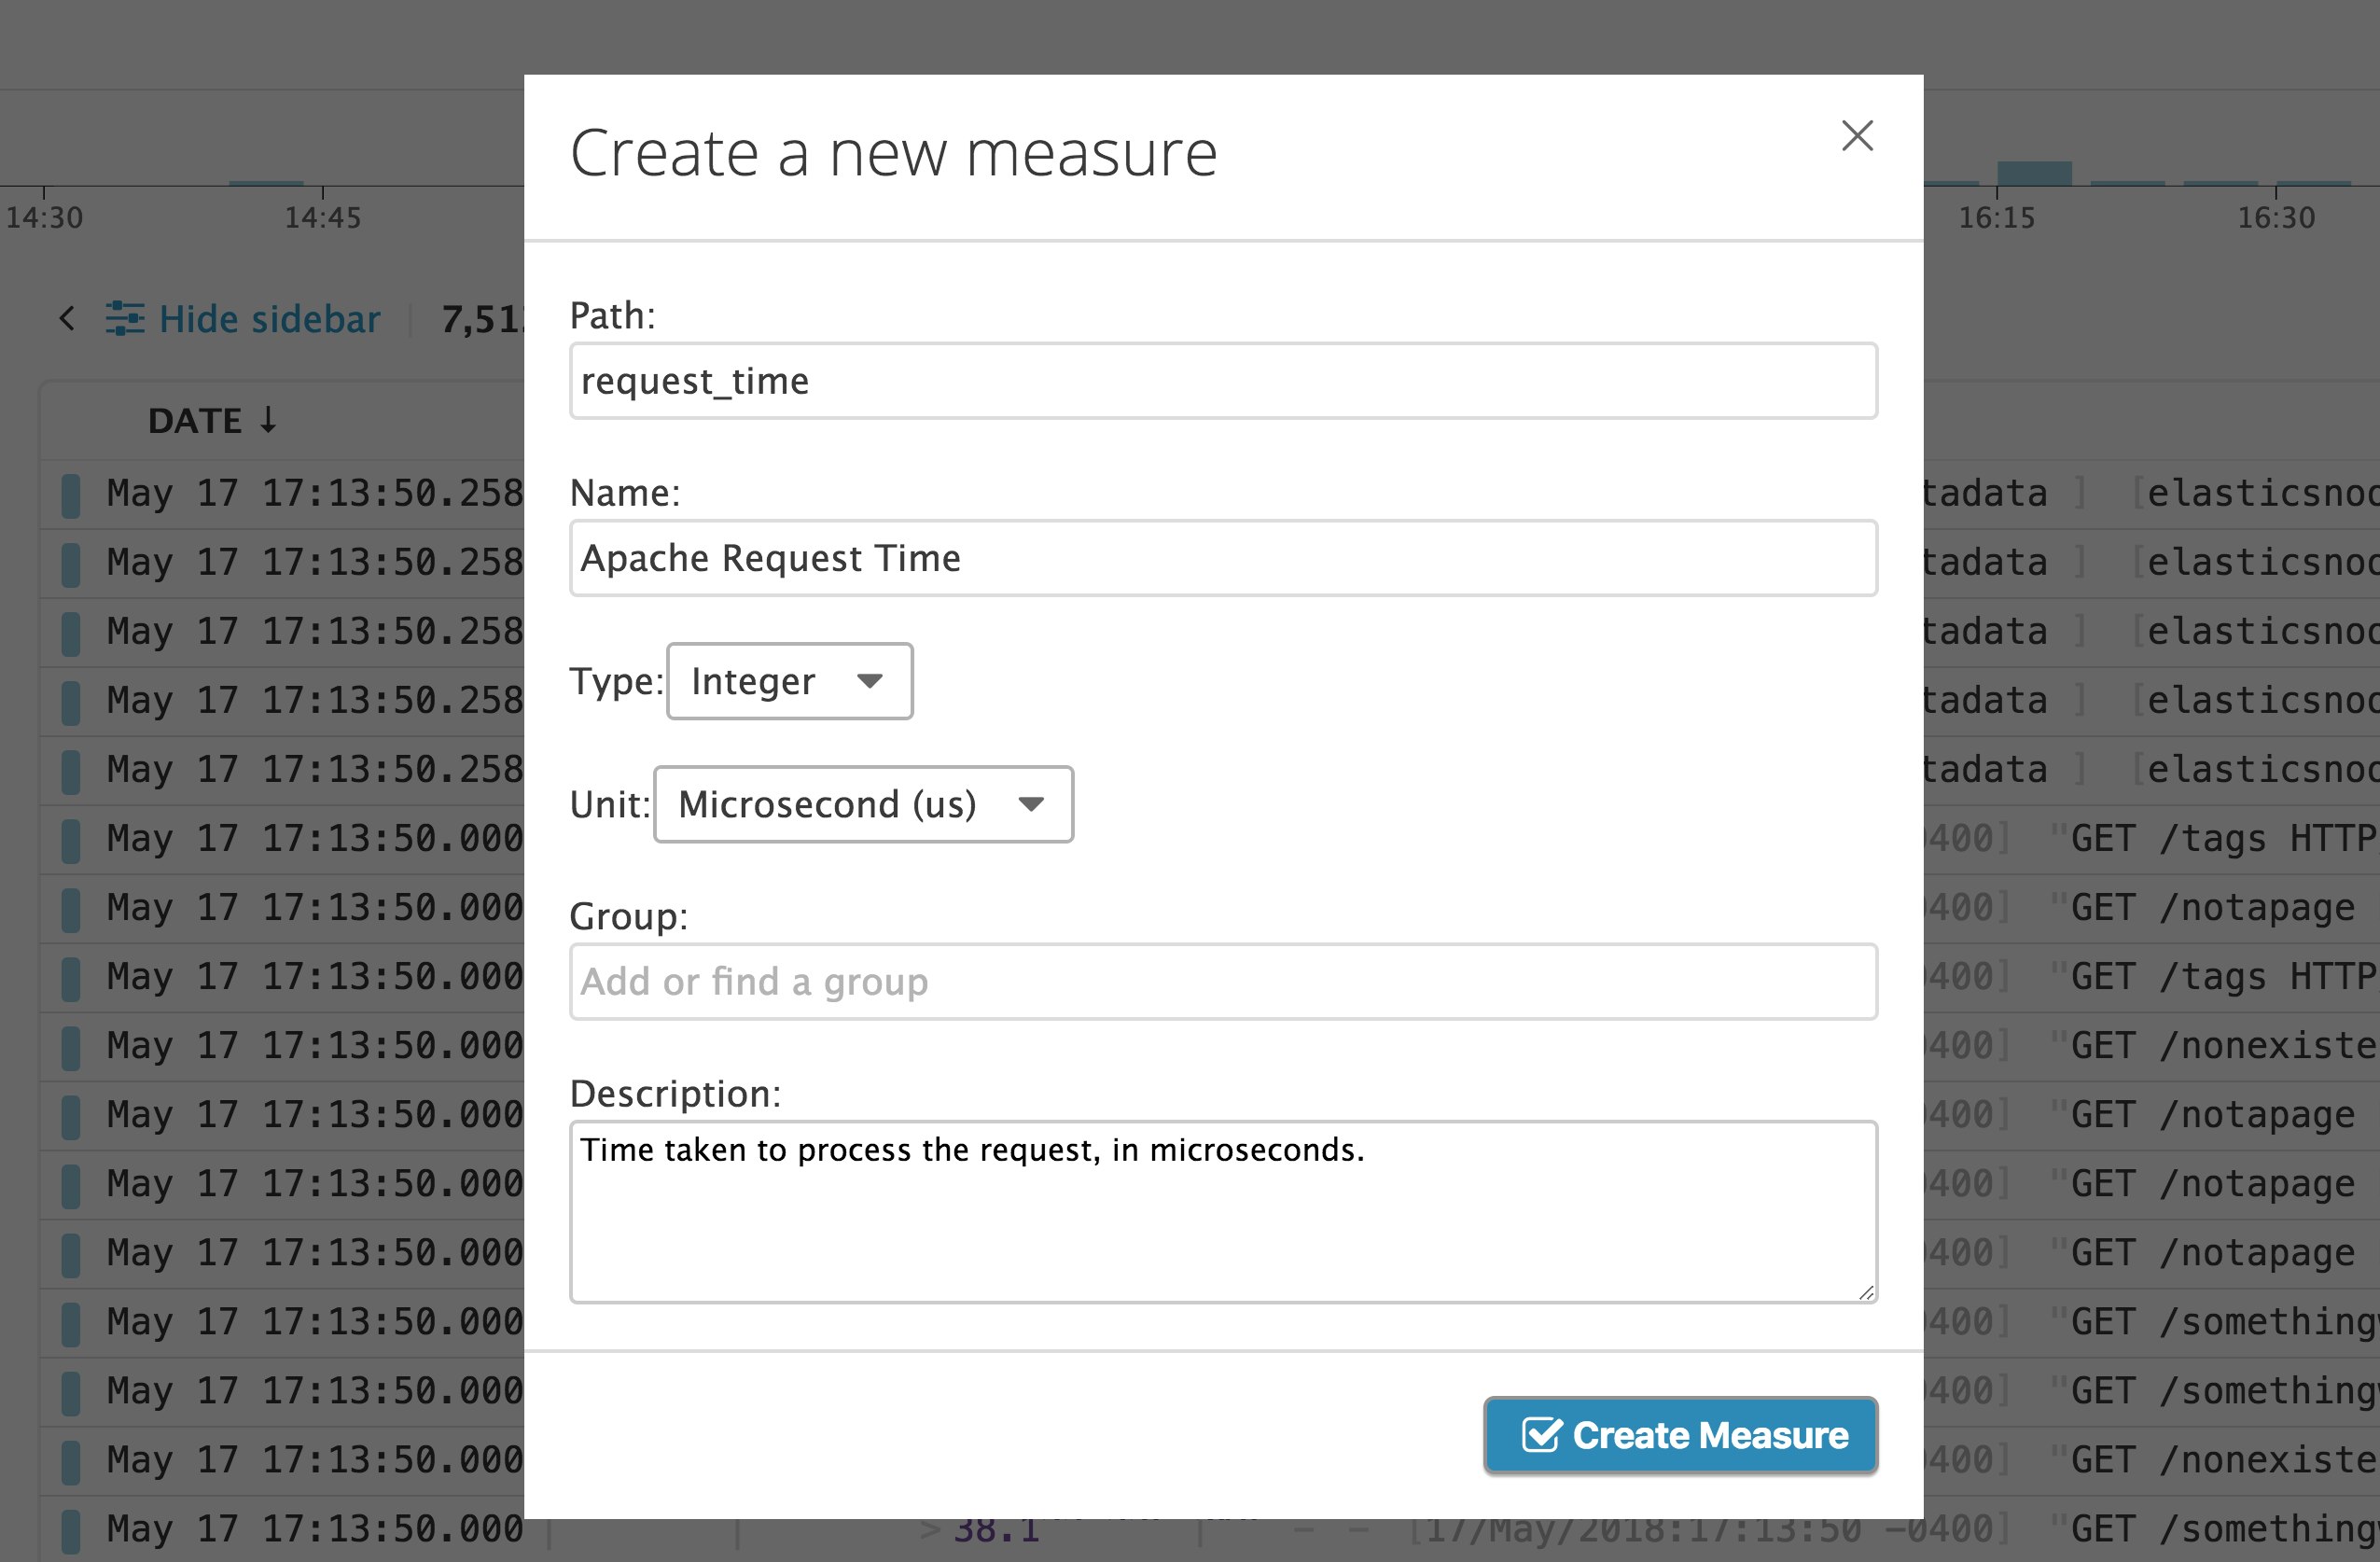
Now we should be able to visualize and alert on our log measure, Apache Request Time, just like any other metric in Datadog.
Visualizing your logs in Datadog
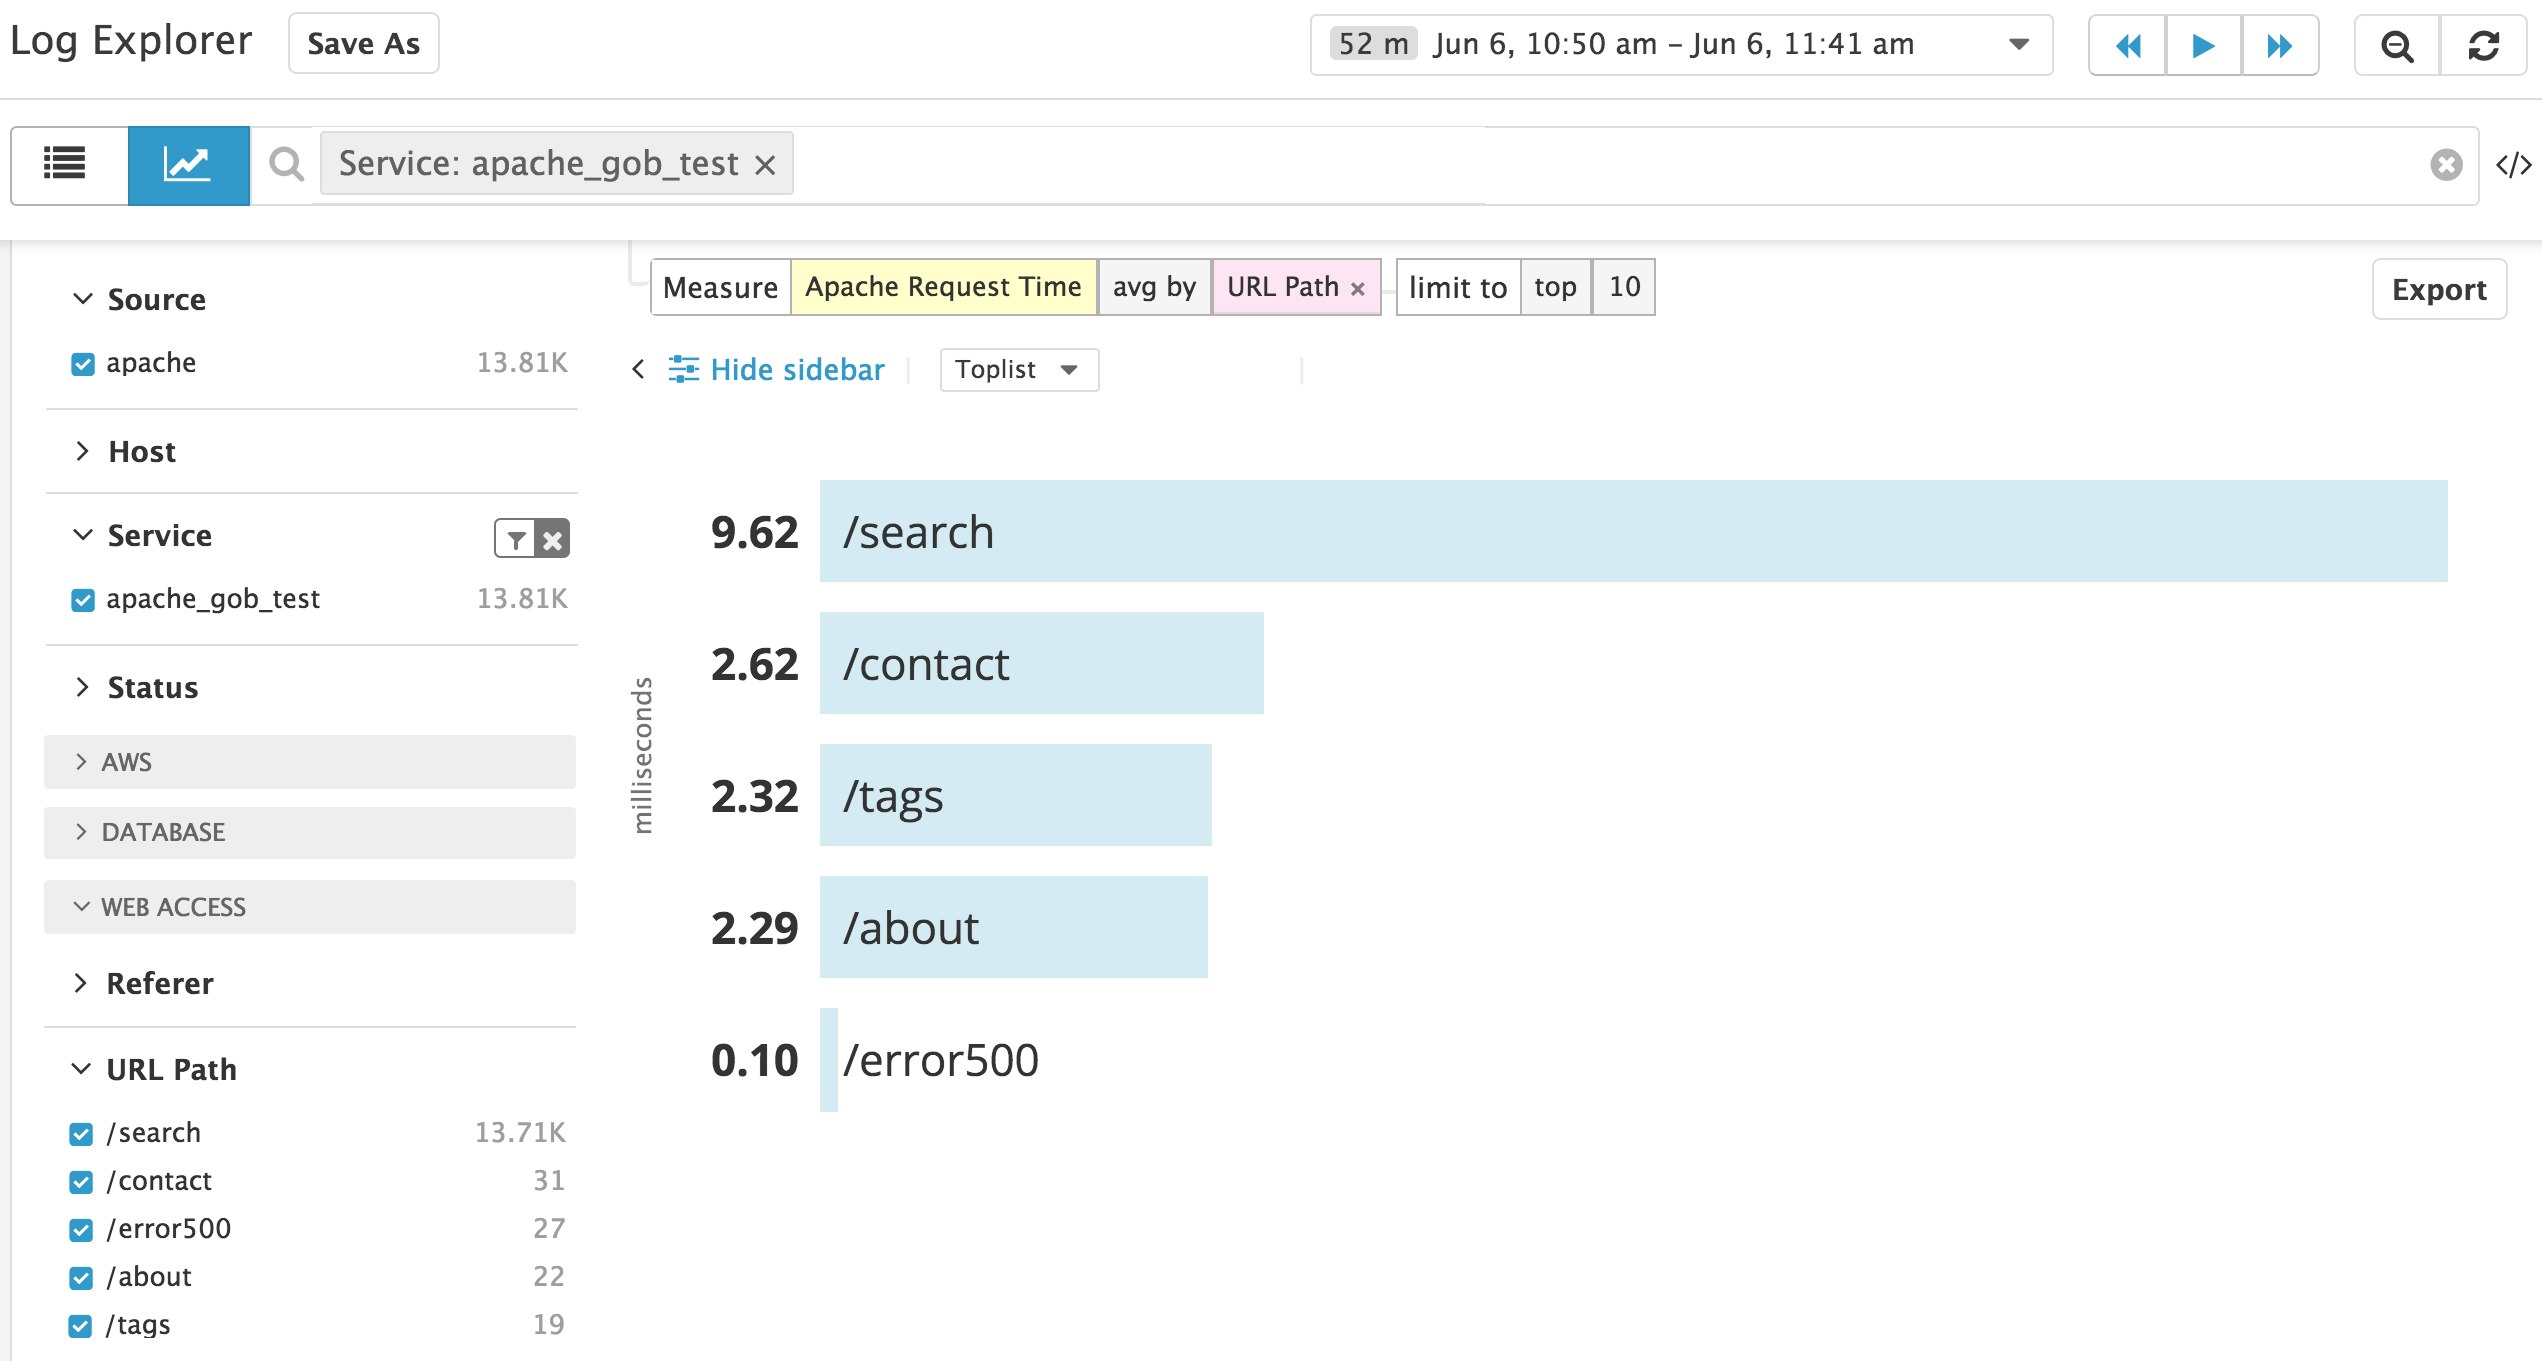
Once your logs are being parsed and processed in Datadog, you can explore and filter all of that log data to derive specific insights from real-time Apache server activity. To create custom views of your log data, you can filter and aggregate by facets like URL path, HTTP response code, and other key information from your access logs. For example, in the Log Explorer's Analytics view, it's easy to visualize which URL paths were associated with the slowest request processing times.
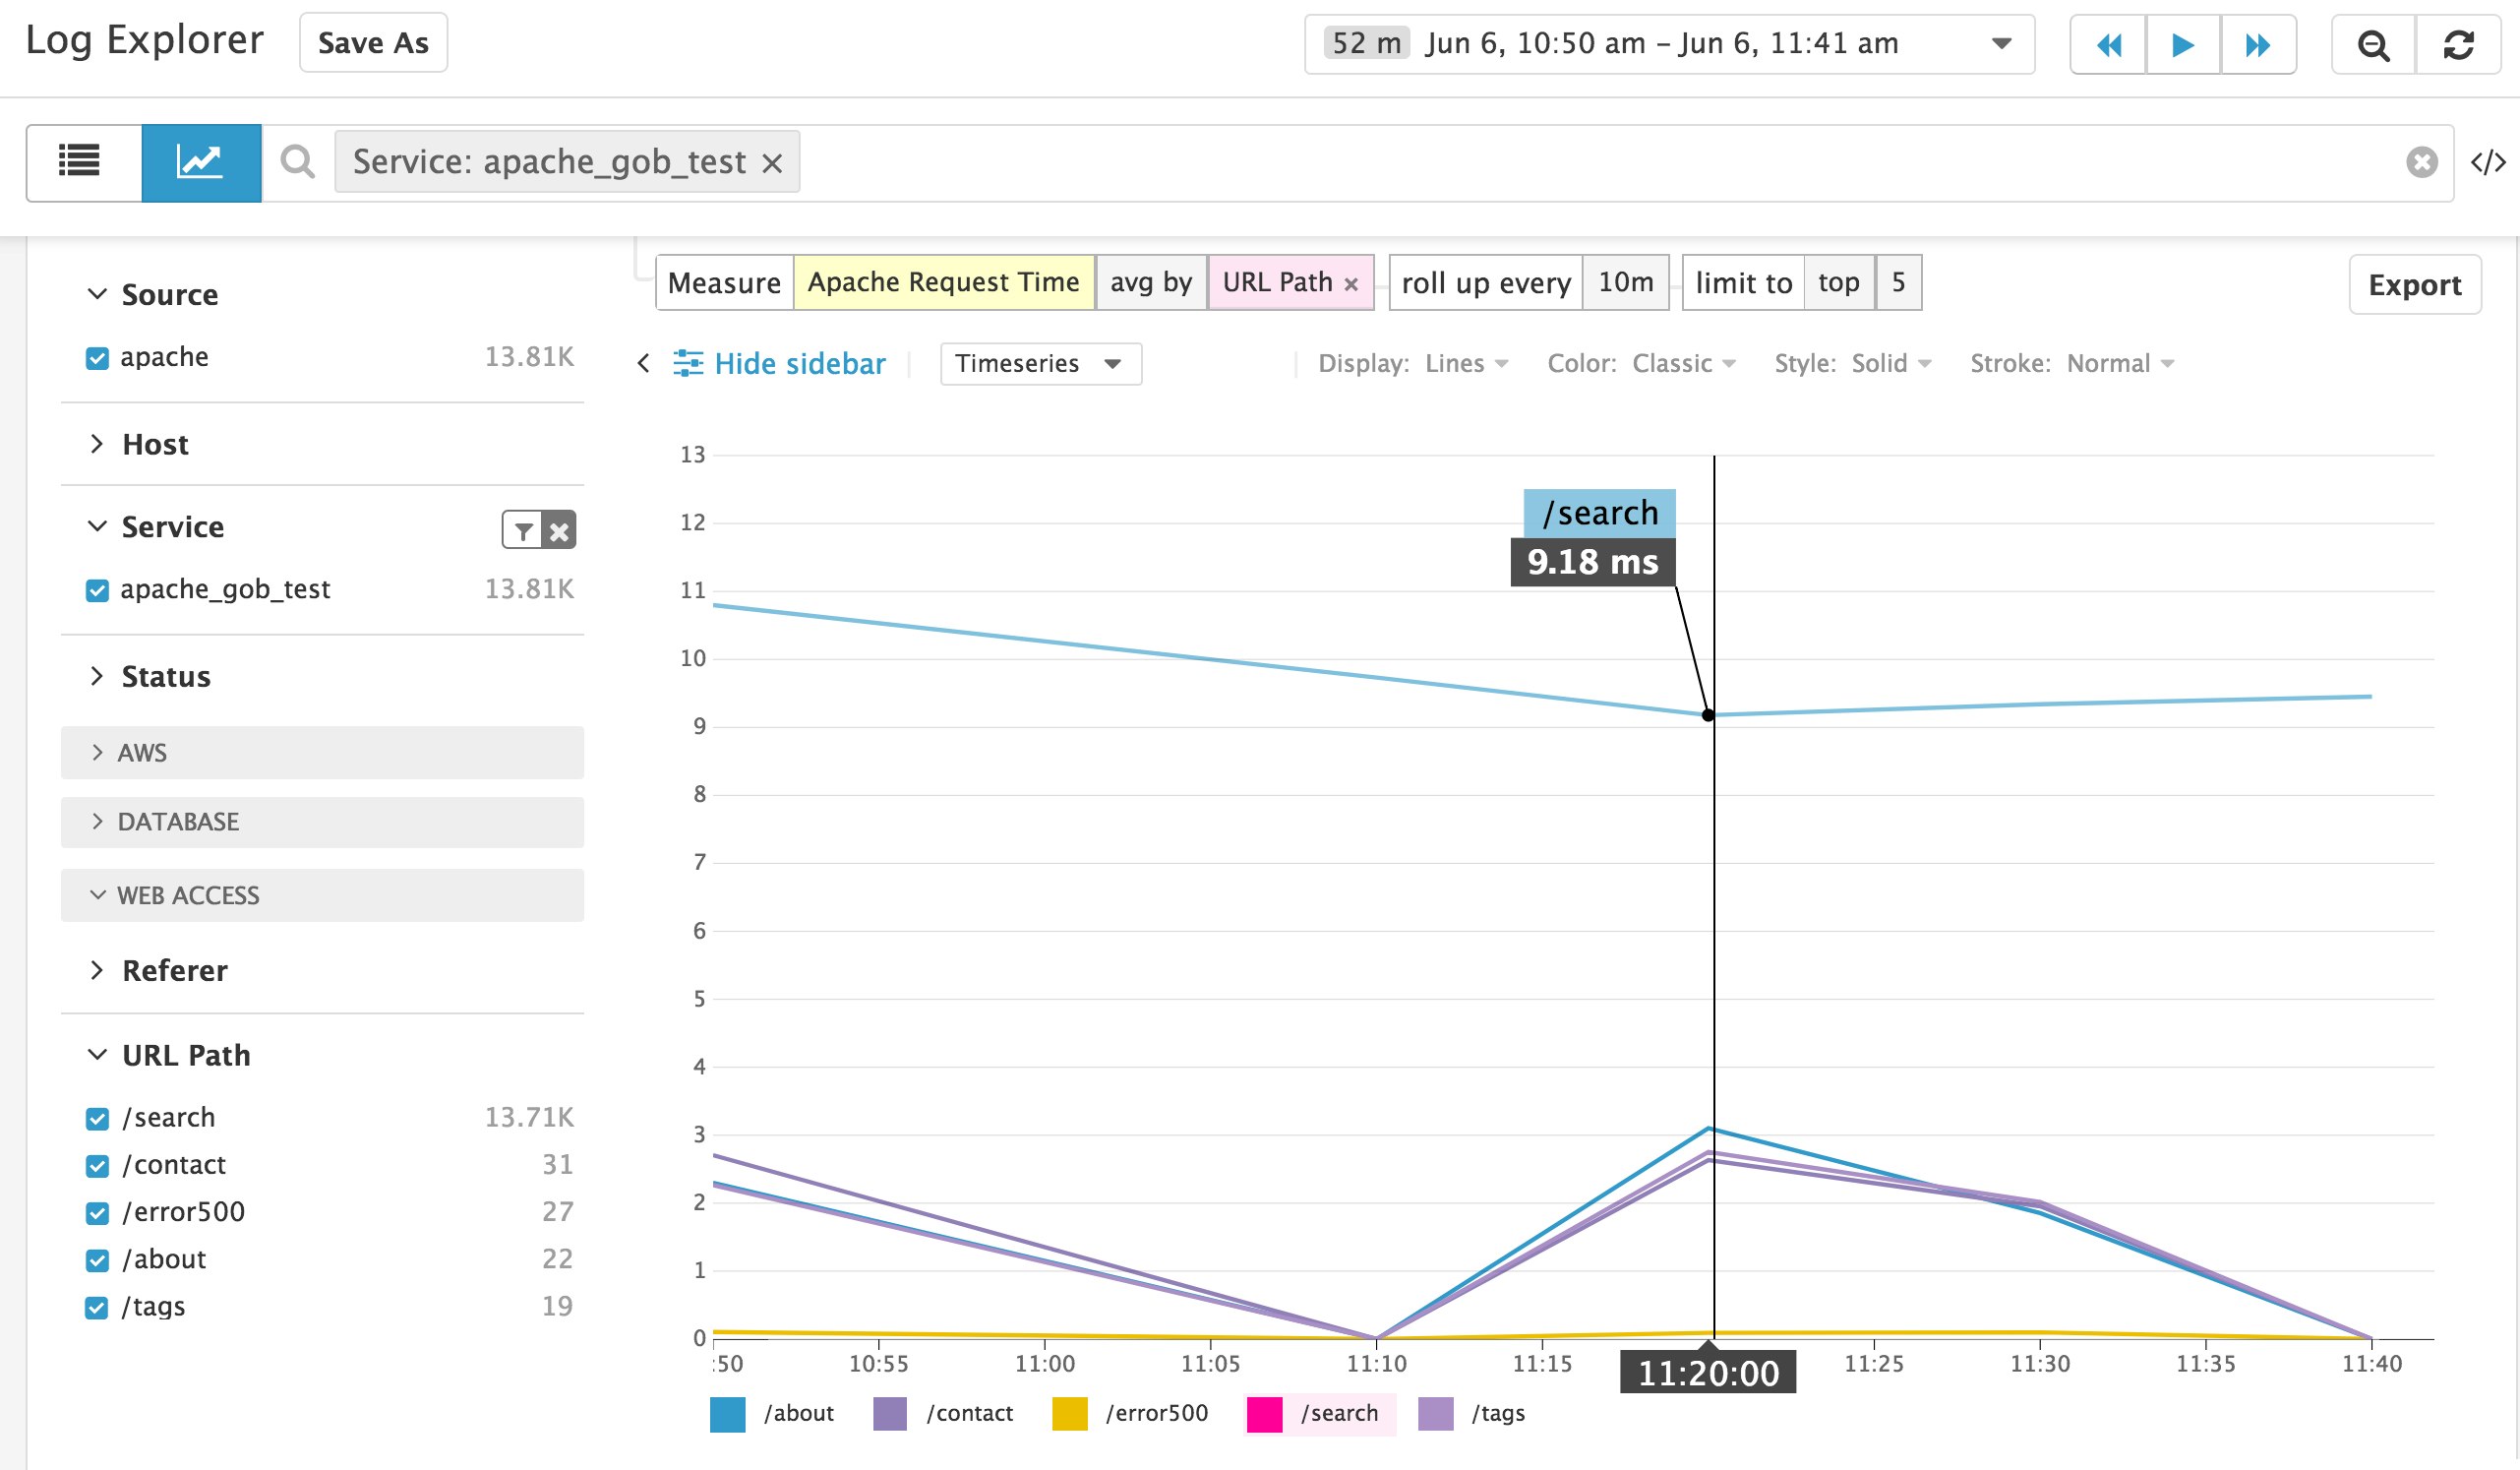
Or you can visualize the same data in a timeseries graph if you'd prefer to analyze trends over a specific period of time. You may also wish to export this graph to a dashboard so that you can correlate it with other metrics across the rest of your infrastructure and applications.
Now that you're collecting metrics from Apache mod_status and your access logs, you can set up alerts to automatically detect issues that affect the health and performance of your Apache servers. In the next section, we will explore several types of alerts that can notify you about potential issues with your Apache servers.
Alerting on Apache issues
Alerts can help notify you when important issues occur on your Apache servers. In this section, we will walk through some examples of setting up Datadog to detect potential issues and notify you based on Apache metrics and logs.
Status check
The Apache integration includes a status check that can help you find out when one or more of your Apache servers is down—ideally before you hear about it from your users.
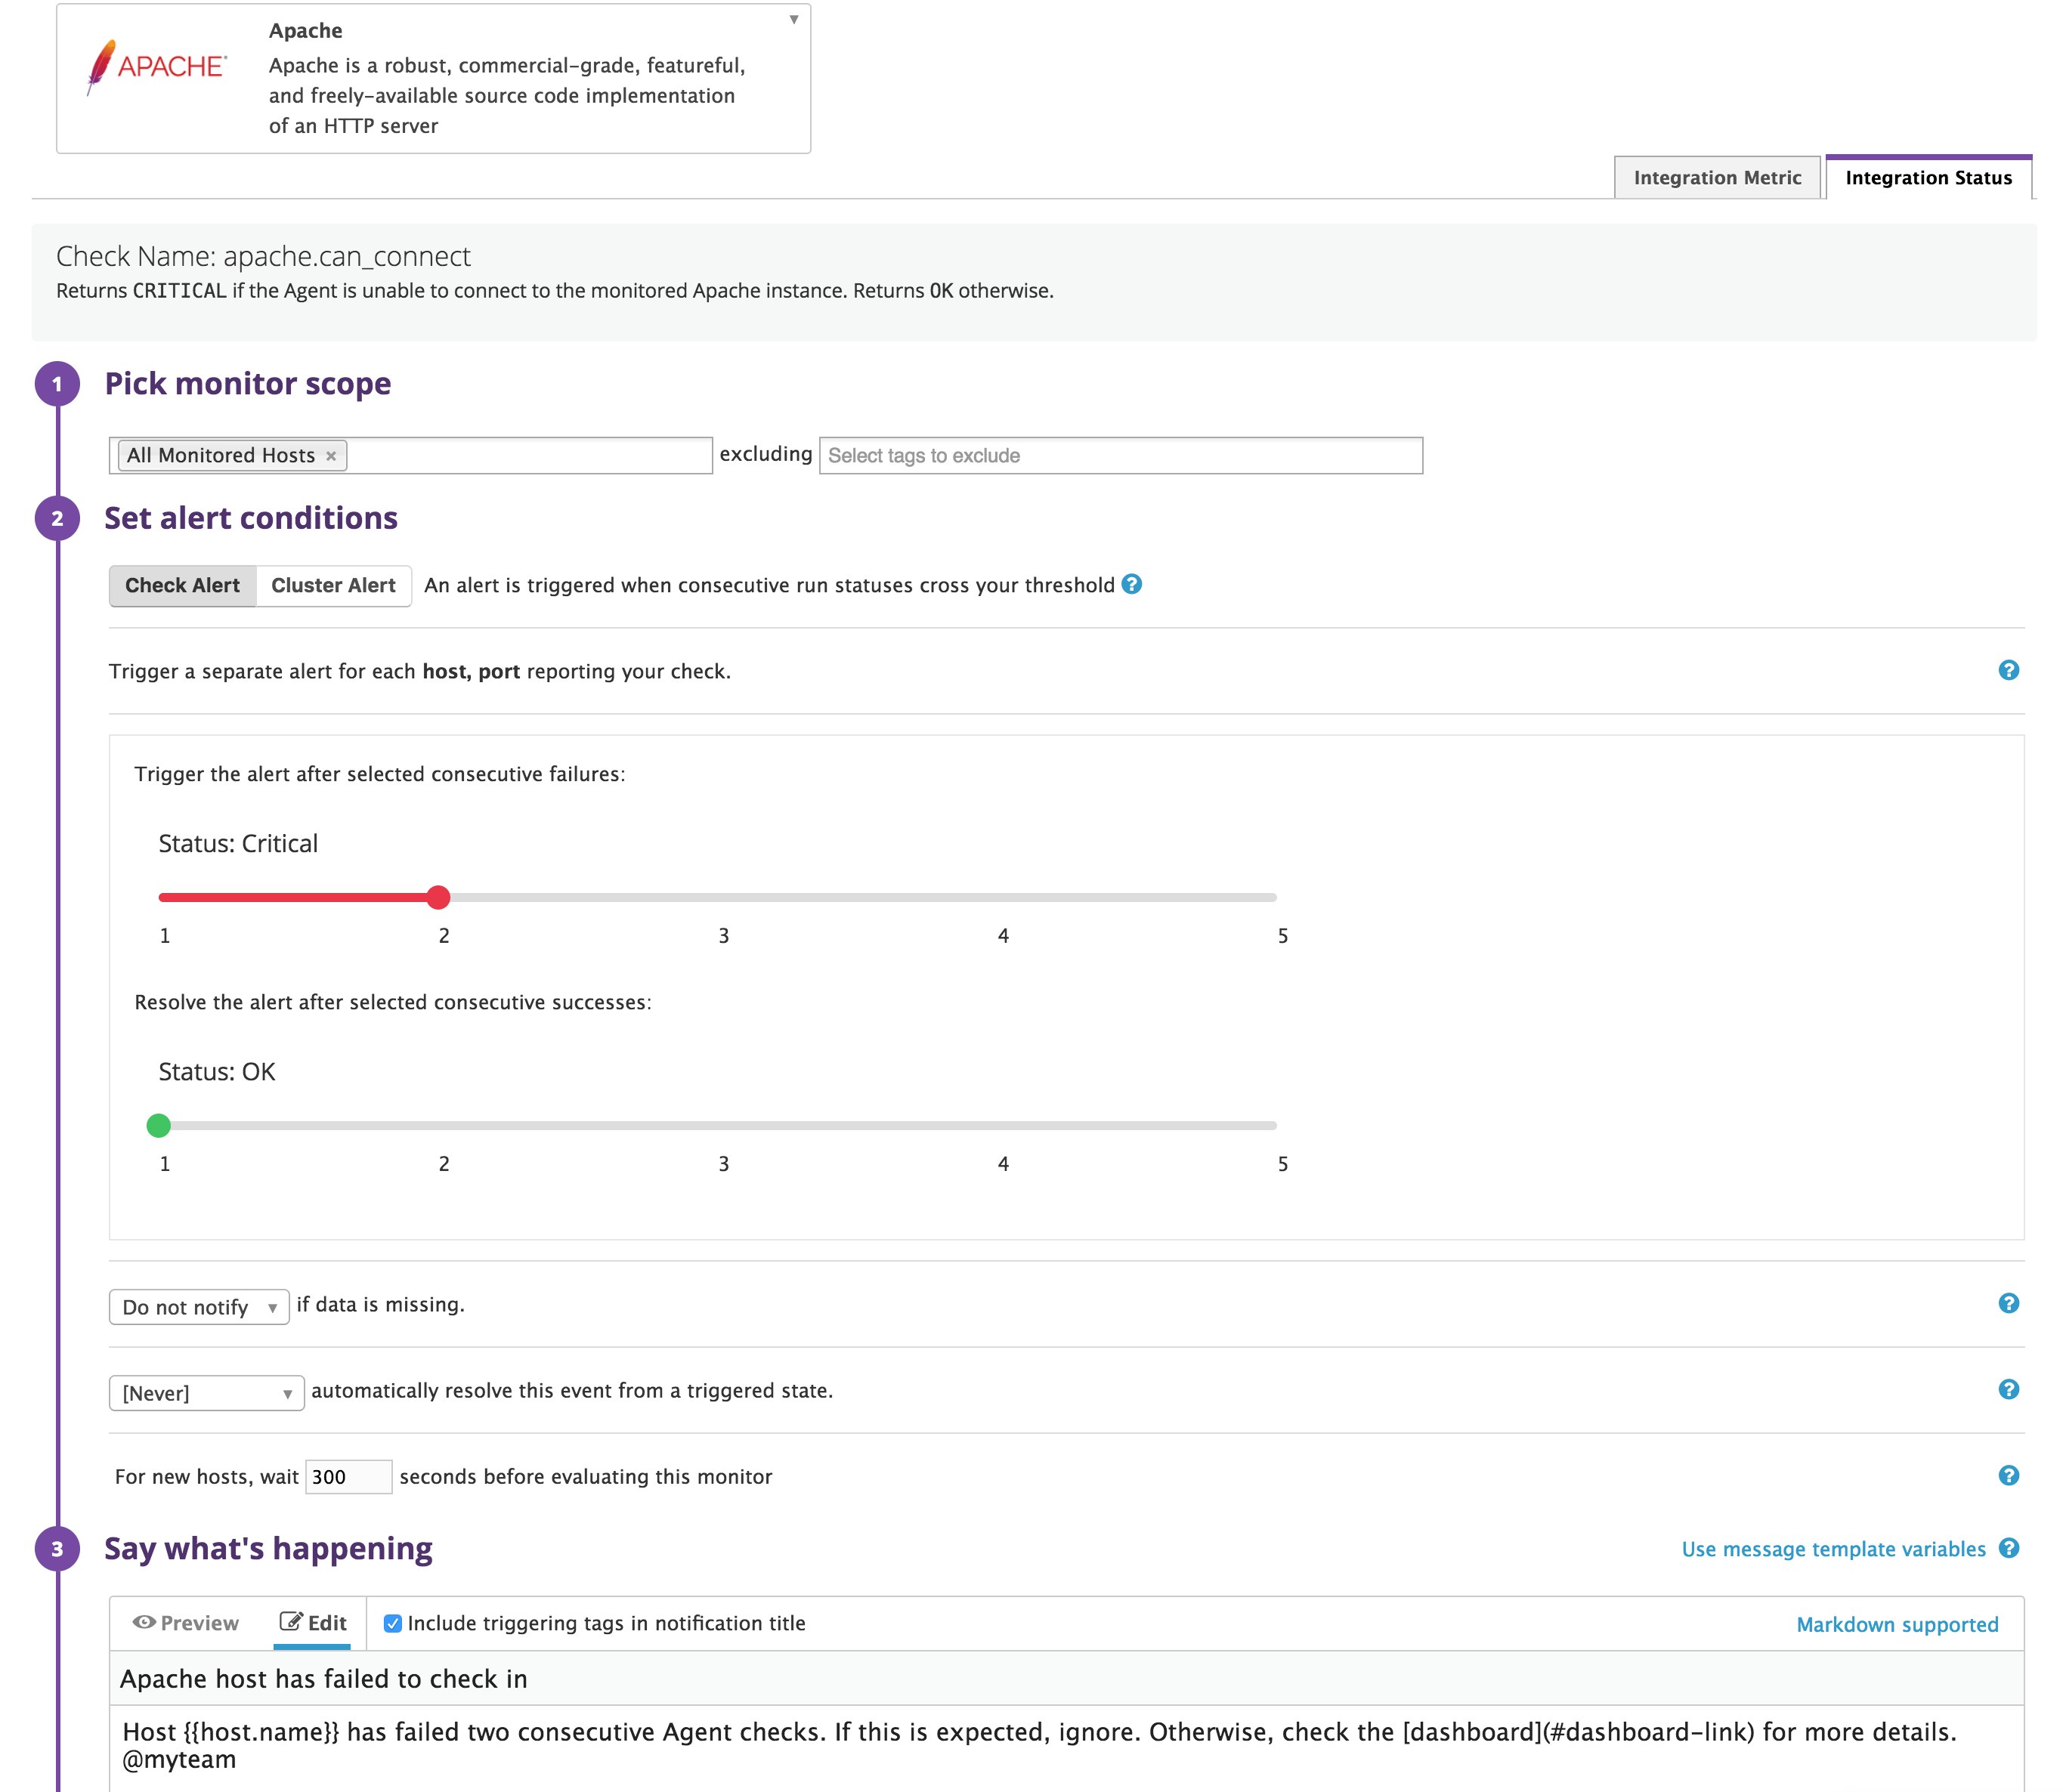
You can set up Datadog to automatically notify you if the Agent fails to connect to one or more of your Apache servers x consecutive times. Setting up an alert is easy; within the Datadog app, navigate to Monitors > New Monitor > Integration. After clicking on the Apache tile, navigate to the "Integration Status" tab.
Below, we set up the alert to notify us each time any particular Apache host fails the check two consecutive times. The alert will resolve on its own once the Agent is able to connect successfully.
Threshold alert
You can also create alerts to get notified when metrics cross fixed or dynamic thresholds. If load testing has shown you that your servers' performance starts to degrade when they process more than a certain number of requests per second, you can set an alert to find out when you're nearing that threshold, as shown below.
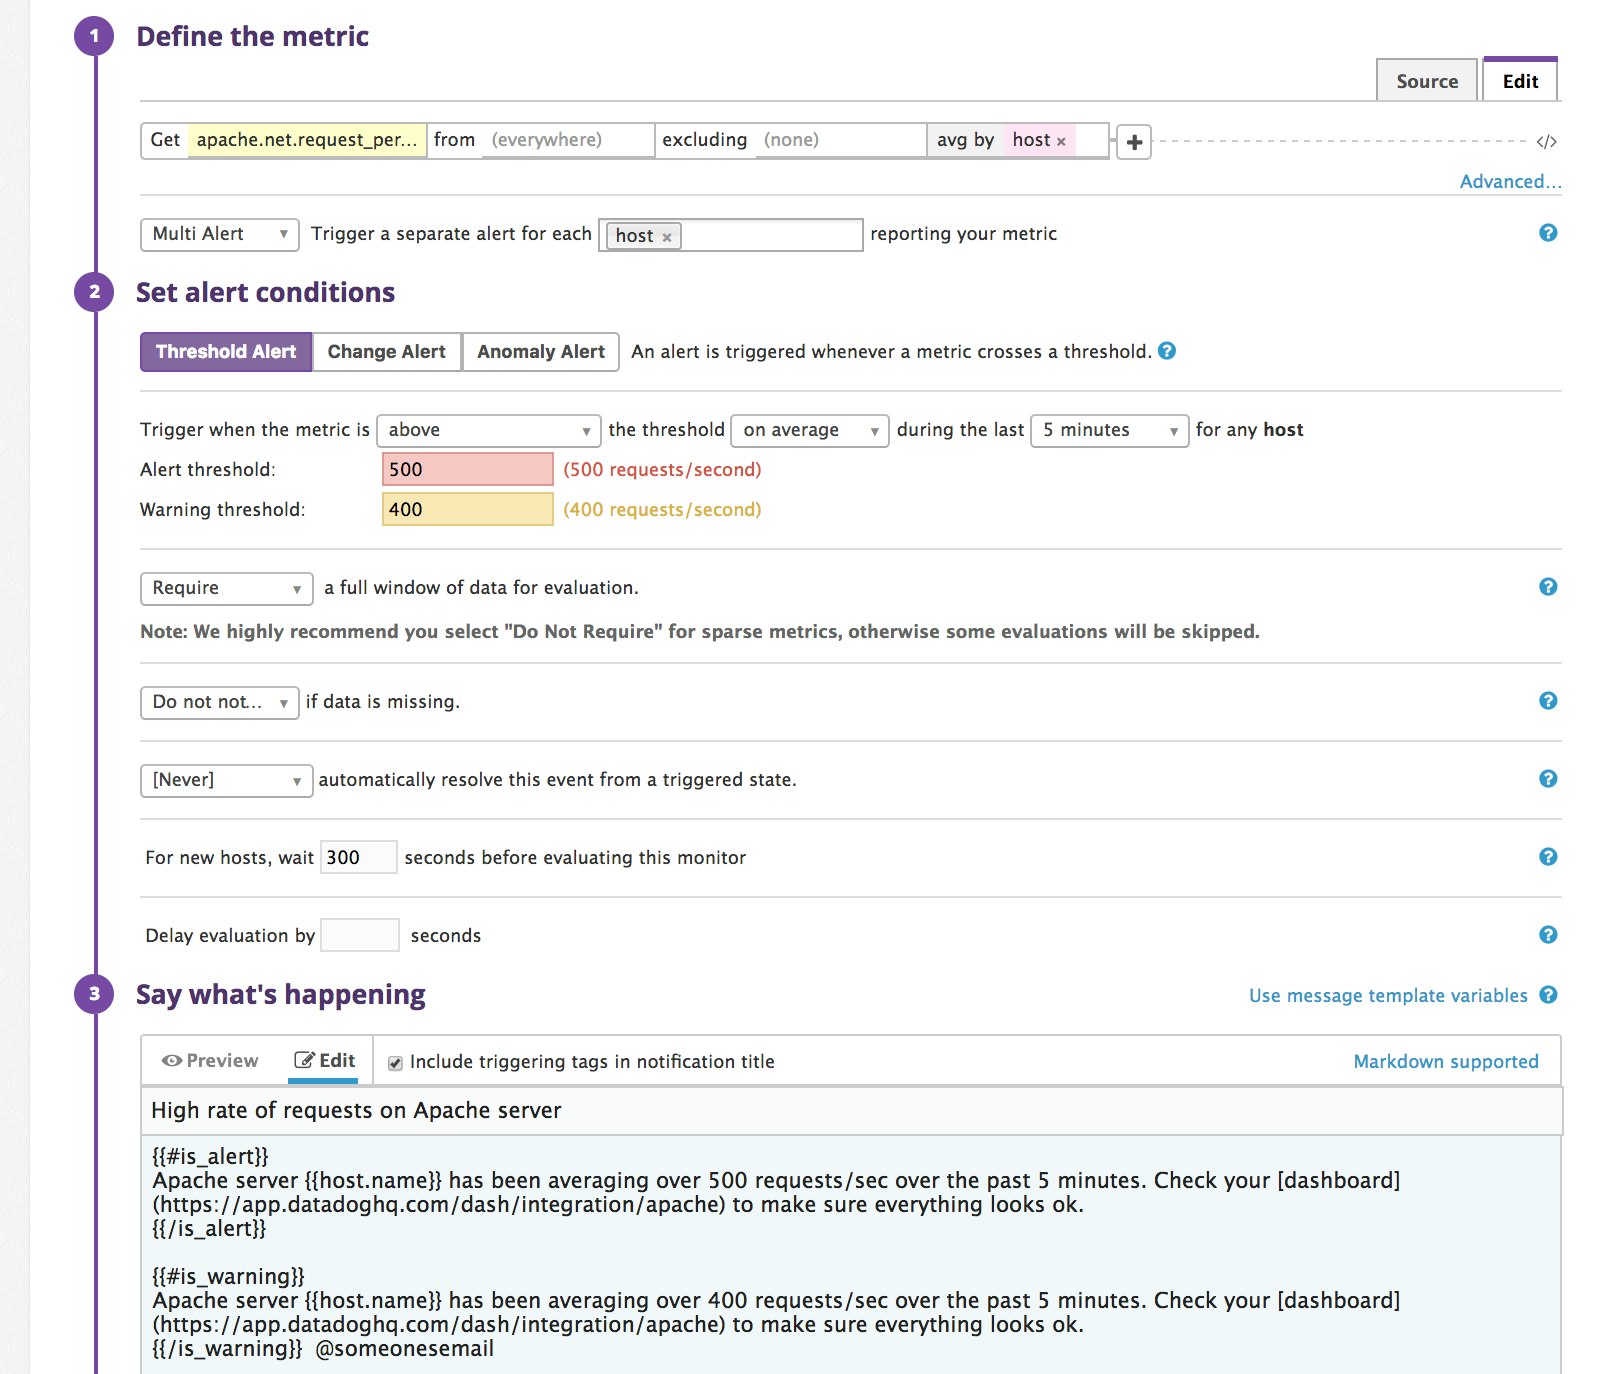
If you get notified that this alert has triggered, you may need to scale up or out to handle the increased load, with some guidance from the Apache documentation's performance tuning tips.
Log alert
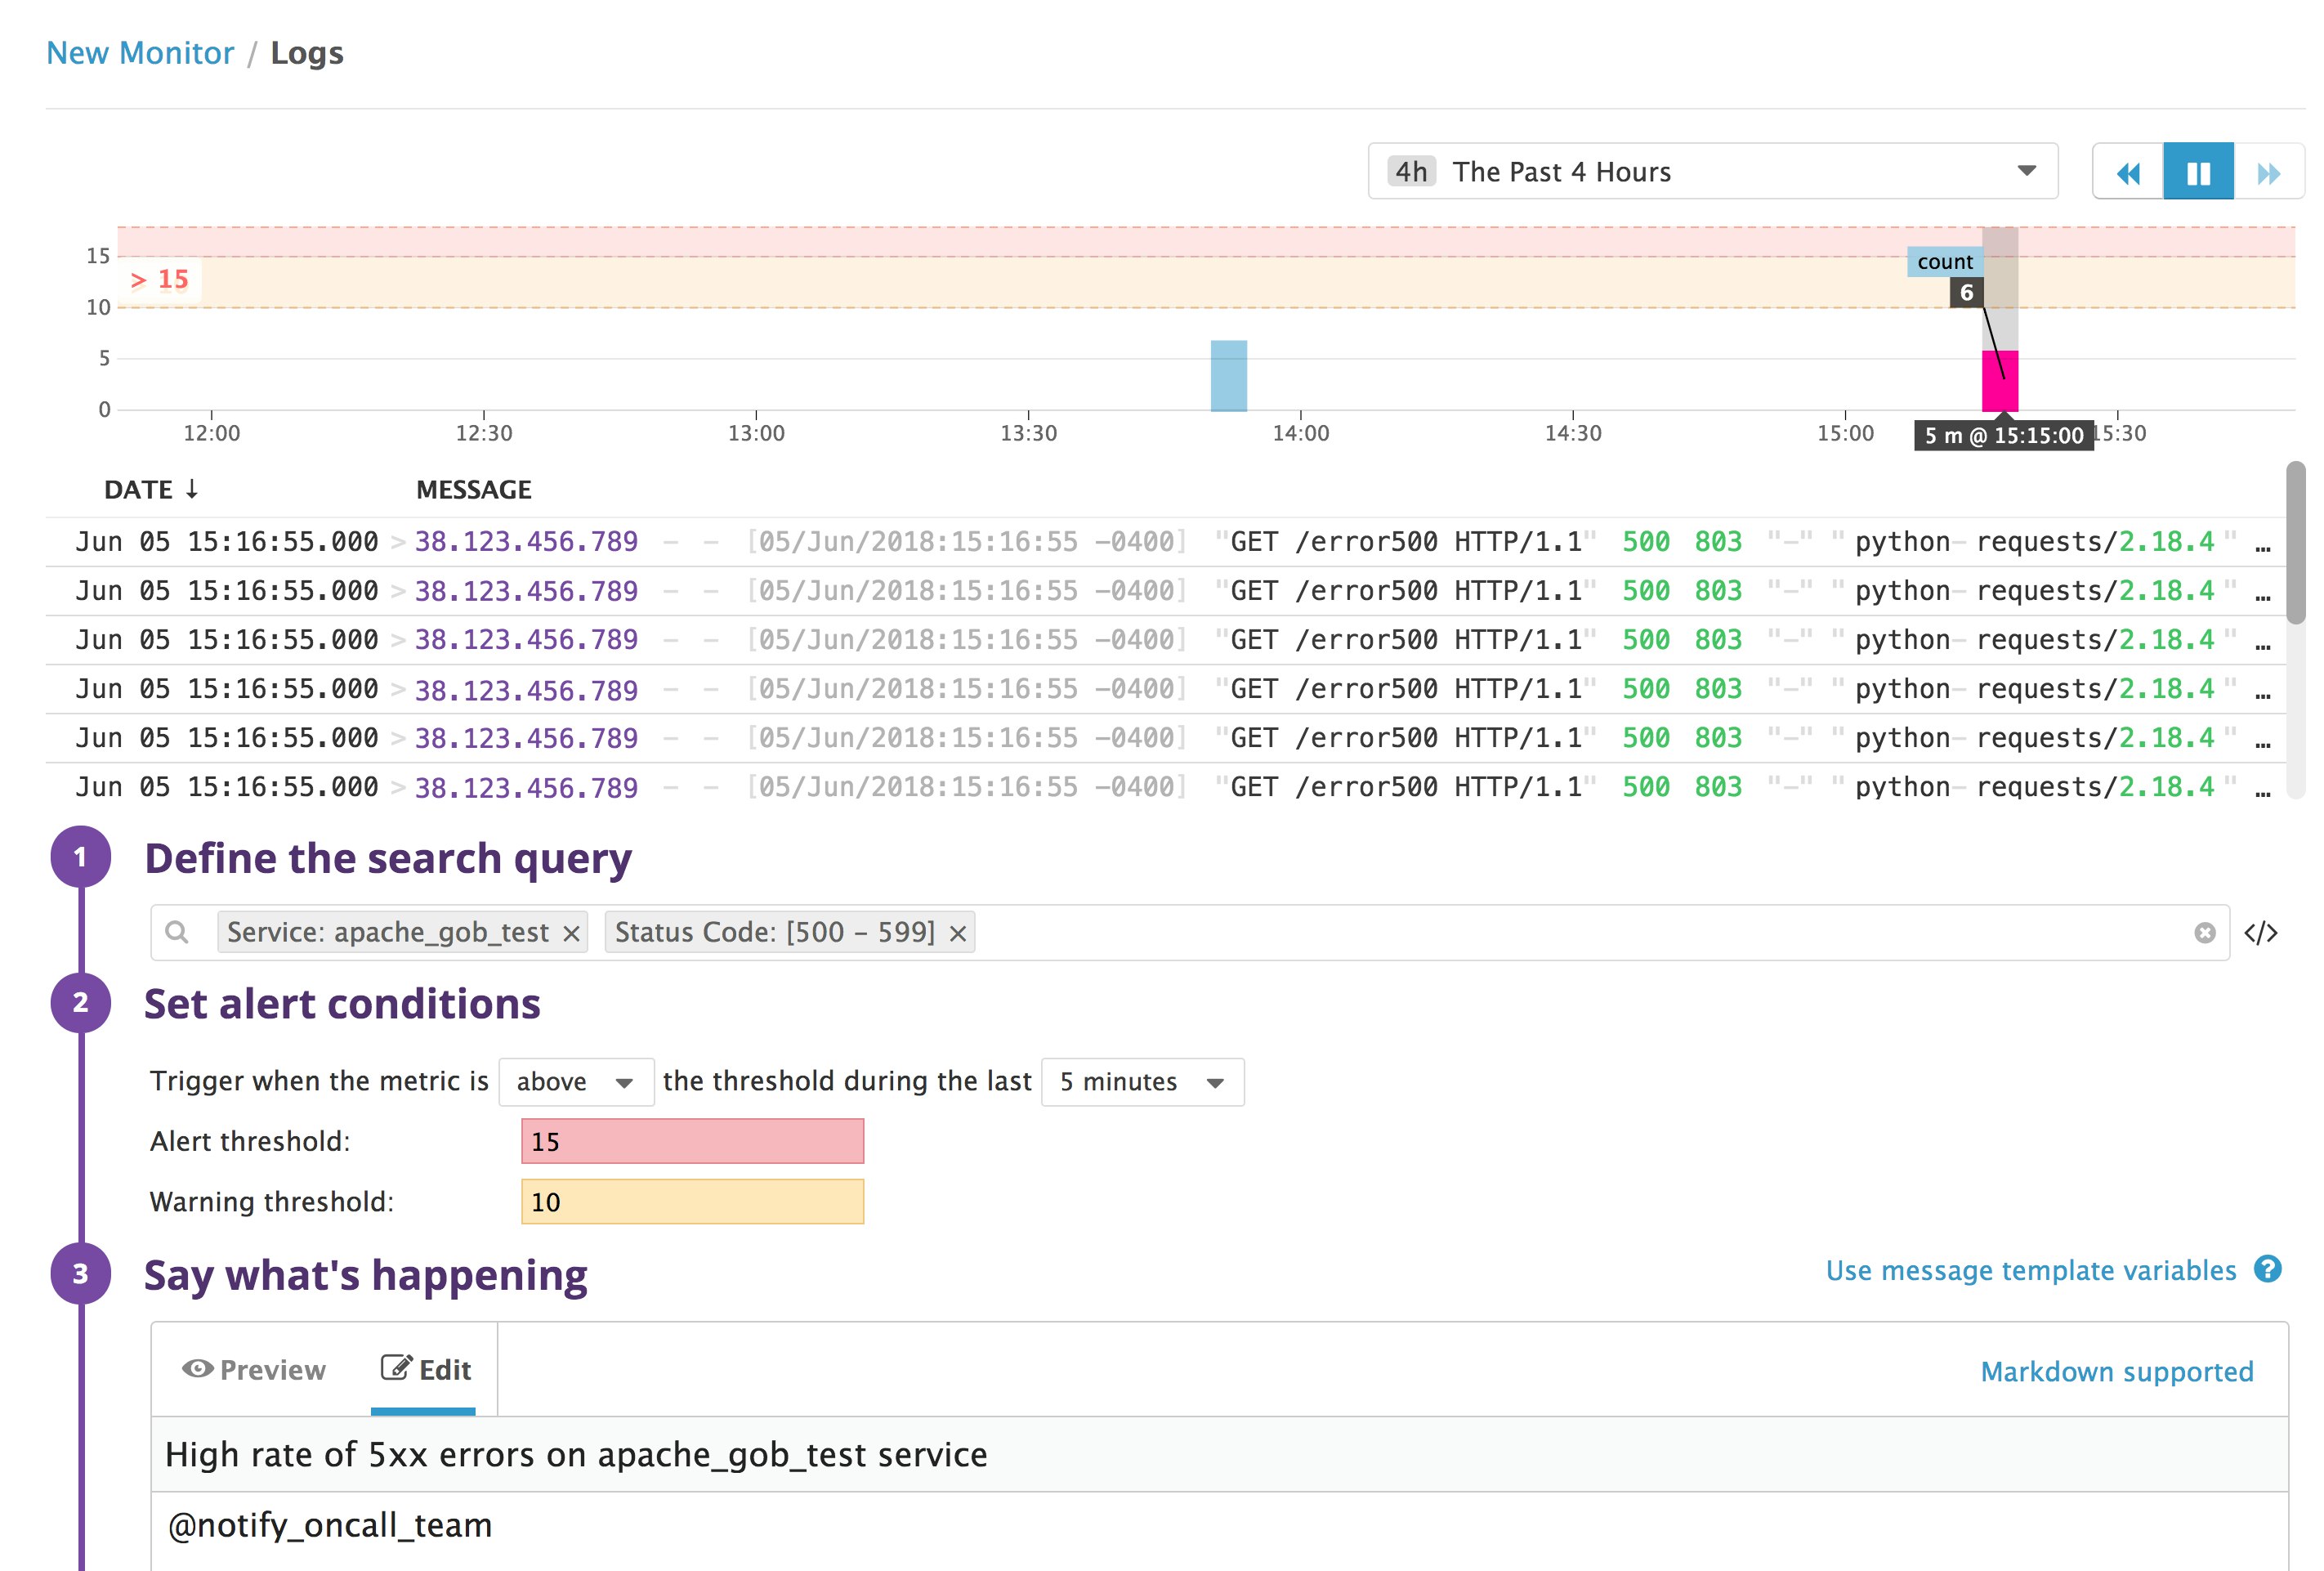
If you set up Datadog to collect and process your Apache logs, you can create a log alert based on specific facets and measures, like HTTP status code or the Apache Request Time measure we created earlier. The example below shows how you can use the Service and Status Code facets to create an alert that notifies you if your Apache service returns a large number of 5xx HTTP responses.
Start the monitoring process
We've shown you a few of the ways you can use Datadog to collect, visualize, and alert on Apache metrics and logs. In just a few minutes you can start capturing Apache metrics and logs, building custom dashboards, and setting up alerts. Because Datadog also integrates with more than 850 other services and tools, you can quickly create a comprehensive view of your servers along with all the other components of your stack.
If you don't yet have a Datadog account, start monitoring Apache today with a free trial.


