Addie Beach

Shri Subramanian
At Datadog, we’re constantly developing new integrations to give you complete, end-to-end visibility into your entire system. Here are just a few of our latest releases:
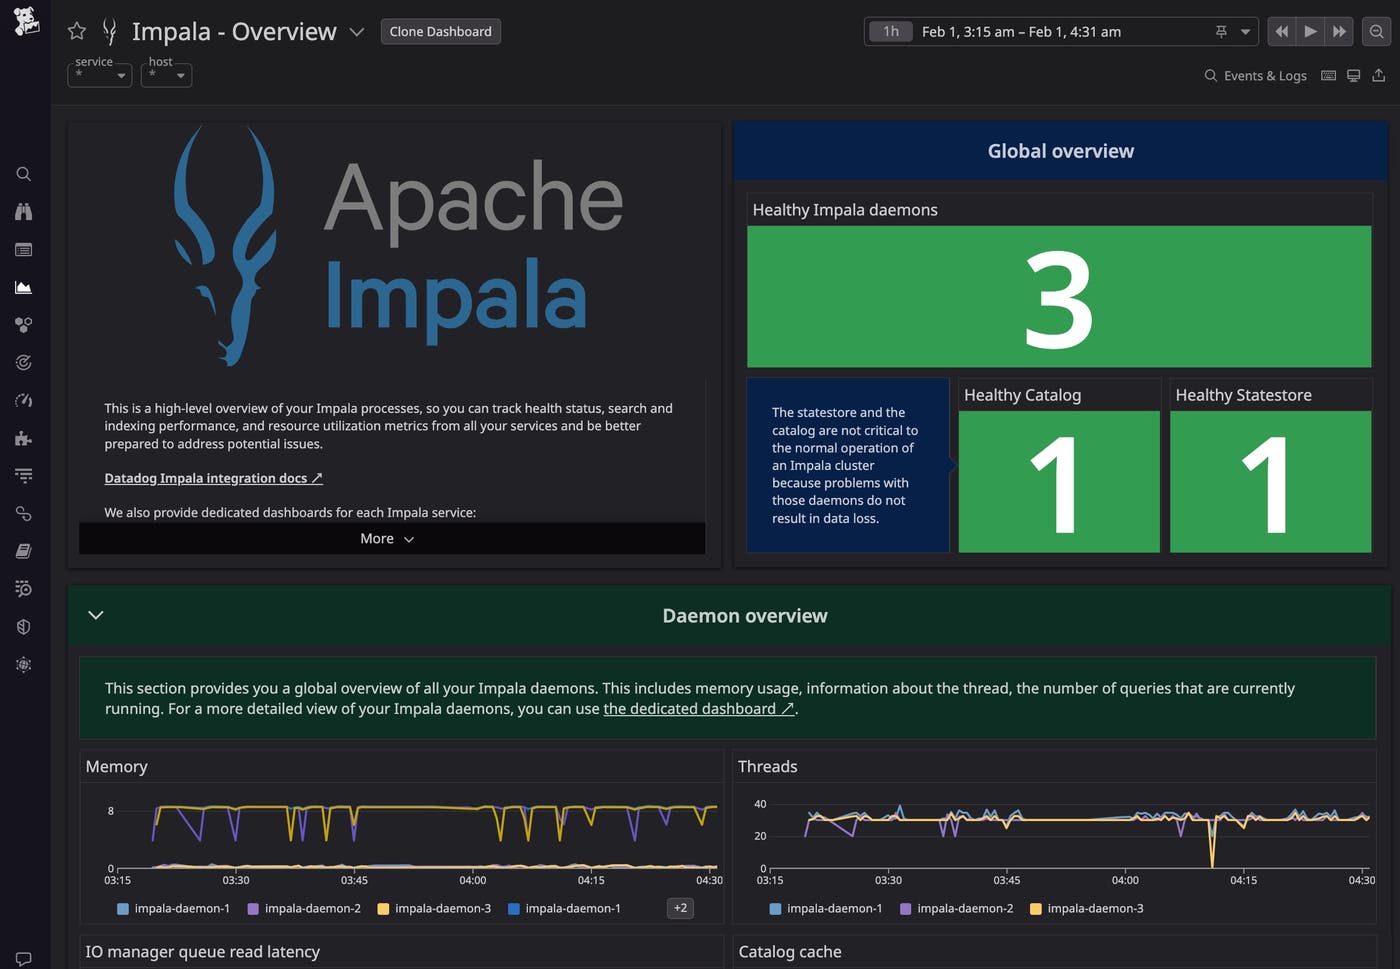
- A new Apache Impala integration with out-of-the-box (OOTB) dashboards that help you monitor key components of your Impala clusters
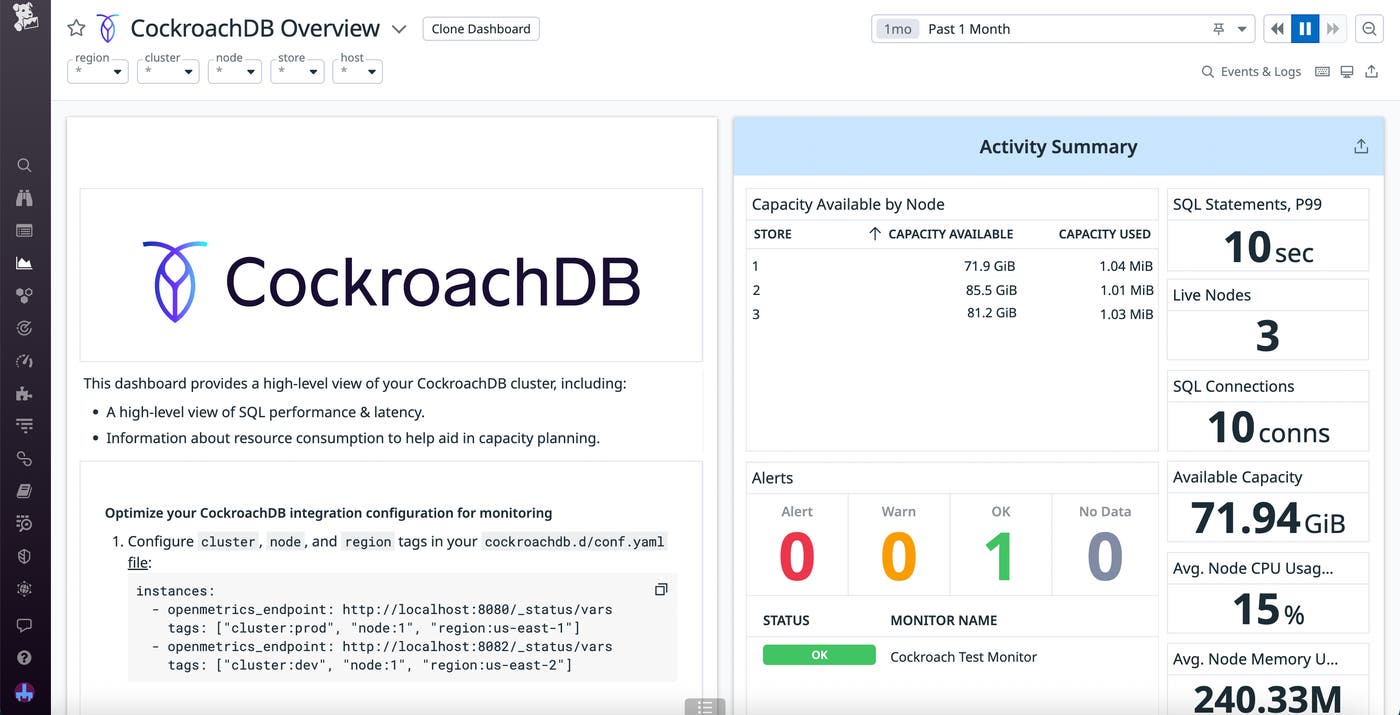
- Updates to our CockroachDB integration, including additional metrics for measuring backup health and meaningful query latency
- Autodiscovery for our SonarQube integration, which enables you to quickly start gathering metrics from your projects with minimal setup
Investigate slow queries using Apache Impala dashboards
Apache Impala is an open source SQL engine that provides low-latency querying for Apache Hadoop. Because it combines fast data processing with the resiliency and reliability of the Hadoop Distributed File System (HDFS), Impala enables you to quickly create robust, business-critical reports. This makes it essential to monitor the health of your Impala instances—if Impala fails, it can easily cause important dashboards and reports to fail as well.
With our Apache Impala integration, you can access a collection of OOTB dashboards that enable you to monitor usage and performance for your Impala clusters. Key metrics for service health, search and indexing performance, and resource utilization are organized into an overview dashboard (shown below), helping you troubleshoot slow or failed queries. When you want to perform deeper investigations, you can also access dashboards tailored to critical Impala components, including the Impala daemon, Catalog Service, and StateStore. These component dashboards enable you to assess resource utilization via thread and memory metrics, as well as analyze query execution profiles by viewing data from server connection, I/O manager, and cache events.

All of these dashboards come with logs for your Impala clusters, broken down by attributes such as host and service. Additionally, Datadog Log Pipelines parses, enriches, and extracts data from these logs, so you can analyze them for further troubleshooting. For example, if you notice a spike in error logs on the Impala daemon dashboard, you can pivot to Log Pipelines to investigate common patterns.
You can leverage all of these features alongside a variety of integrations designed to support your Hadoop ecosystem. Datadog’s HDFS, MapReduce, Yarn, Hive, and Zookeeper integrations give you visibility into your Hadoop clusters and related Apache services. You can also use our Cloudera integration to effectively manage your Hadoop instances.
Analyze CockroachDB metrics to assess cluster health
Our CockroachDB integration already enables you to monitor your CockroachDB clusters via hundreds of metrics, with key latency, workload, and resource usage data organized into an OOTB dashboard. To give you even more insight into cluster health, we’re introducing three additional metrics to the integration:
jobs.backup.currently_idle: This metric provides counts of backup jobs, sorted by job type. CockroachDB enables you to schedule periodic database backups for disaster recovery. Anomalies in backup job counts often indicate potential bottlenecks that could affect the creation of these copies and can mean that you need to inspect your backup job schedules.changefeedfailures: This metric measures event admission latencies. The CockroachDB admission control system prioritizes your request and response operations to manage resource allocation and ensure high performance for essential processes. You can monitor admission latency to check that your clusters are able to effectively organize work queues and avoid node overloads or failures.admission.wait.durations.sql_sql.response: This metric displays wait times for various types of requests. Measuring the wait times for your requests can help you spot queries that are experiencing degraded performance. When combined with event admission metrics, this data enables you to pinpoint higher priority queries that could be experiencing latency.
In addition to these metrics, we’re releasing an updated version of our OOTB CockroachDB dashboard with visualizations for monitoring node performance, resource allocation, and query frequency. You can use these insights to identify areas for query or cluster optimization, helping you reduce latency across your nodes. The dashboard also enables you to quickly locate the source of database issues for fast troubleshooting.

Streamline your code analysis with SonarQube autodiscovery
Datadog makes it easy to monitor your code quality with our SonarQube integration—you can access critical metrics and alerts to quickly find issues in your code, as well as leverage logs that give you insight into the health of your SonarQube servers. The SonarQube integration now comes with Autodiscovery, streamlining your integration setup and enabling you to start analyzing your code immediately. Autodiscovery automatically detects services running on your hosts and configures the integration appropriately, meaning you don’t need to manually set up instances for each project that you want to collect data from.
The SonarQube integration gathers metrics from two endpoints: one that reports code check results and another that collects data about the health of the SonarQube server itself. This functionality enables you to easily create alerts that notify you both about issues in your code and issues among the SonarQube servers themselves. With Autodiscovery, you can easily collect metrics from both endpoints across every SonarQube-monitored project.
Get started with Datadog integrations
Datadog provides more than 1,000 integrations to help you monitor your entire application, from your hosts and containers all the way to your end-user sessions.
You can use our documentation to try out the Apache Impala, CockroachDB, and SonarQube integrations today. Or, if you’re not yet a Datadog user, you can sign up for a 14-day free trial.


