Jean-Mathieu Saponaro
When you are managing a large number of servers, a good infrastructure automation tool can make your life much easier. But once you have automated your provisioning, deployment and configuration management, you want some insights into how it’s all working: Did the tasks you applied to your infrastructure succeed? Are your provisioning and deployment steps efficient?
To answer these questions and more, today we are happy to introduce a new integration with Ansible, which joins our other automation integrations: Chef and Puppet.

What Ansible does
In an IT automation market where Chef and Puppet have become standards, Ansible has managed to make a name for itself, focusing at first on OpenStack and later integrating with other cloud infrastructure providers like AWS and Google Cloud Platform. Unlike other automation tools, Ansible uses a single controlling machine which orchestrates and manages the other nodes over SSH. This structure makes it easy to understand and use.
Recently acquired by Red Hat, Ansible can be used to dynamically provision your cloud infrastructure, to deploy and orchestrate your applications, to manage configurations, and for ad hoc tasks.
Ansible customers include Twitter, Evernote, Electronic Arts, Atlassian, Cisco, Hootsuite, and Juniper.
Monitor your automation
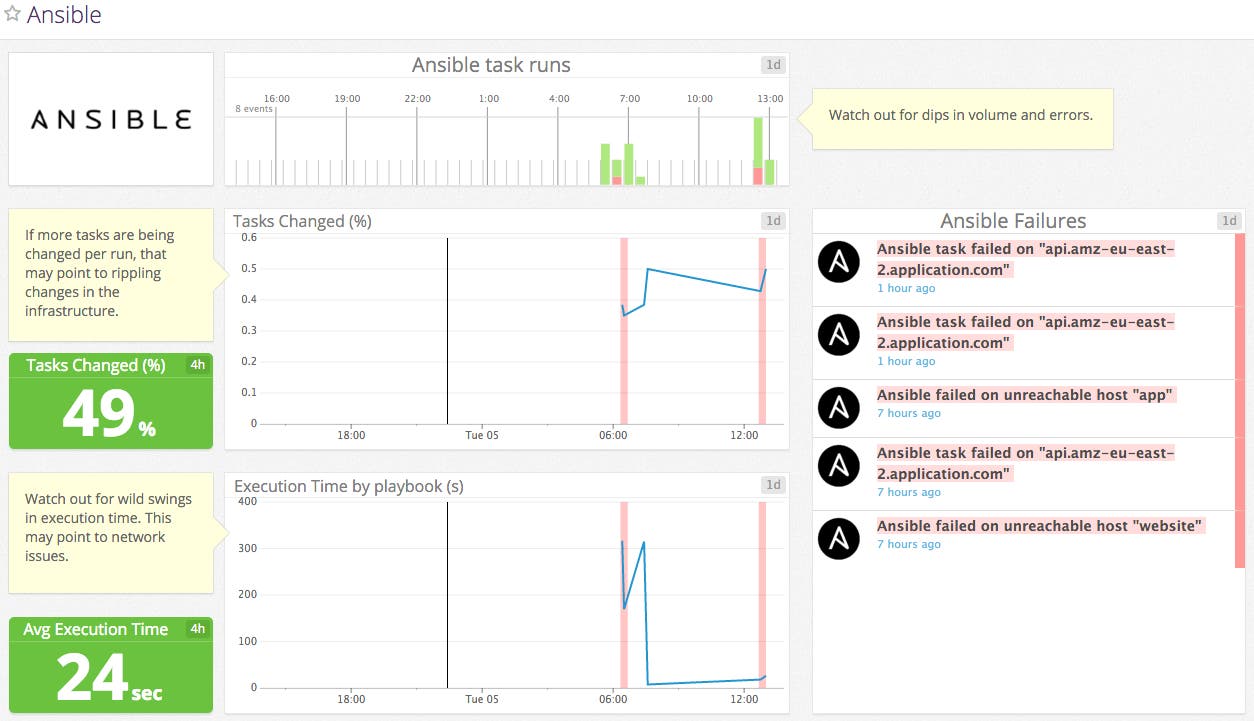
When deploying applications or changing configurations, you want to make sure the playbooks you scheduled were properly executed. You also want to know if some of them failed or took an abnormally long time to run.
If not properly defined, deployments can impact some applications’ performance. That’s why you also want to be able to correlate these insights with performance metrics from the different parts of your infrastructure.
With our new integration you can now:
- Get real-time reports on Ansible server runs
- Track key Ansible performance metrics across all your servers, such as how much time a playbook takes to execute
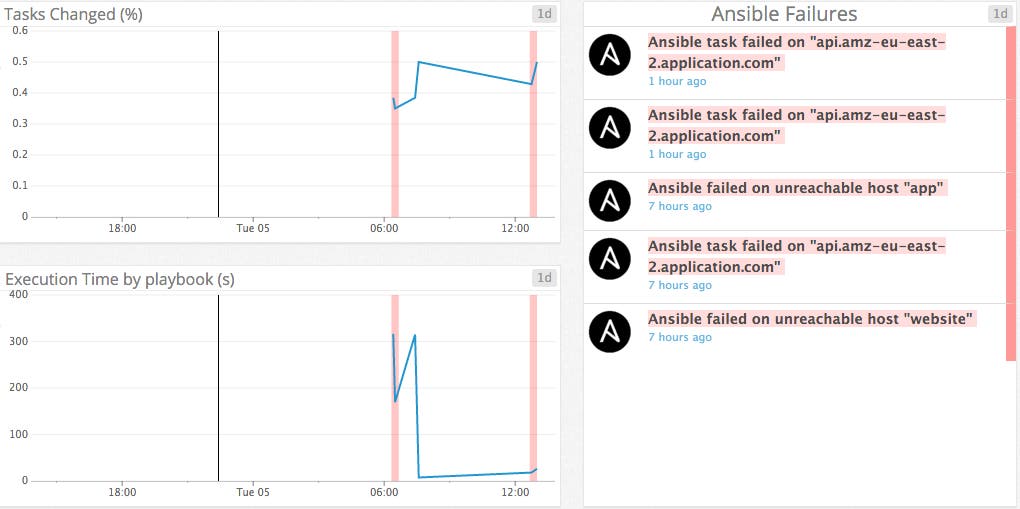
- Set alerts on tasks that fail repeatedly
- Correlate Ansible events and metrics with performance metrics from any part of your infrastructure in order to quickly identify problems’ root causes (e.g. network, task definition…)

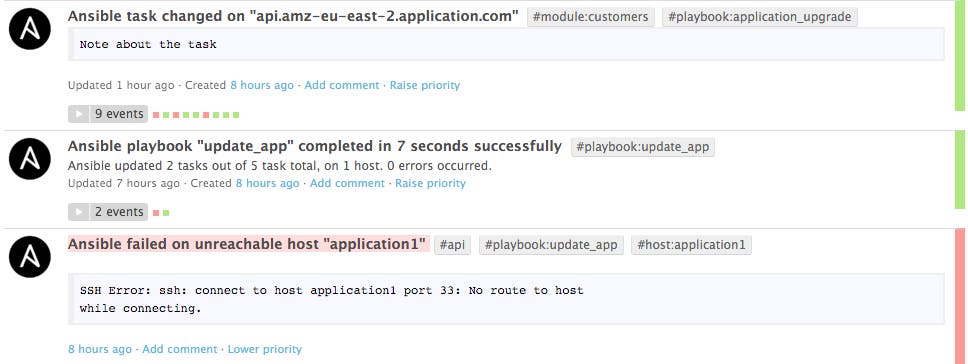
Every time your Ansible server runs a playbook, the callback configured with our integration reports to Datadog all the related metrics and events you need to monitor your deployments and configuration changes. You will be able to monitor the number of tasks that failed, that succeeded, that got skipped, and that were not required to make any change (“OK”), as well as nodes that were unreachable (perhaps due to a network issue), and the time taken to execute a playbook.

Once the callback has been set up on the Ansible server, it will report all the events and metrics automatically without any changes to your playbooks. You will be able to break down events and metrics by host or by playbook, and set up specific alerts for each of them.
Automate your monitoring
Just as Datadog can help you use Ansible, Ansible can help you use Datadog by automatically installing and configuring the Datadog Agent on each of your hosts.
The Datadog Ansible role, fully configurable via Ansible variables, installs the Agent and the integrations corresponding to the software running on each server (e.g. NGINX, Redis). In other words, Ansible will tell Datadog to monitor any software it manages, so your monitoring can scale effortlessly along with your infrastructure.
Below is an example playbook with the required role and variables to install the Agent and enable our SSH and NGINX integrations with customized configurations.
- hosts: servers roles: - { role: Datadog.datadog, sudo: yes } vars: datadog_api_key: "123456" datadog_config: tags: "mytag0, mytag1" log_level: INFO datadog_checks: ssh_check: init_config: instances: - host: localhost port: 22 username: root password: changeme sftp_check: True private_key_file: add_missing_keys: True nginx: init_config: instances: - nginx_status_url: http://example.com/nginx_status/ tags: - instance:foo - nginx_status_url: http://example2.com:1234/nginx_status/ tags: - instance:barSimplify your life in a few minutes
You can start collecting events and metrics from Ansible in a few easy steps.
If you are already a Datadog user, you can install our Ansible role by following the instructions provided on the Agent installation page. The instructions for the Ansible callback are available on the project’s GitHub page. If you don’t yet have a Datadog account, try it out by signing up for a free trial.


