
John Matson
Some of the most valuable metrics to monitor are also the most variable. Application throughput, web requests, user logins... all of these important, top-level metrics tend to have pronounced peaks and valleys, depending on the time of day or the day of the week. Those fluctuations make it very hard to set sensible thresholds for alerting or investigation.
To provide deeper context for dynamic metrics like these, we have added anomaly detection to Datadog. By analyzing a metric’s historical behavior, anomaly detection distinguishes between normal and abnormal metric trends. Here's a two-minute video walkthrough:
Accounting for seasonality
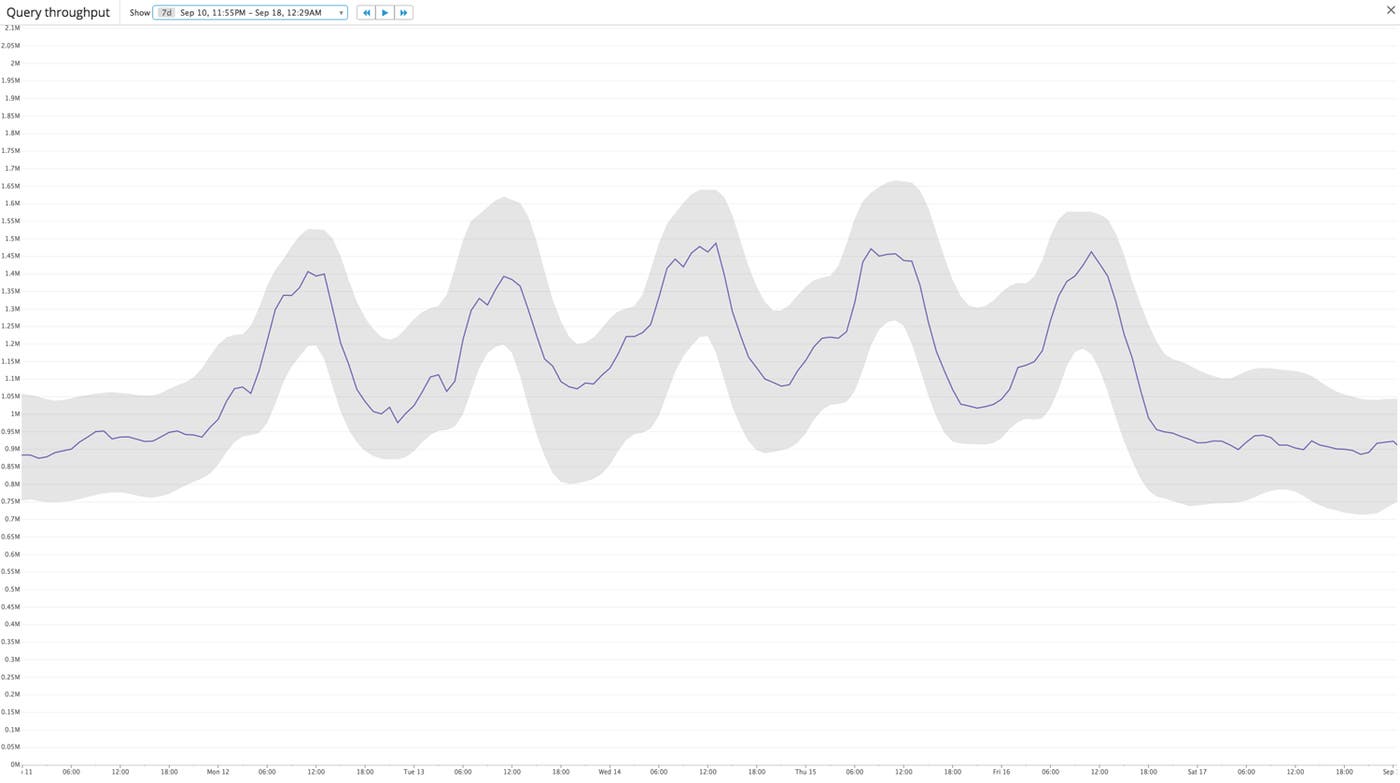
Above we see a timeseries graph of query throughput over a seven-day window. The actual throughput is in purple; the gray band shows the anomaly detection algorithm's predicted range based on data from prior weeks.
This metric exhibits a typical pattern: Throughput peaks during business hours each weekday, when application usage is highest, drops to a local minimum at night, and falls to a prolonged lull on the weekend. Because that pattern repeats week after week, the anomaly detection algorithm is able to accurately forecast the metric's value, peaks and all.
What's normal and what's not
Of course, anomaly detection is not just about showing you what's normal—it's also about surfacing what's not. Here we see an unexpected drop in request throughput, which is quickly flagged as an anomaly (red).
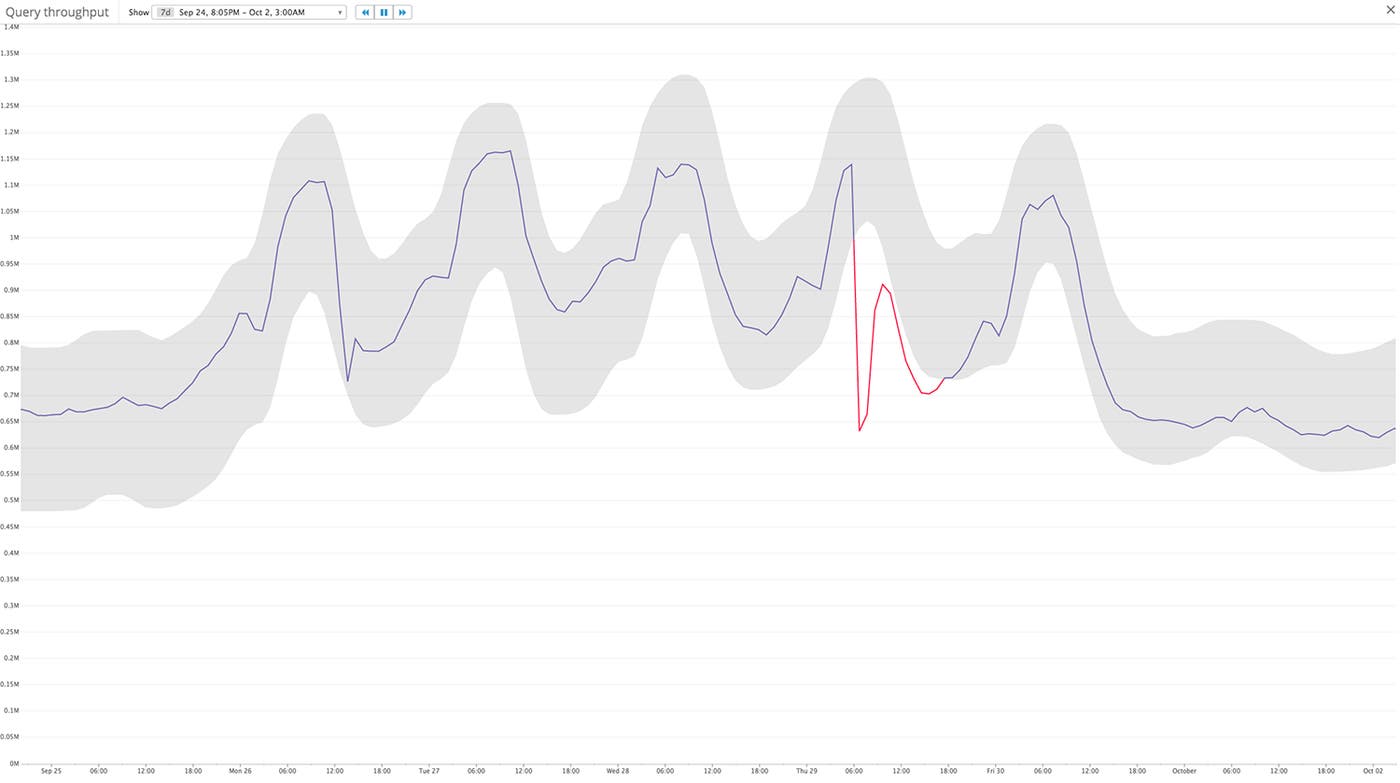
Plummeting throughput is a very serious symptom, but it's basically impossible to set threshold alerts that can identify an occurrence like this. After all, it's not that the metric's value was especially low when it dropped—it routinely reaches that level on weekends. It's just that it was anomalously low for midday on a Thursday.
Trends
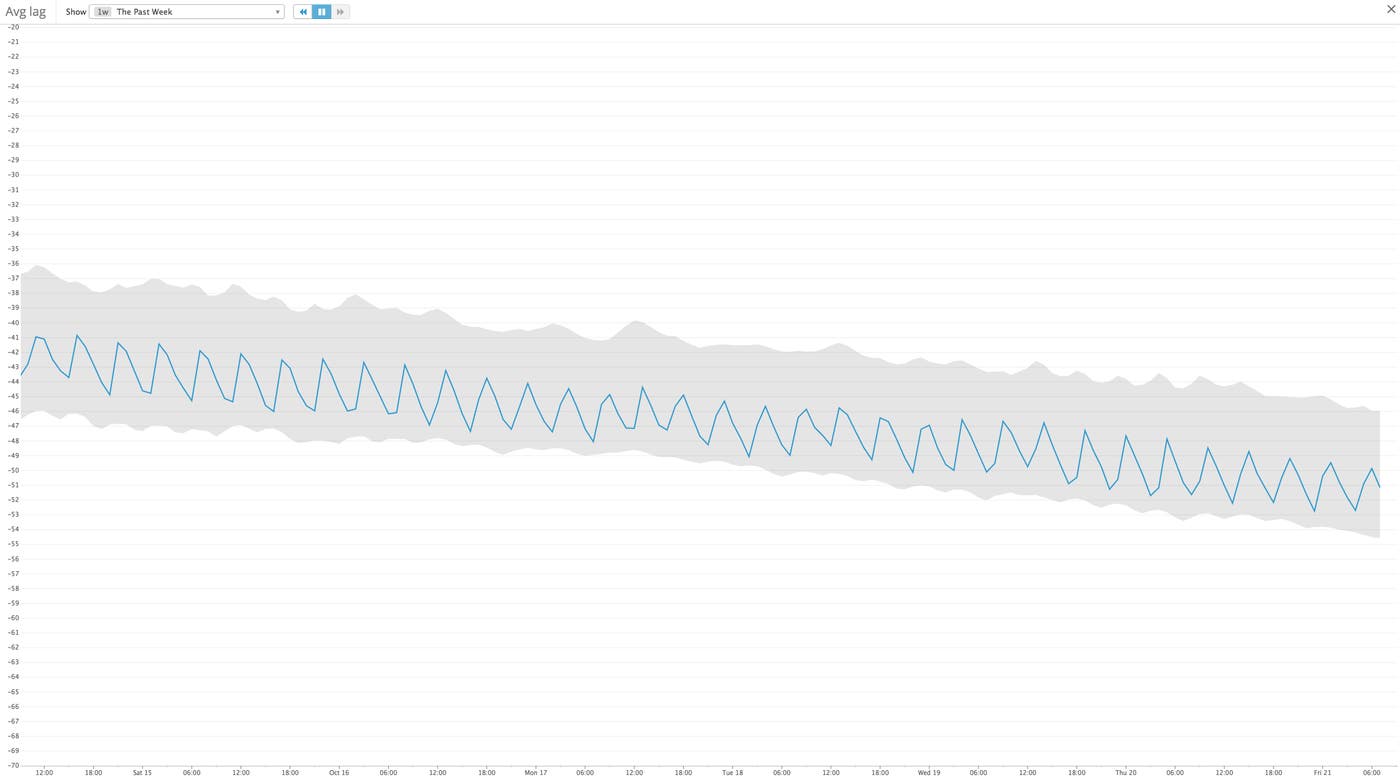
Some timeseries, such as the metric graphed above, are dominated by directional trends. Anomaly detection can separate the trend component from the seasonal component of a timeseries, so it can track metrics that are trending steadily upward or downward.
Set up automatic alerting for abnormal metric trends with anomaly detection from Datadog.
Adding anomaly detection to graphs and alerts
You can add anomaly detection to a timeseries graph by using the functions dropdown in the graph's query editor:

To set up an anomaly alert, create a new metric alert, select "Anomaly Detection" as the detection method, and choose the metric you wish to alert on:

Choosing & tuning an algorithm
Anomaly detection in Datadog takes two parameters:
The algorithm (basic, agile, or robust)
The bounds for that algorithm
Datadog automatically sets the appropriate algorithm for you after analyzing your chosen metric. However, you can still change these parameters under Advanced Options for setting alert conditions.
The algorithms
Our algorithms are rooted in established statistical models, but they have been heavily adapted to the domain of high-scale infrastructure and application monitoring. Among the key modifications: our data science team has worked extensively on robustness, so that future predictions remain reliable in the wake of disruptions and anomalies (especially with the robust algorithm). Datadog's algorithms can also respond to level shifts, so that forecasts adapt rapidly to changes in a metric's baseline (especially with the agile algorithm). More generally, the algorithms are designed to fit into your existing monitoring practices with a minimum of tuning, so they can automatically identify trends on various timescales from most seasonal metrics.
Basic uses a simple lagging rolling quantile computation to determine the range of expected values. It adjusts quickly to changing conditions but has no knowledge of seasonality or long-term trends.
Agile is a robust version of the seasonal autoregressive integrated moving average (SARIMA) algorithm. It is sensitive to seasonality but can also quickly adjust to level shifts in the metric—for instance, if a code change increases the baseline level of requests per second.
Robust is a seasonal-trend decomposition algorithm that works best for seasonal metrics that have a relatively level baseline. Its predictions are very stable, so its forecast won't be unduly influenced by long-lasting anomalies.
We recommend starting with agile or robust for metrics with daily or weekly fluctuation patterns.
The bounds
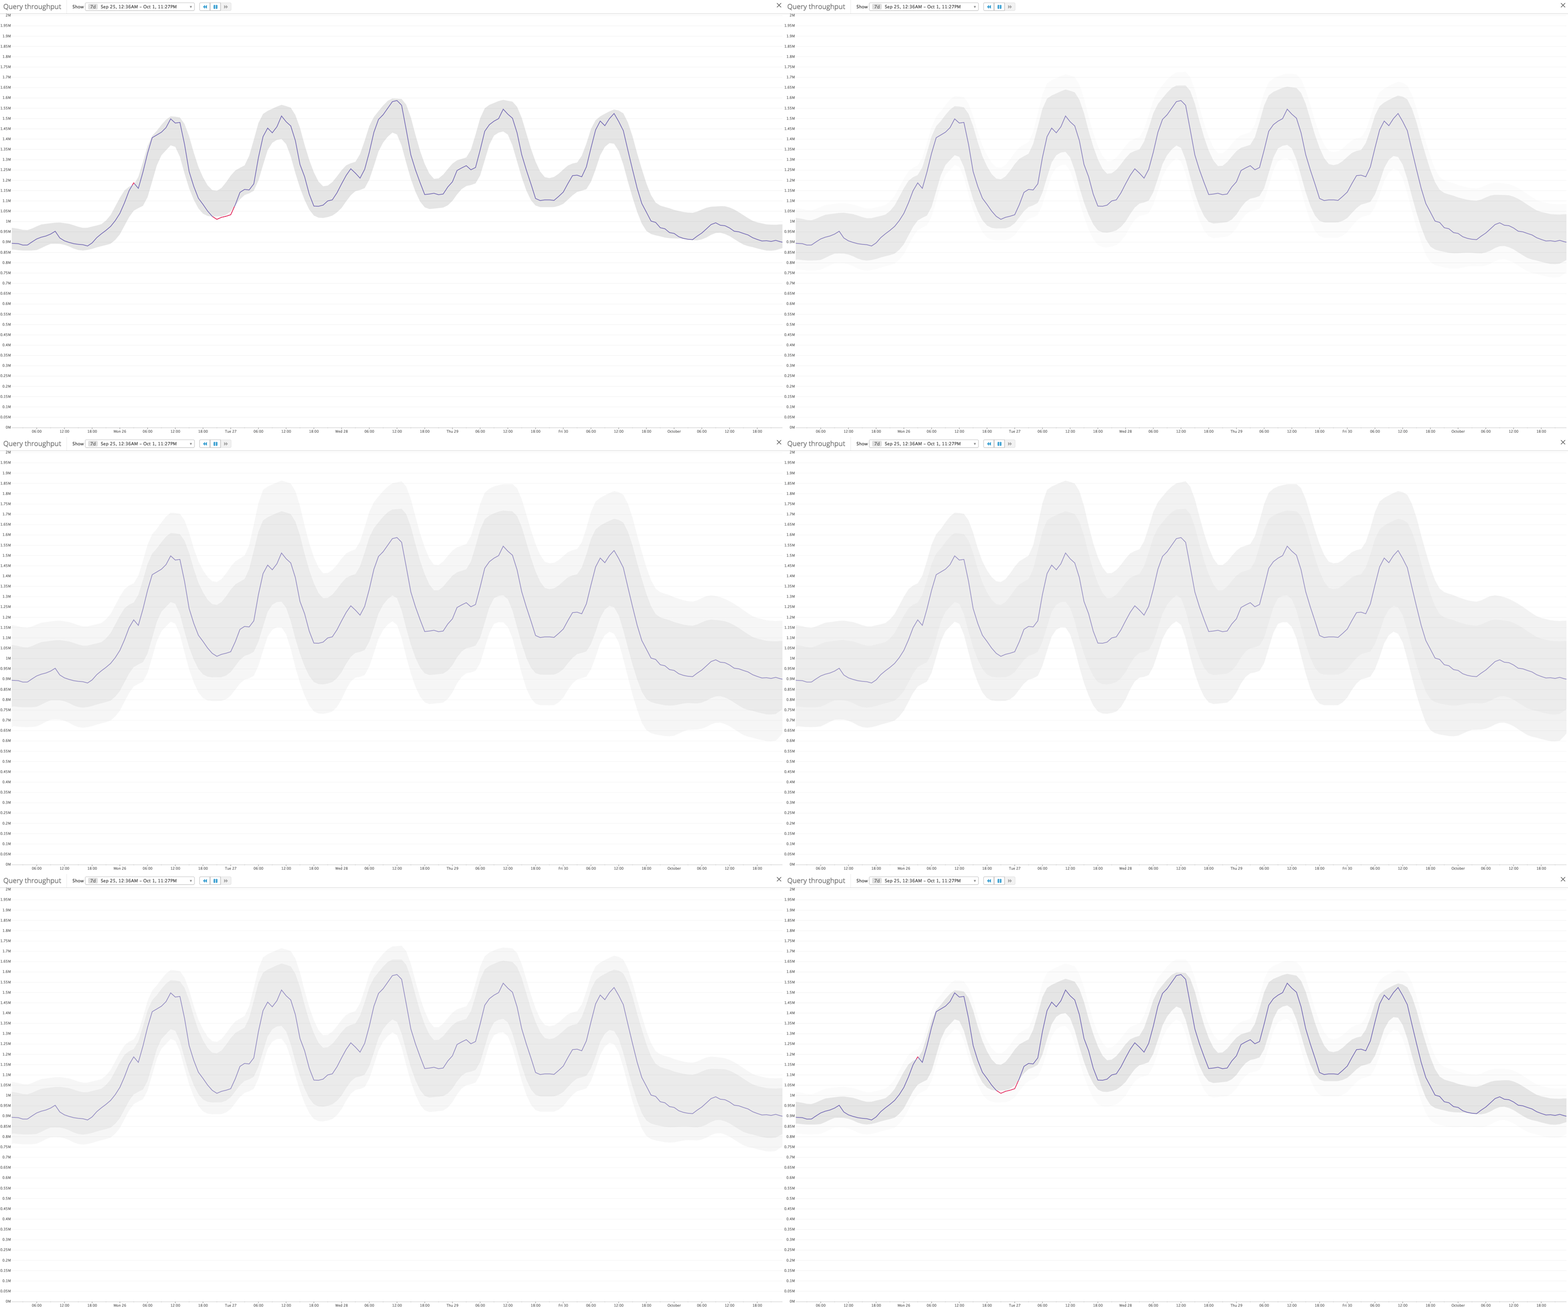
The bounds parameter in the query editor determines the tolerance of the anomaly detection algorithm, and hence the width of the "normal" gray band. You can think of these bounds as deviations from the predicted timeseries value. For most timeseries, setting the bounds to 2 or 3 will capture most "normal" points in the gray band. Here we see how the same algorithm looks with bounds set to 1 (narrowest), 2, 3, and 4 (widest):
Instant historical context
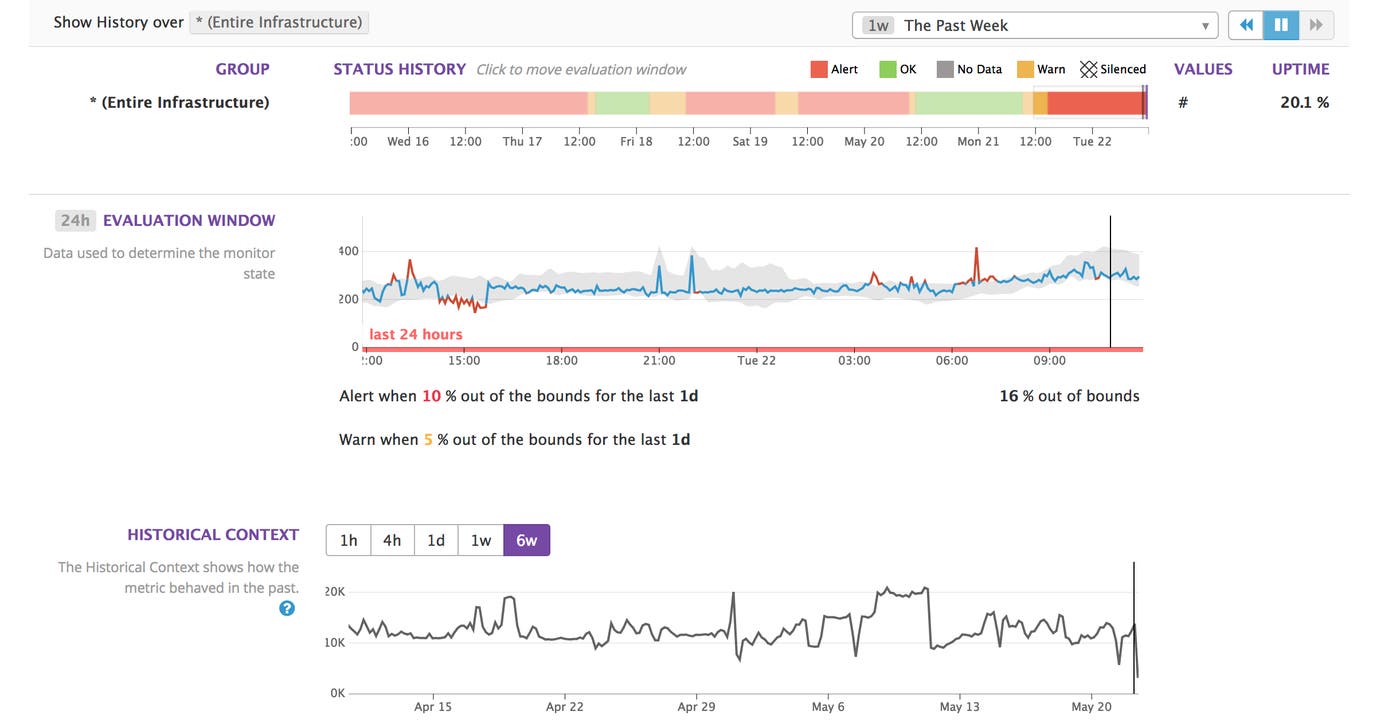
When a responder gets an anomaly alert, he or she needs to know exactly why the alert triggered. The monitor status page for anomaly alerts shows what the metric in question looked like over the alert's evaluation window, overlaid with the algorithm's predicted range for that metric. You can also click through deeper historical context showing the metric's evolution over the past hours to weeks, so you can see how that forecast was determined.
Get to detecting
Anomaly detection is now available in Datadog. It complements outlier detection, which allows you to identify unexpected differences in behavior among multiple entities reporting the same metric.
If you don't yet have a Datadog account, you can sign up for a free trial account here.

