Abril Loya McCloud
Apache Tomcat is an open source HTTP web server developed by the Apache Software Foundation that is available on both Windows and Unix-like operating systems. Tomcat is an open source implementation of several Java technologies (Servlet, JavaServer Pages, Java Expression Language, WebSocket) and is commonly used by large organizations to serve Java applications.
Tomcat is made up of Catalina (servlet), Coyote (connector), Jasper (JSP), and Cluster (load balancing and session replication). Monitoring your Tomcat web server components is crucial because poor performance can directly interfere with web application end-user experience. Datadog integrates with Apache Tomcat to collect metrics from your server and provide actionable visualizations and alerts based on real-time performance.
All your Tomcat metrics, in one place
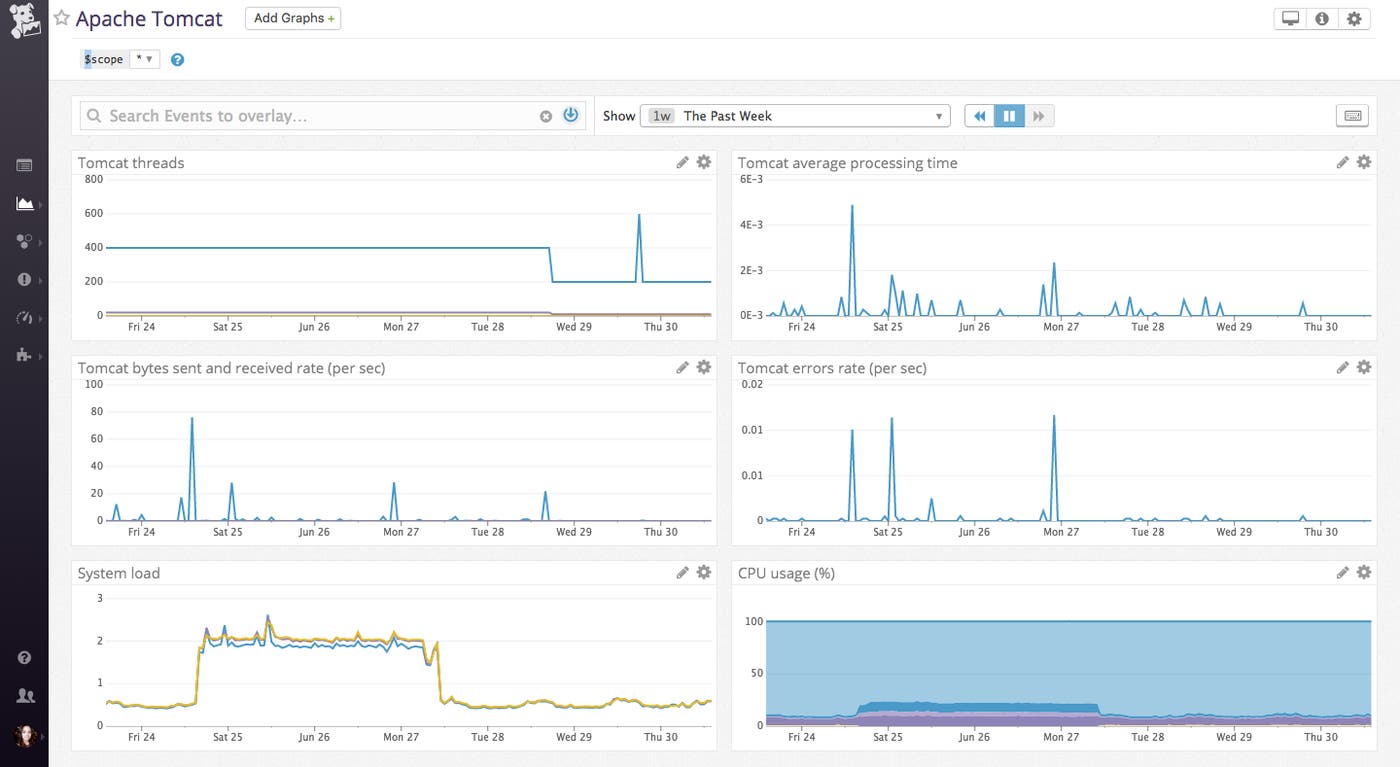
Once you integrate Tomcat with Datadog, metrics from your server will automatically be pulled into Datadog and begin populating an out-of-the-box dashboard. These metrics fall into four main categories: general Tomcat metrics, thread pool metrics, servlet metrics, and jsp metrics.

Tomcat performance metrics
For a general overview of Tomcat performance, you can take a look at metrics tomcat.error_count, tomcat.request_count, tomcat.max_time, and tomcat.processing_time. These metrics are less granular than servlet-specific metrics, like tomcat.servlet.processing_time and tomcat.servlet.error_count. Changes in tomcat.request_count and its corresponding metric, tomcat.processing_time, are dependent on the number of people accessing your web application. This makes them important to keep an eye on in the case of sudden peaks or valleys, which may warrant action. These two metrics also provide necessary context for the rest of your metrics, like in the case of tomcat.max_time and tomcat.error_count, which can rise when the number of requests increase.
Thread pool metrics
Thread metrics are a useful tool for keeping track of resource consumption. By comparing tomcat.threads.count and tomcat.threads.busy to your tomcat.threads.max, you can surmise how much of your predesignated thread resources you are currently consuming. Thread pool metrics, when correlated with tomcat.bytes_sent and tomcat.bytes_rcvd, afford visibility into your current web server capacity.
Catalina servlet metrics
While all of the above metrics provide valuable information, the metric arguably most telling of performance issues for your end users is tomcat.servlet.processing.time. This metric shows how much time it takes for your users to be served the web page. If there is a spike in this metric, it means that some part of your application infrastructure is taking longer than usual to process a client request. This could be caused by overloaded servers, a slow database, or even by comparatively inefficient code being deployed to the web server. In the latter case you can pinpoint problematic code changes quickly by correlating your latency metrics with code push events on your Datadog dashboards.
All of these metrics can be seen in an out-of-the-box dashboard to help you get started quickly.
Try it
If you’re a Datadog customer, integrating Tomcat with the Datadog Agent is simple. You can follow these instructions to configure the Agent to start collecting metrics from each of your Tomcat instances. You can also customize metric collection within the Agent by using the Java integration documentation found here.
If you’re not yet using Datadog, you can start monitoring Apache Tomcat along with the rest of your infrastructure in minutes by signing up for a Datadog trial.

