Darron Froese
Darron Froese @darron is a Datadog Site Reliability Engineer and runs his own blog where this was originally posted. We’re thrilled that Darron gave us the opportunity to share his post with the Datadog community.
At nonfiction, we hosted the sites we built using a number of different hosting providers. The vast majority of the sites are hosted on some Rackspace Cloud instances—they have been very reliable for our workloads.
One of those servers had been acting up recently and had been becoming unresponsive for no obvious reason, so we took a quick look one morning when we had been woken up at 5AM.
Watching top for a moment, we noticed that some Apache processes were getting very large. Some of them were using between 500MB and 1GB of RAM—that’s not within the normal usage patterns.
The first thing we did was set some reasonable limits on how large the Apache + mod_php processes could get—memory_limit 256MB. Since the Apache error logs are all aggregated with Papertrail, we setup an alert that sent a message to the nonfiction Slack room if any processes were killed. Those alerts look like this:

Once that was set up, we very quickly found that a customer on a legacy website had deleted some very important web pages, when those pages were missing some very bad things could happen with the database. This had been mitigated in a subsequent software release but they hadn’t been patched. Those pages were restored and they were patched. The problem was solved—at least, the immediate problem.
Keeping an eye on top, there were still websites that were using up more memory than normal—at least more than we thought was normal. But sitting there watching was not a reasonable solution, so we whipped up a small script to send information to Datadog’s DogStatsD that was on the machine.
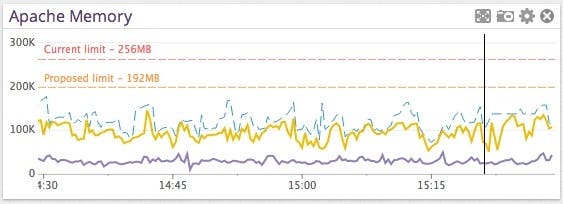
We were grabbing the memory size of the Apache processes and sending them to Datadog—the graphs that were generated from that data look like this:

Now we had a better—albeit fairly low-resolution—window into how large the Apache processes were getting.
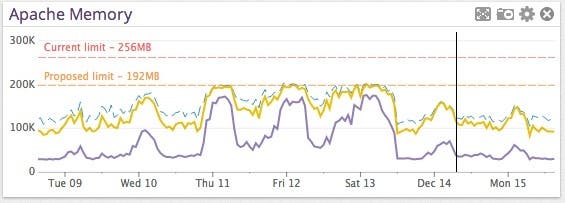
Over the last week, we have had a good amount of data to make some changes to how Apache is configured and then measure how it responds and reacts. Here’s how the entire week’s memory usage looked like:

Using Datadog’s built-in process monitoring function and this graph, we gained some insight into how things were acting overall, but not enough detailed information into exactly which sites were the memory hogs.
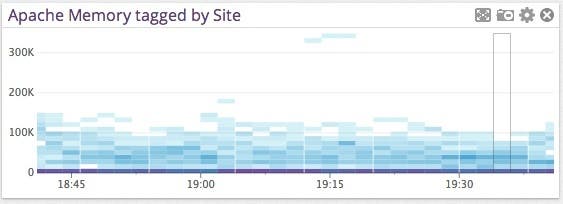
In order to close that gap, I wrote another small Ruby script and between ps and /server-status we had all the information we needed:

We can now see which sites are using the most memory in the heatmap and the nonfiction team will be able to take a look at those sites and adjust as necessary. It’s not a perfect solution, but it’s a great way to get more visibility into exactly what’s happening—and it only took a couple of hours in total.
What did we learn from all of this?
- Keeping MinSpareServers and MaxSpareServers relatively low can help to kill idle servers and reclaim their memory. We settled on 4 and 8 in the end – that helps to keep overall memory usage much lower.
- A small change–a missing page in a corporate website–can have frustrating repercussions if you don’t have visibility into exactly what’s happening.
- The information you need to solve the problem is there–it just needs to be made visible and digestible. Throwing it into Datadog gave us the data we needed to surface targets for optimization and helped us to quickly stabilize the system.
All the source code for these graphs are available here and here. Give them a try and start monitoring Apache if you need more insight into its performance.


