Emily Chang
This post is part 2 of a 3-part series about monitoring Apache performance. Part 1 provides an overview of the Apache web server and its key performance metrics, and part 3 describes how to monitor Apache with Datadog.
In this post, we will show you how to collect the key Apache metrics mentioned in Part 1, which are available through Apache’s status module (mod_status) and the server access log. The table below shows where you can access each family of metrics mentioned in Part 1.
| Metric category | Availability |
|---|---|
| Work metrics: request latency, bytes actually served | access log |
| Work metrics: rate of requests, bytes that should have been served | mod_status |
| Resource utilization and activity metrics | mod_status |
| Error rate | access log |
Apache exposes high-level metrics through its status module, and logs additional details about each client request in the access log. By consulting both of these sources, you can identify degradations and troubleshoot potential issues.
In this post, we will show you how to aggregate this data so that you can make sure that your servers are running smoothly. We will also walk through the process of installing and using two open source tools that help you monitor Apache in real time, directly from the command line.
Apache’s status module
Apache web server exposes metrics through its status module, mod_status. If your server is running and mod_status is enabled, your server’s status page should be available at http://192.0.2.0/server-status. If that link does not work, it means you need to enable mod_status in your configuration file.
It’s also possible that your configuration file specifies a Location that is not /server-status, either intentionally or unintentionally. Follow the directions below to locate your mod_status configuration file, and look for a directive that contains SetHandler server-status. If you see that it specifies a Location other than /server-status, either update it accordingly (and restart Apache) or try accessing that endpoint to see if mod_status is enabled at that location.
How to enable Apache mod_status
If you need to enable mod_status, you either have to edit the status module’s configuration file (on Debian platforms), or your main Apache configuration file (all other Unix-like platforms). Regardless of which system you’re using, make sure to save a backup copy of the configuration file before making changes to it, in case you need to revert to an earlier state.
Finding the config on Debian systems
Debian users can find the status module’s configuration file at /etc/apache2/mods-enabled/status.conf.
Finding the config on other UNIX-like platforms
Users of other platforms (such as Red Hat–based systems) will find their main configuration file at /etc/apache2/apache2.conf, /etc/httpd/conf/httpd.conf, or /etc/apache2/httpd.conf. In the main configuration file, locate the following line and make sure it is uncommented:
LoadModule status_module libexec/apache2/mod_status.soUpdating the config file
You’ll need to update the block (either in your status module’s config file or main Apache config file) that starts with <Location /server-status> to specify which IP addresses should have access to the status page. In the example below, we are allowing access from localhost, as well as the IP address x.x.x.x.
<Location /server-status> SetHandler server-status Require local Require ip x.x.x.x</Location>Replace x.x.x.x with the IP address that needs to access the status page. In addition to (or instead of) requiring an IP address, you can also restrict access to authenticated users, as shown in the example below.
<Location /server-status> SetHandler server-status AuthUserFile /location/of/htpasswd AuthType Basic AuthName "Make up a name here for who can access Apache status" Require user <USER_NAME></Location>This relies on Apache’s htpasswd functionality, which enables administrators to create users and groups, and set up a means of authenticating their access to specific resources on the web server (such as your server-status page). Consult the Apache documentation for more details on how to set up authentication and authorization in Apache.
After you’re done making changes, save and exit. You can check your configuration file for errors with the following command:
apachectl configtestPerform a graceful restart to apply the changes without interrupting live connections (apachectl -k graceful or service apache2 graceful).
Apache’s mod_status metrics
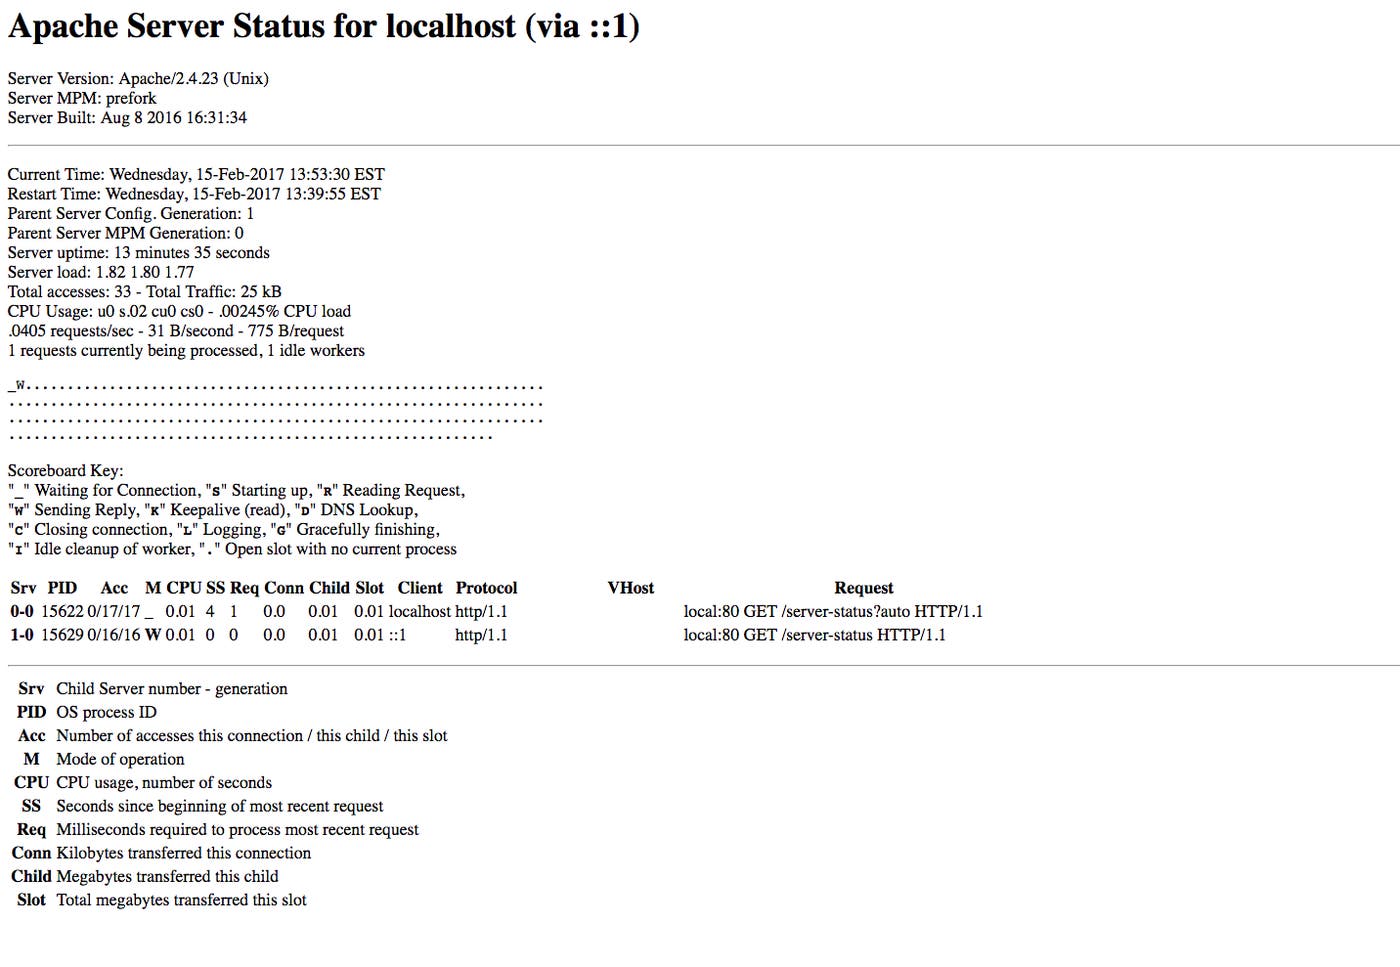
After enabling mod_status and restarting Apache, you will be able to see your status page at http://<YOUR_DOMAIN>/server-status. Your Apache status page will look like this:

If you want your mod_status page to automatically refresh at regular intervals, add ?refresh=X to the end of your URL to refresh every X seconds (e.g. http://192.0.2.0/server-status?refresh=5).
A note about ExtendedStatus
Apache’s status module has an option called ExtendedStatus, which is enabled by default as of version 2.4. Enabling ExtendedStatus can have a slight hit on performance, as the system must call gettimeofday() twice for each request in order to log timing information. If your servers are already under heavy load, enabling ExtendedStatus may not make sense. However, the additional information it provides generally makes it worthwhile to enable ExtendedStatus, which you can then turn off if you notice any negative impact on performance.
How to enable ExtendedStatus
The ExtendedStatus directive is either located within the main configuration file’s <IfModule mod_status.c> section (CentOS/RHEL), or within the mod_status configuration file (Debian/Ubuntu).
ExtendedStatus metrics
Once you enable ExtendedStatus, you will see these additional metrics on the mod_status page:
- total accesses/hits
- total kBytes served
- CPU load
- uptime
- requests per sec
- bytes per sec
- bytes per request
ExtendedStatus also displays additional information about each request, along with detailed information about recently processed requests (including the client, requested resource, and processing time). ExtendedStatus metrics can be useful for troubleshooting performance degradations and diagnosing issues. With access to additional details about each individual request, you can spot if a request for a specific resource was taking an extraordinarily long time, or if it was using more CPU compared to other requests around the same time.
Machine-readable status metrics
To access the status page in a machine-readable format, visit http://<YOUR_DOMAIN>/server-status?auto, which will show something more like this, if ExtendedStatus is enabled:
ServerVersion: Apache/2.4.23 (Unix)ServerMPM: preforkServer Built: Aug 8 2016 16:31:34CurrentTime: Wednesday, 15-Feb-2017 13:59:47 ESTRestartTime: Wednesday, 15-Feb-2017 13:39:55 ESTParentServerConfigGeneration: 1ParentServerMPMGeneration: 0ServerUptimeSeconds: 1192ServerUptime: 19 minutes 52 secondsLoad1: 2.13Load5: 1.87Load15: 1.79Total Accesses: 49Total kBytes: 41CPUUser: 0CPUSystem: .02CPUChildrenUser: 0CPUChildrenSystem: 0CPULoad: .00167785Uptime: 1192ReqPerSec: .0411074BytesPerSec: 35.2215BytesPerReq: 856.816BusyWorkers: 1IdleWorkers: 1Scoreboard: _W........................................................................................................................................................................................................................................................The machine-readable page will not display detailed information about individual requests; in order to view that information, you will need to visit the main server-status page.
Mod_status provides many of the resource utilization and activity metrics discussed in Part 1. Some tools, including collectD and Datadog, can automatically parse the machine-readable status page and enable you to visualize those metrics in graphs.
Apache logs
In addition to the status module, Apache’s access log provides even more detailed information about each client request. You can customize what information is included in your Apache logs so that it is more relevant for your needs. Within your main Apache configuration file, locate the section that starts with “LogFormat”:
LogFormat "%v:%p %h %l %u %t \"%r\" %>s %O \"%{Referer}i\" \"%{User-Agent}i\"" vhost_combinedLogFormat "%h %l %u %t \"%r\" %>s %O \"%{Referer}i\" \"%{User-Agent}i\"" combinedLogFormat "%h %l %u %t \"%r\" %>s %O" commonLogFormat "%{Referer}i -> %U" refererLogFormat "%{User-agent}i" agentThe nickname of each LogFormat is listed at the end of each line: “vhost_combined,” “combined,” “common,” “referer,” and “agent.”
Apache log variables
You can customize your Apache access log by changing the order and/or adding and deleting log variables. Consult the full list of available variables here.
Upon examining the combined log format, we can see that it logs the remote hostname (%h), remote logname (%l), remote user (%u), the time Apache received the request (%t), the first line of the request in quotes (\"%r\"), the final HTTP status of the response (%>s), the size of the response in bytes (%O), the referer (\"%{Referer}i\") and user agent (\"%{User-Agent}i\").
Three of the variables are logged in quotes because their contents may include spaces (the quotation marks are escaped with backslashes). The last two variables follow the format %{VARNAME}i, in which VARNAME matches the request header line of the request sent to Apache, and i indicates that the contents of that header line should be logged.
Note that %O logs the number of bytes actually served in each response, as opposed to the number of bytes that should have been served (the information reported by mod_status, as mentioned in Part 1).
Customizing your Apache access log
You can use log variables to edit an existing LogFormat or create a custom format. For example, if we wanted to add a new format that is identical to the combined log format, but also logs the request latency in microseconds, we could create a new LogFormat (which we will call “reqtime” in this example) and add in the variable %D, like this:
LogFormat "%h %l %u %t \"%r\" %>s %O \"%{Referer}i\" \"%{User-Agent}i\" %D" reqtimeSave the file and exit. To specify that one or more of our virtual hosts should log requests using the new custom reqtime format, find the line that starts with “CustomLog” within each Virtual Host’s configuration file. (If you are on an RHEL platform, this may also be located in your main configuration file, within the <IfModule log_config_module> directive.) The last word in the line specifies which LogFormat to use. Update it to the nickname you just created in the main config file (e.g. CustomLog /path/to/access.log reqtime). Save and exit the file, and restart Apache (apachectl restart or service apache2 restart). Replace restart with graceful if you want to restart Apache gracefully (without interrupting connections).
Now Apache should start logging with our custom format, including the request latency (in microseconds) at the end of each line:
11.123.456.789 - - [15/Feb/2017:16:44:17 -0500] "GET /images/swirl.png HTTP/1.1" 404 511 "http://my.domain.name/css/custom.css" "Mozilla/5.0 (Macintosh; Intel Mac OS X 10_12_1) AppleWebKit/537.36 (KHTML, like Gecko) Chrome/56.0.2924.87 Safari/537.36" 303In the access log shown above, a request was made from a client with the IP address 11.123.456.789. The next two fields, remote logname and remote user, were not supplied, as indicated by the dashes. The request tried to access the swirl.png image, and resulted in a final HTTP status of 404, indicating that the server was unable to locate the file. The next two fields tell us that the size of the response was 511 bytes, and the referer was a CSS file. The next two fields show us the client’s user agent (browser type) and the request processing time in microseconds.
You can also use conditional variables to specify if certain requests should not be logged, or, alternatively, specify conditions that must be met in order for requests to be logged (e.g. only log the User Agent for requests if they have 404 or 500 status codes). However, generally it’s a good idea to collect all of the information first, which you can then selectively filter at a later time.
Log aggregation and parsing tools
Many log aggregation services (both commercial and open source) have been designed to help aggregate, parse, and analyze Apache access logs. You can use open source tools like FluentD, Logstash and rsyslog to aggregate and parse Apache logs for useful information, and output the data to other monitoring platforms. For more details about how to set up the FluentD plugin to report metrics to Datadog, see Part 3 of this series.
Open source monitoring tools
The open source community has developed several tools to help users monitor Apache’s performance metrics in a different format than the built-in status module. Below, we will explore two options that enable you to analyze Apache status metrics and logs, right from the command line.
Apachetop
Apachetop is an open source tool that parses your Apache access log for useful statistics and displays them on the command line, similar to the way that top displays live information about processes. It is available as a Linux package (apt-get install apachetop or yum install apachetop). Once you’ve installed it, run the following command:
sudo apachetop -f /path/to/access.logThe -f flag enables you to specify the location of the log file you want to parse. You can track multiple log files (Apachetop also works with NGINX access logs) by adding the flag multiple times:
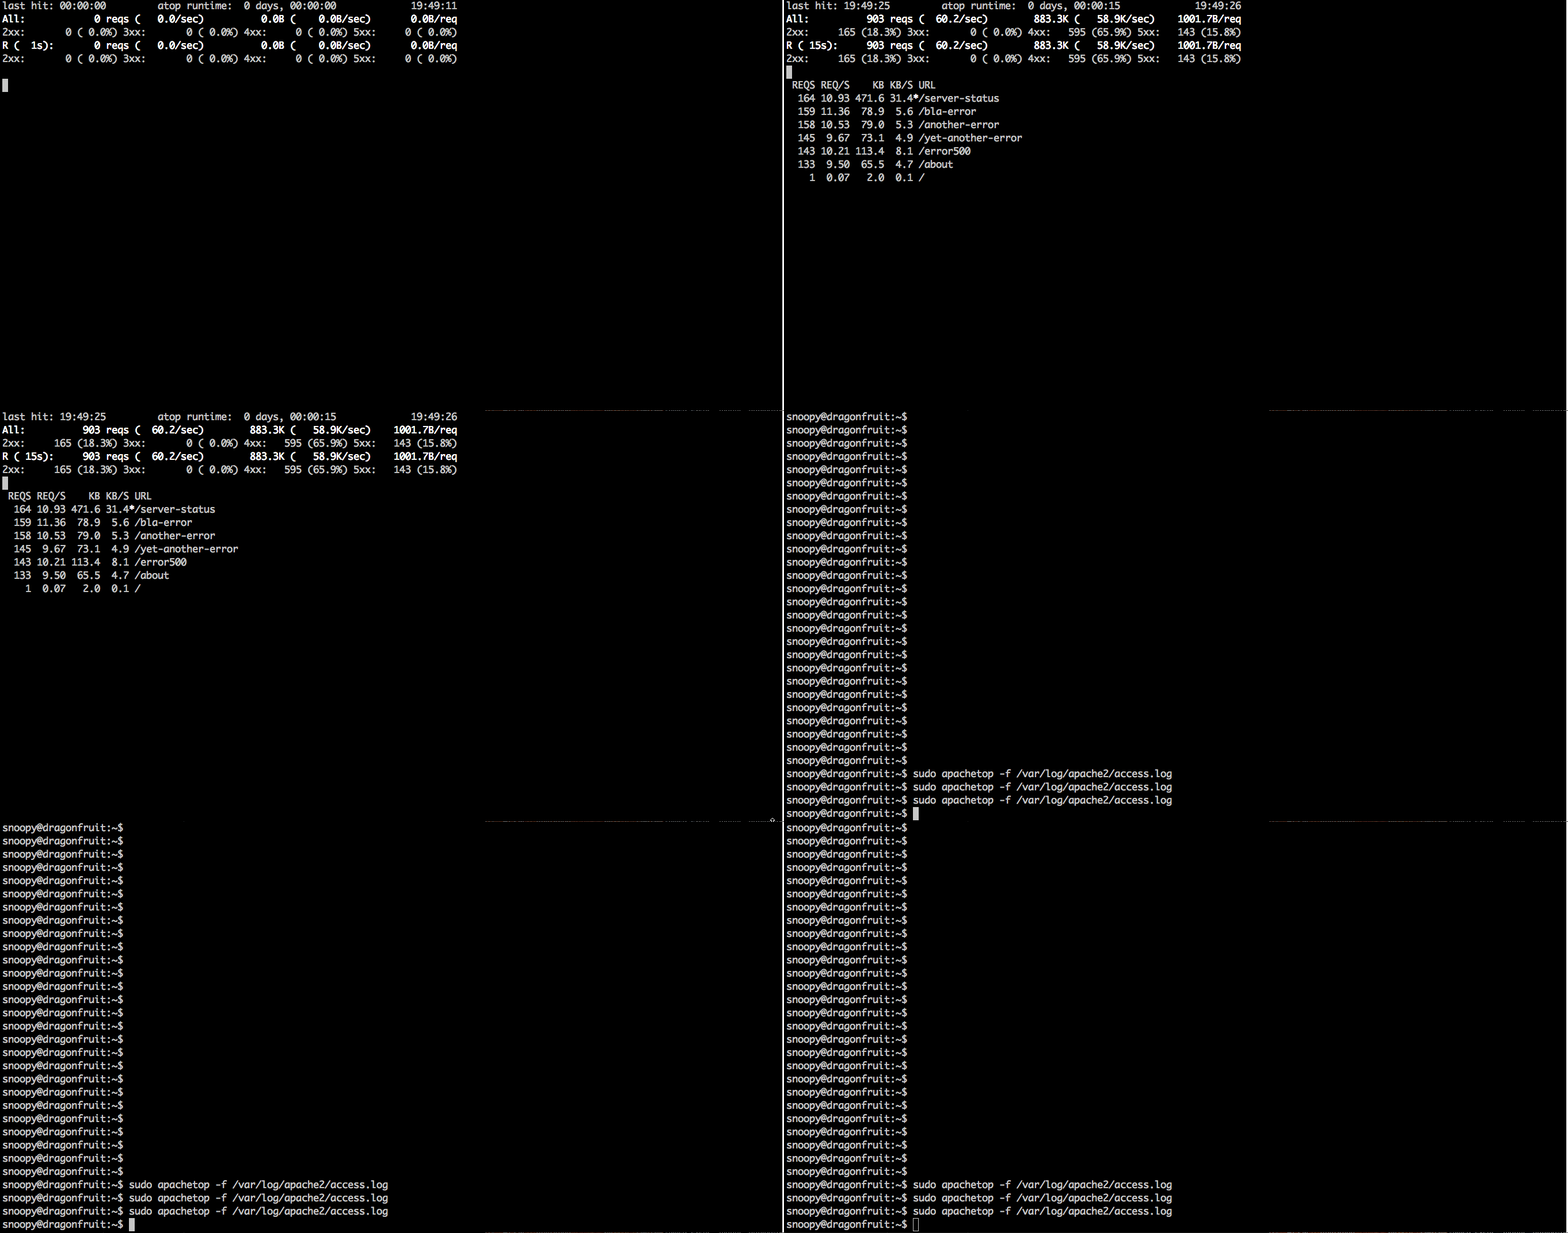
apachetop -f /path/to/access.log -f /another/access.logOnce you run the command, you’ll be able to monitor incoming requests in real time:

The output displays the time of the last request, as well as recently requested resources/endpoints. It also calculates a handful of useful metrics, including the rate of requests and bytes served per second, and the percentage of requests that resulted in each status code family (2xx/3xx/4xx/5xx). These metrics are calculated and displayed in two scopes:
- across all requests
- broken down by requests made over a recent time interval, usually the previous 30 seconds (immediately after startup, Apachetop will report shorter intervals until it accrues 30 seconds of data)
Atop
Atop is another open source project that shows request information in real time. Atop gets its information from mod_status (with ExtendedStatus enabled); since it does not parse the access log, you cannot break down requests by their HTTP response codes the way you can with Apachetop. However, it does include some nice interactive ways to search and filter through requests.
To install atop, clone the GitHub repo, and make sure the links package is installed (apt-get install links). Then run it from the installation directory: ./atop
Among other sorting and filtering options, you can use atop to search requests for certain terms, directly from the command line, as shown below.

Automate your Apache monitoring
Apache’s status page, access logs, and open source command line tools can be very useful for getting a sense of real-time performance. However, in order to visualize metrics, analyze historical trends, and set up useful alerts, you will need to implement a more sophisticated monitoring system.
Datadog has developed an integration with Apache to help you start visualizing metrics from your web servers in minutes. Whether you are using Apache with NGINX as your reverse proxy, or serving PHP applications and MySQL data in a classic LAMP stack, you need to be able to keep track of all of the moving parts in one place. Since Datadog integrates with more than 1,000 technologies, you can see Apache metrics in context, right alongside performance metrics and event data from your databases, cloud providers, configuration management tools, and more.
Learn how to start monitoring Apache with Datadog in our next post, or get started right away with a free trial of Datadog.


