Today at Dash 2022, we announced new products and features that enable your teams to break down information silos, shift testing to the left, monitor cloud and application security, and more. Now, you can analyze cloud cost data alongside other telemetry, create synthetic tests for your mobile applications, and prevent malicious activity in your environment by blocking IPs directly from Datadog. We expanded Sensitive Data Scanner to include APM, RUM, and Events stream data. And we introduced Datadog Incident Management, Session Replay, and Continuous Profiling for customers who need visibility into their Moderate Impact-level applications and infrastructure. We’ll recap these new offerings in this post—as well as all the other big announcements from Dash 2022—and help you get started using them to gain deeper visibility into your environment.
Breaking down silos
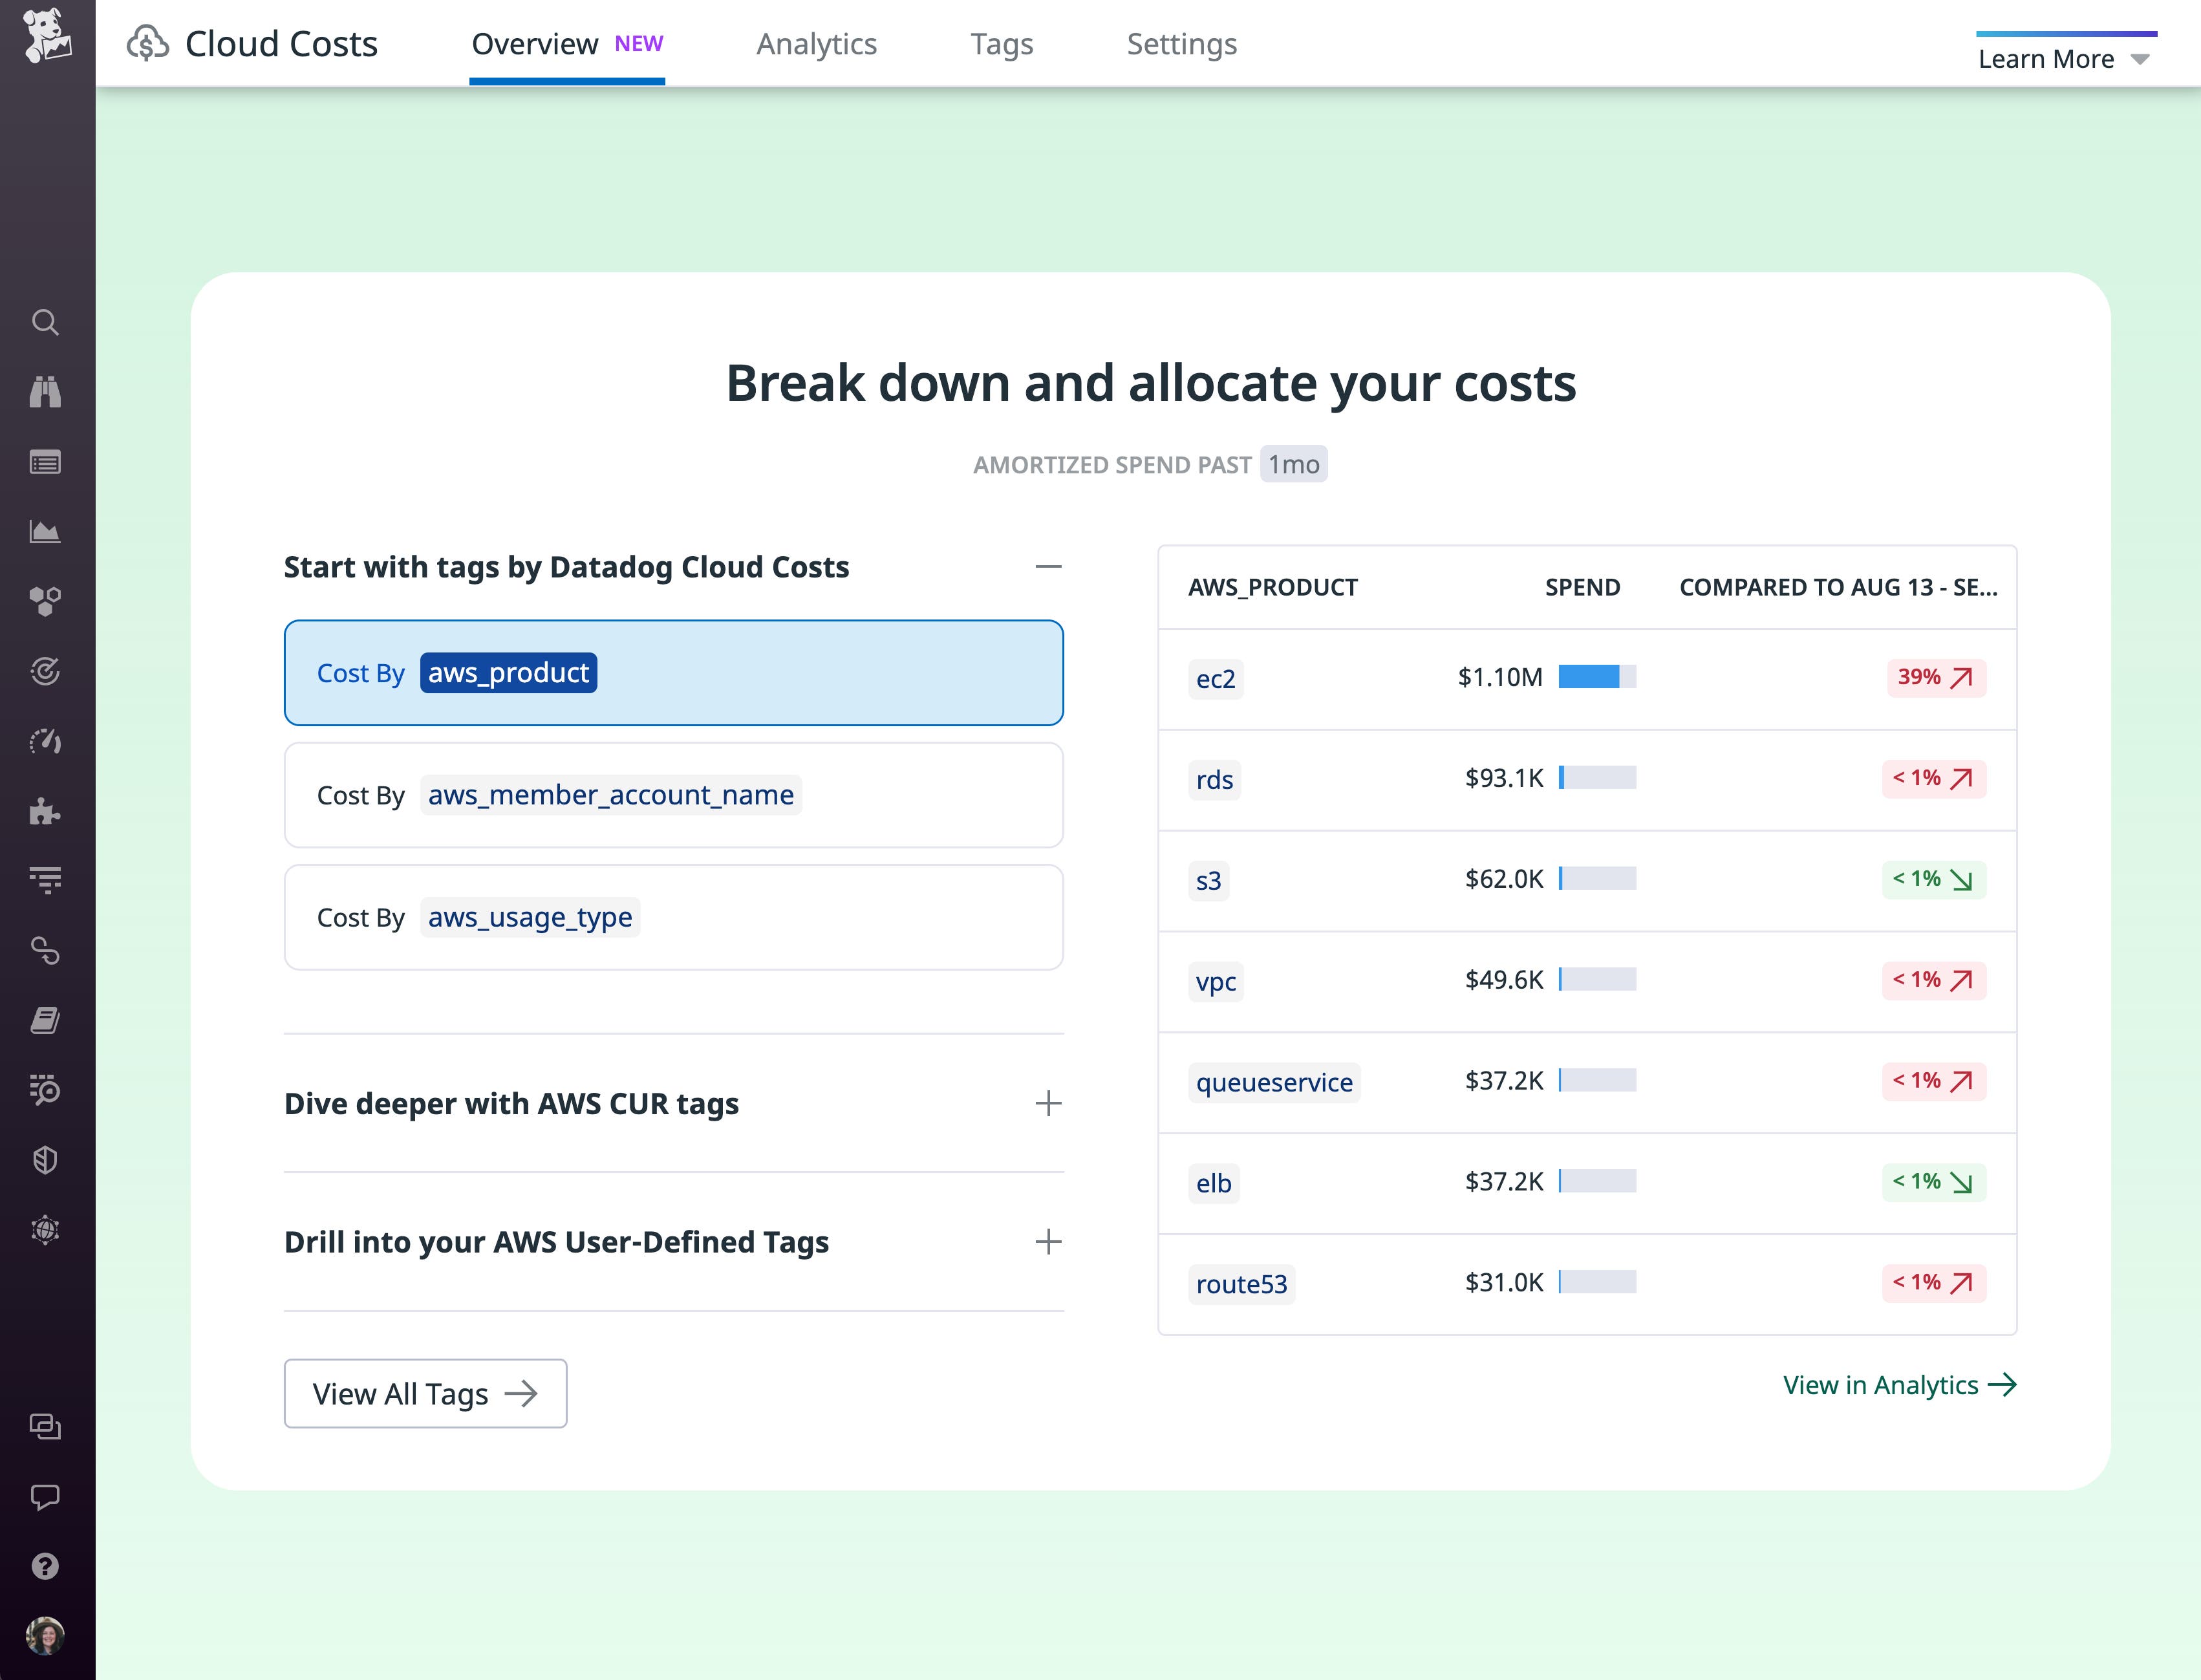
Cloud Cost Management
As your organization’s investment in cloud services continues to grow, it’s critical to maintain visibility into the changing costs that make up your cloud spend. We’re thrilled to introduce Datadog Cloud Cost Management to give engineers and cost managers a clear understanding of the factors contributing to the changes in your organization’s cloud costs. Cloud Cost Management allows stakeholders to analyze cost data alongside infrastructure and application telemetry, and it also shows them how each team, service, and application contributes to overall cloud spend. Now, engineering teams can quickly see how their work affects cloud costs, which empowers them to optimize the cost efficiency of their services and adopt a culture of cost awareness. And cost managers can see the root cause of changes in your organization’s cloud bill and implement effective strategies to reduce future costs. Learn more in our blog post.
CoScreen
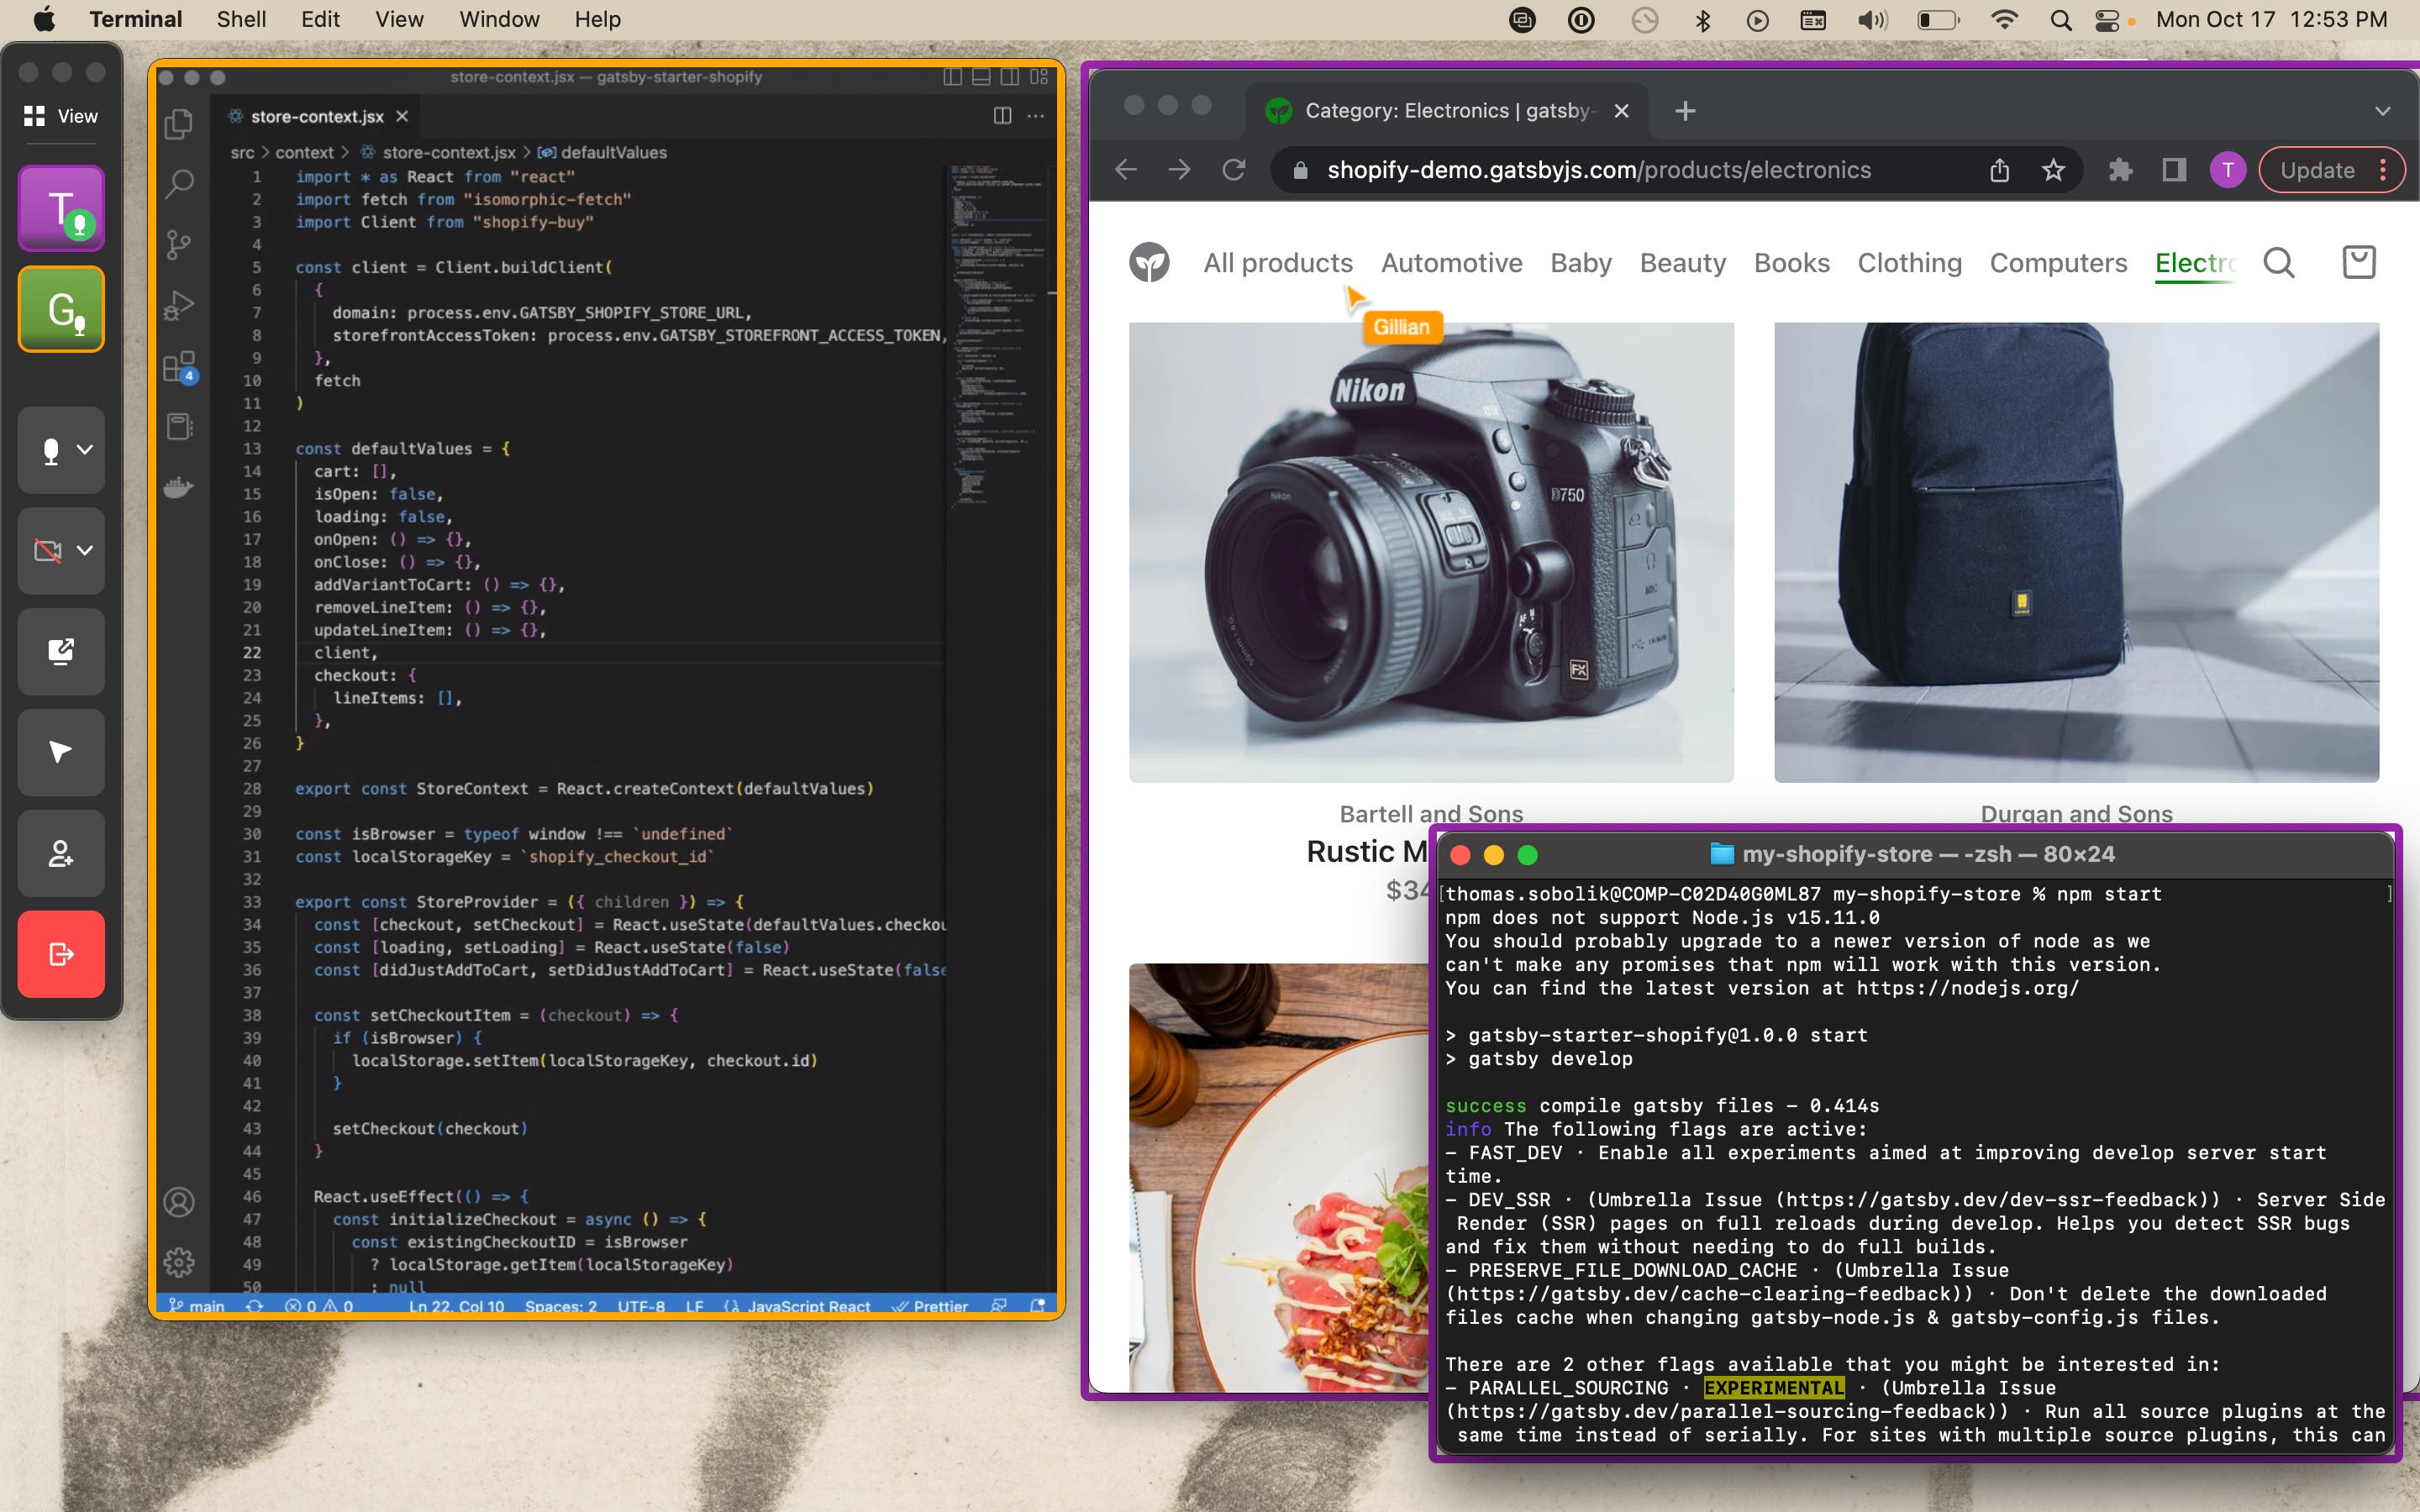
With modern engineering and operations teams more distributed than ever before, it’s paramount for organizations to adopt collaboration tools that facilitate efficient, meaningful coworking in real time. Datadog is launching CoScreen, a remote collaboration tool that enables users to seamlessly merge their work environments by creating virtual meetings that use voice and video chat and interactive screen sharing. By enabling engineering and DevOps teams to share and interact with each other’s application windows simultaneously, CoScreen meetings reduce unnecessary back-and-forth—streamlining debugging, technical onboarding, incident response, and more. CoScreen also works with Datadog Incident Management, so team members can easily create and launch CoScreen meetings from the Incidents page, as well as Slack and Google Calendar. To get started with CoScreen, sign up via our website.
Data Streams Monitoring
In event-driven pipelines, queuing and streaming technologies such as Kafka and RabbitMQ are essential to the successful operation of your systems. However, ensuring that messages are being reliably and quickly conveyed between services is difficult due to the many technologies and teams involved in any such environment. Datadog Data Streams Monitoring provides a standardized method for your teams to measure pipeline health and end-to-end latencies for events traversing across your system. The deep visibility offered by Data Streams Monitoring enables you to pinpoint faulty producers, consumers, or queues driving delays and lag in the pipeline; discover hard-to-debug pipeline issues such as blocked messages, hot partitions, or offline consumers; and collaborate seamlessly across relevant infrastructure or app teams. To easily manage your pipelines at scale, you can request access to Data Streams Monitoring in Preview.
Integrations momentum
A fundamental part of Datadog is providing all of your teams deep visibility into every layer of your environment, regardless of your specific business or use case. With over 1,000 integrations, you can use Datadog to collect, visualize, and alert on key metrics, logs, and other telemetry from your entire stack into a unified platform. In the past year, we have released over 70 new integrations with third-party applications, databases, developer tools, security services, and more. These include integrations with Apache Pulsar, ArangoDB, Confluent Cloud, JumpCloud, Oracle WebLogic, Redis Enterprise, Salesforce Commerce Cloud, Vercel, and many others. See our documentation to learn more.
Shift left
Continuous Testing
Testing early in the development cycle is essential for improving application performance and creating a smooth user experience. If your test automation tools aren’t effectively integrated with the rest of your system, however, establishing and maintaining this type of “shift-left” testing can be time-consuming work. Datadog Continuous Testing solves this issue by giving your team codeless, quick, and reliable testing that allows you to test more effectively and catch critical issues within your pipelines. Our Codeless Web Recorder and parallel, cross-browser tests help you create a comprehensive set of user workflows and scenarios that you can verify with minimal effort. You can also use self-healing browser tests and automatic test retries to prevent false positives, reducing alert fatigue. When your tests do surface important issues, a variety of integrations—including ones for CircleCI, Azure DevOps, and Datadog APM—give you context to help you resolve those problems quickly. Learn more with our blog post.
Intelligent Test Runner
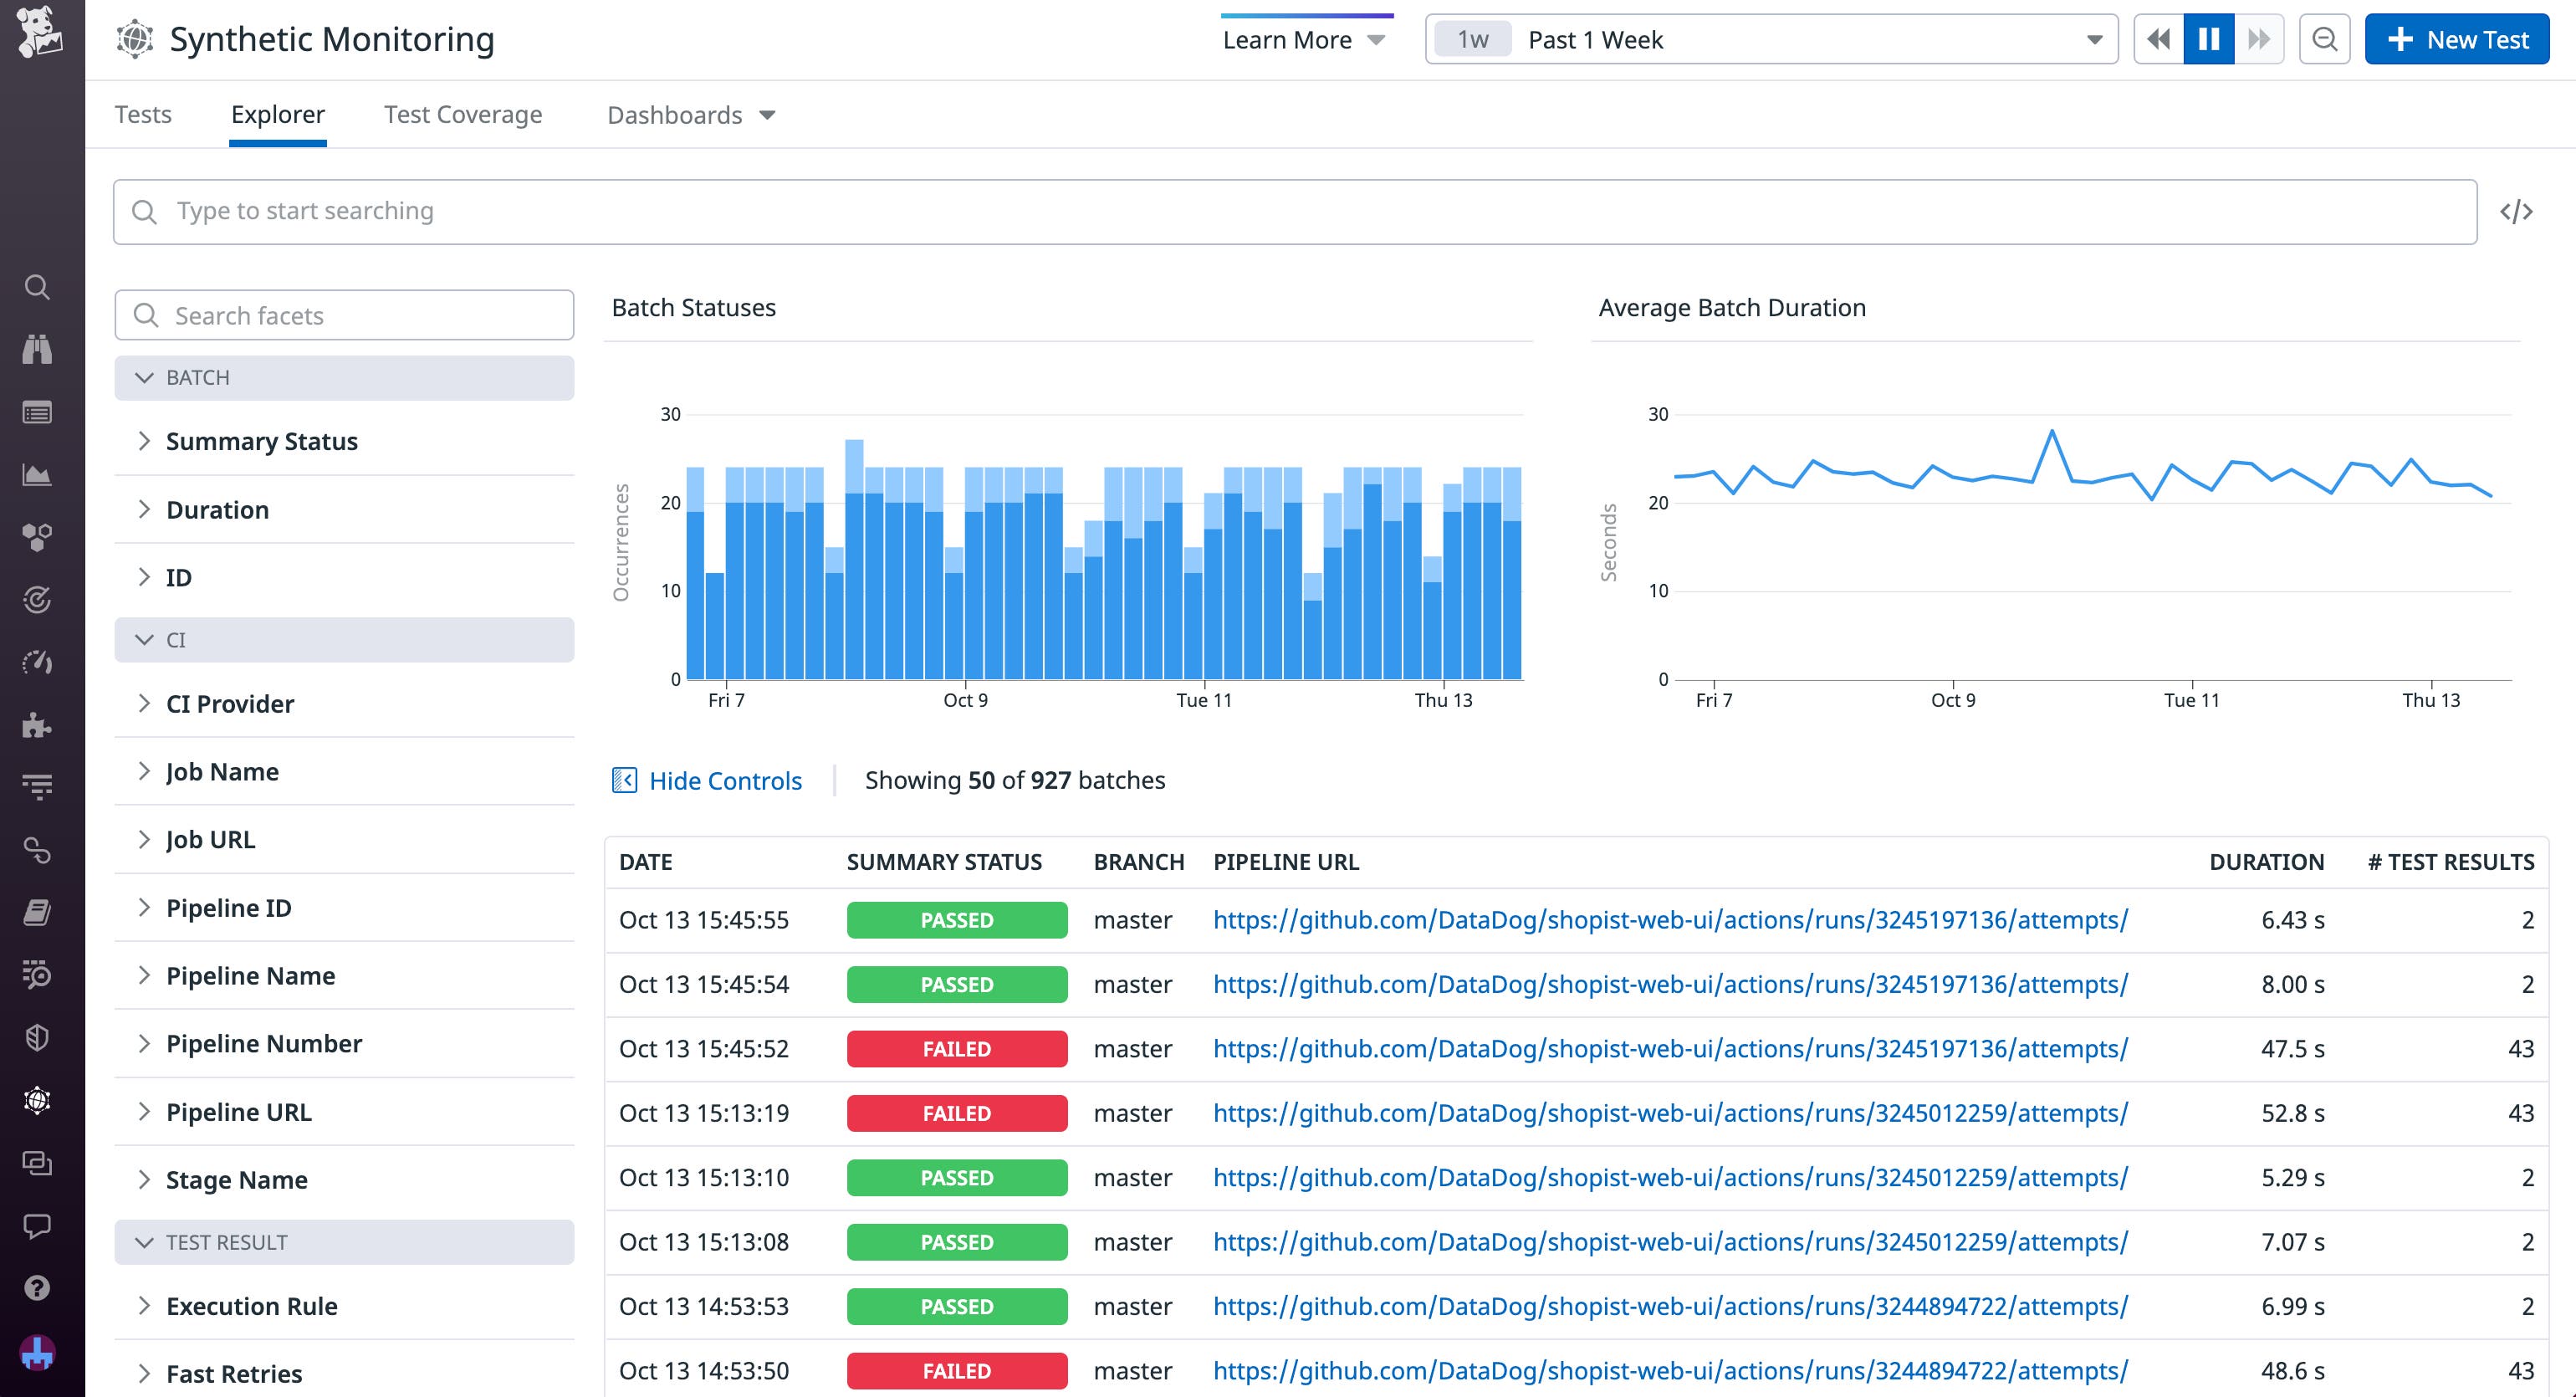
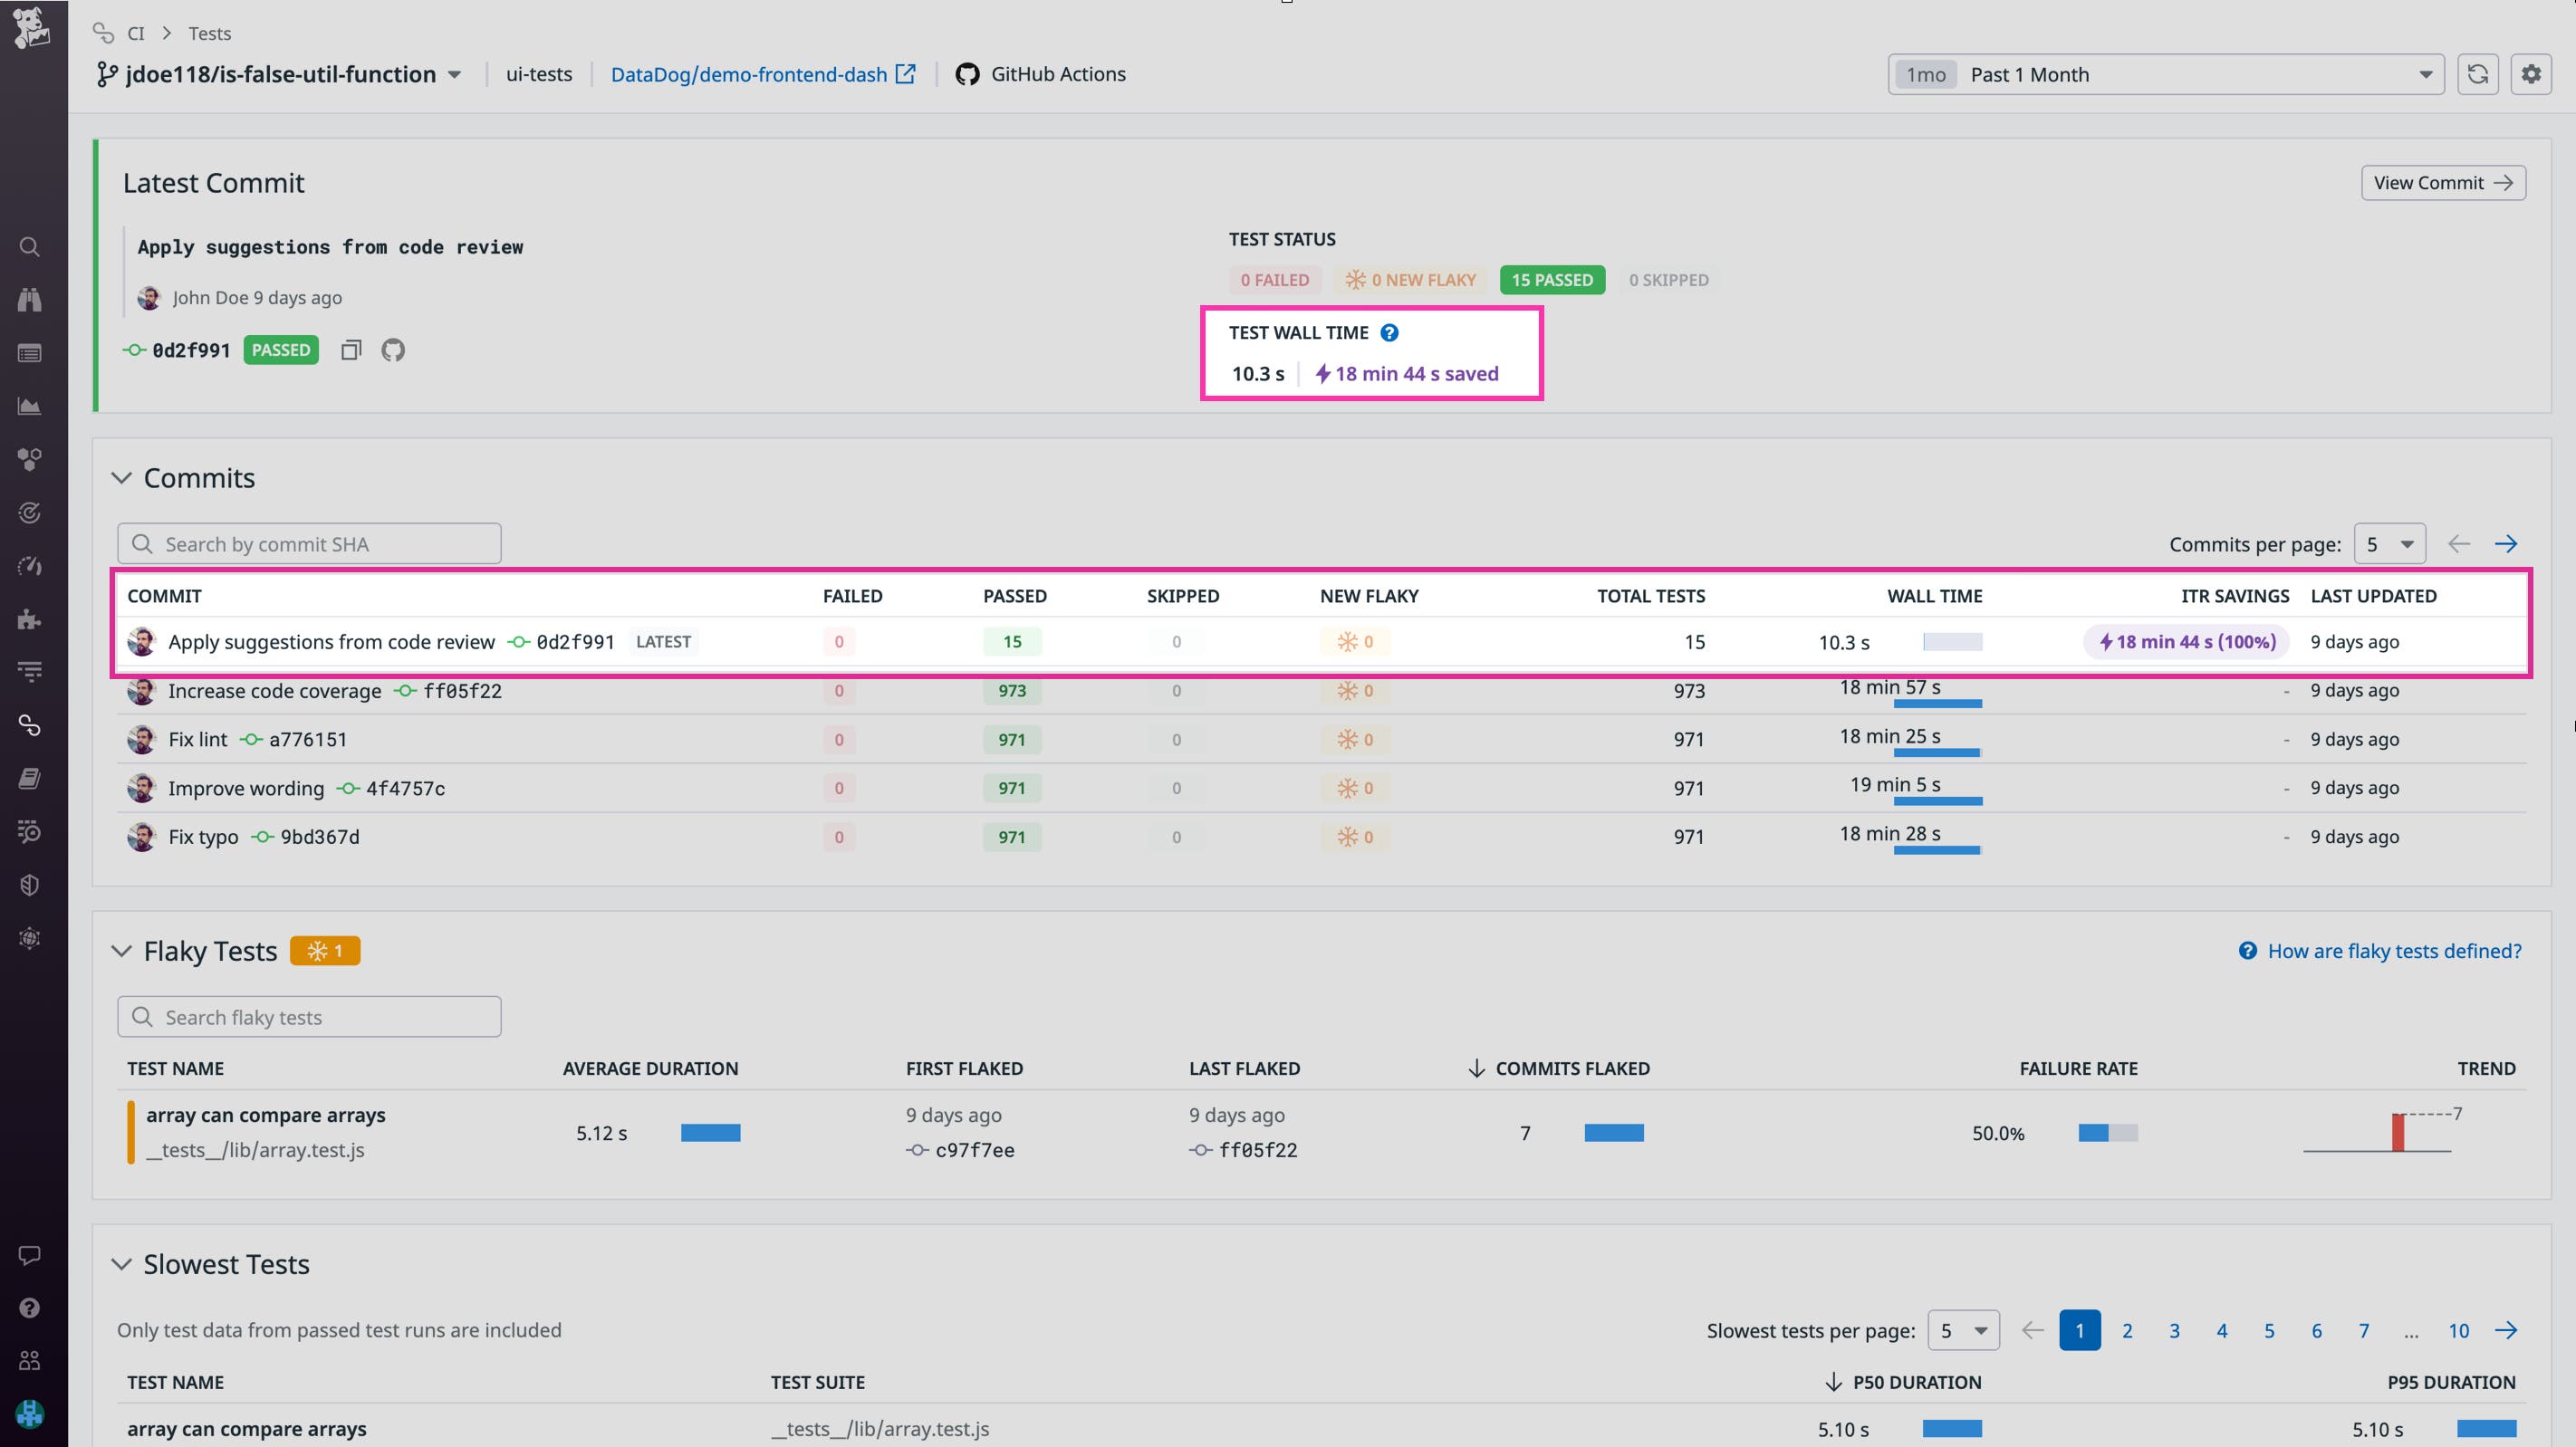
As your codebase grows, testing new code deployments with continuous integration (CI) can become a lengthy and potentially brittle process. Datadog Intelligent Test Runner (ITR) automatically selects and runs only the tests affected by the code changed in a deployment, enabling you to reduce testing downtime while maintaining the effectiveness of your test suite. By analyzing each test to determine the files impacted, ITR can cross-reference this coverage with the code altered in a commit to run only the relevant tests. Enabling ITR for your test services creates faster development cycles by reducing testing durations and also minimizes the risk of a flaky test that is outside the scope of your code change breaking your build. You can then visualize your resource savings across your commits and services in familiar CI Visibility pages and workflows. To learn more about ITR, check out our blog post.
Cloud and application security
Cloud Security Management
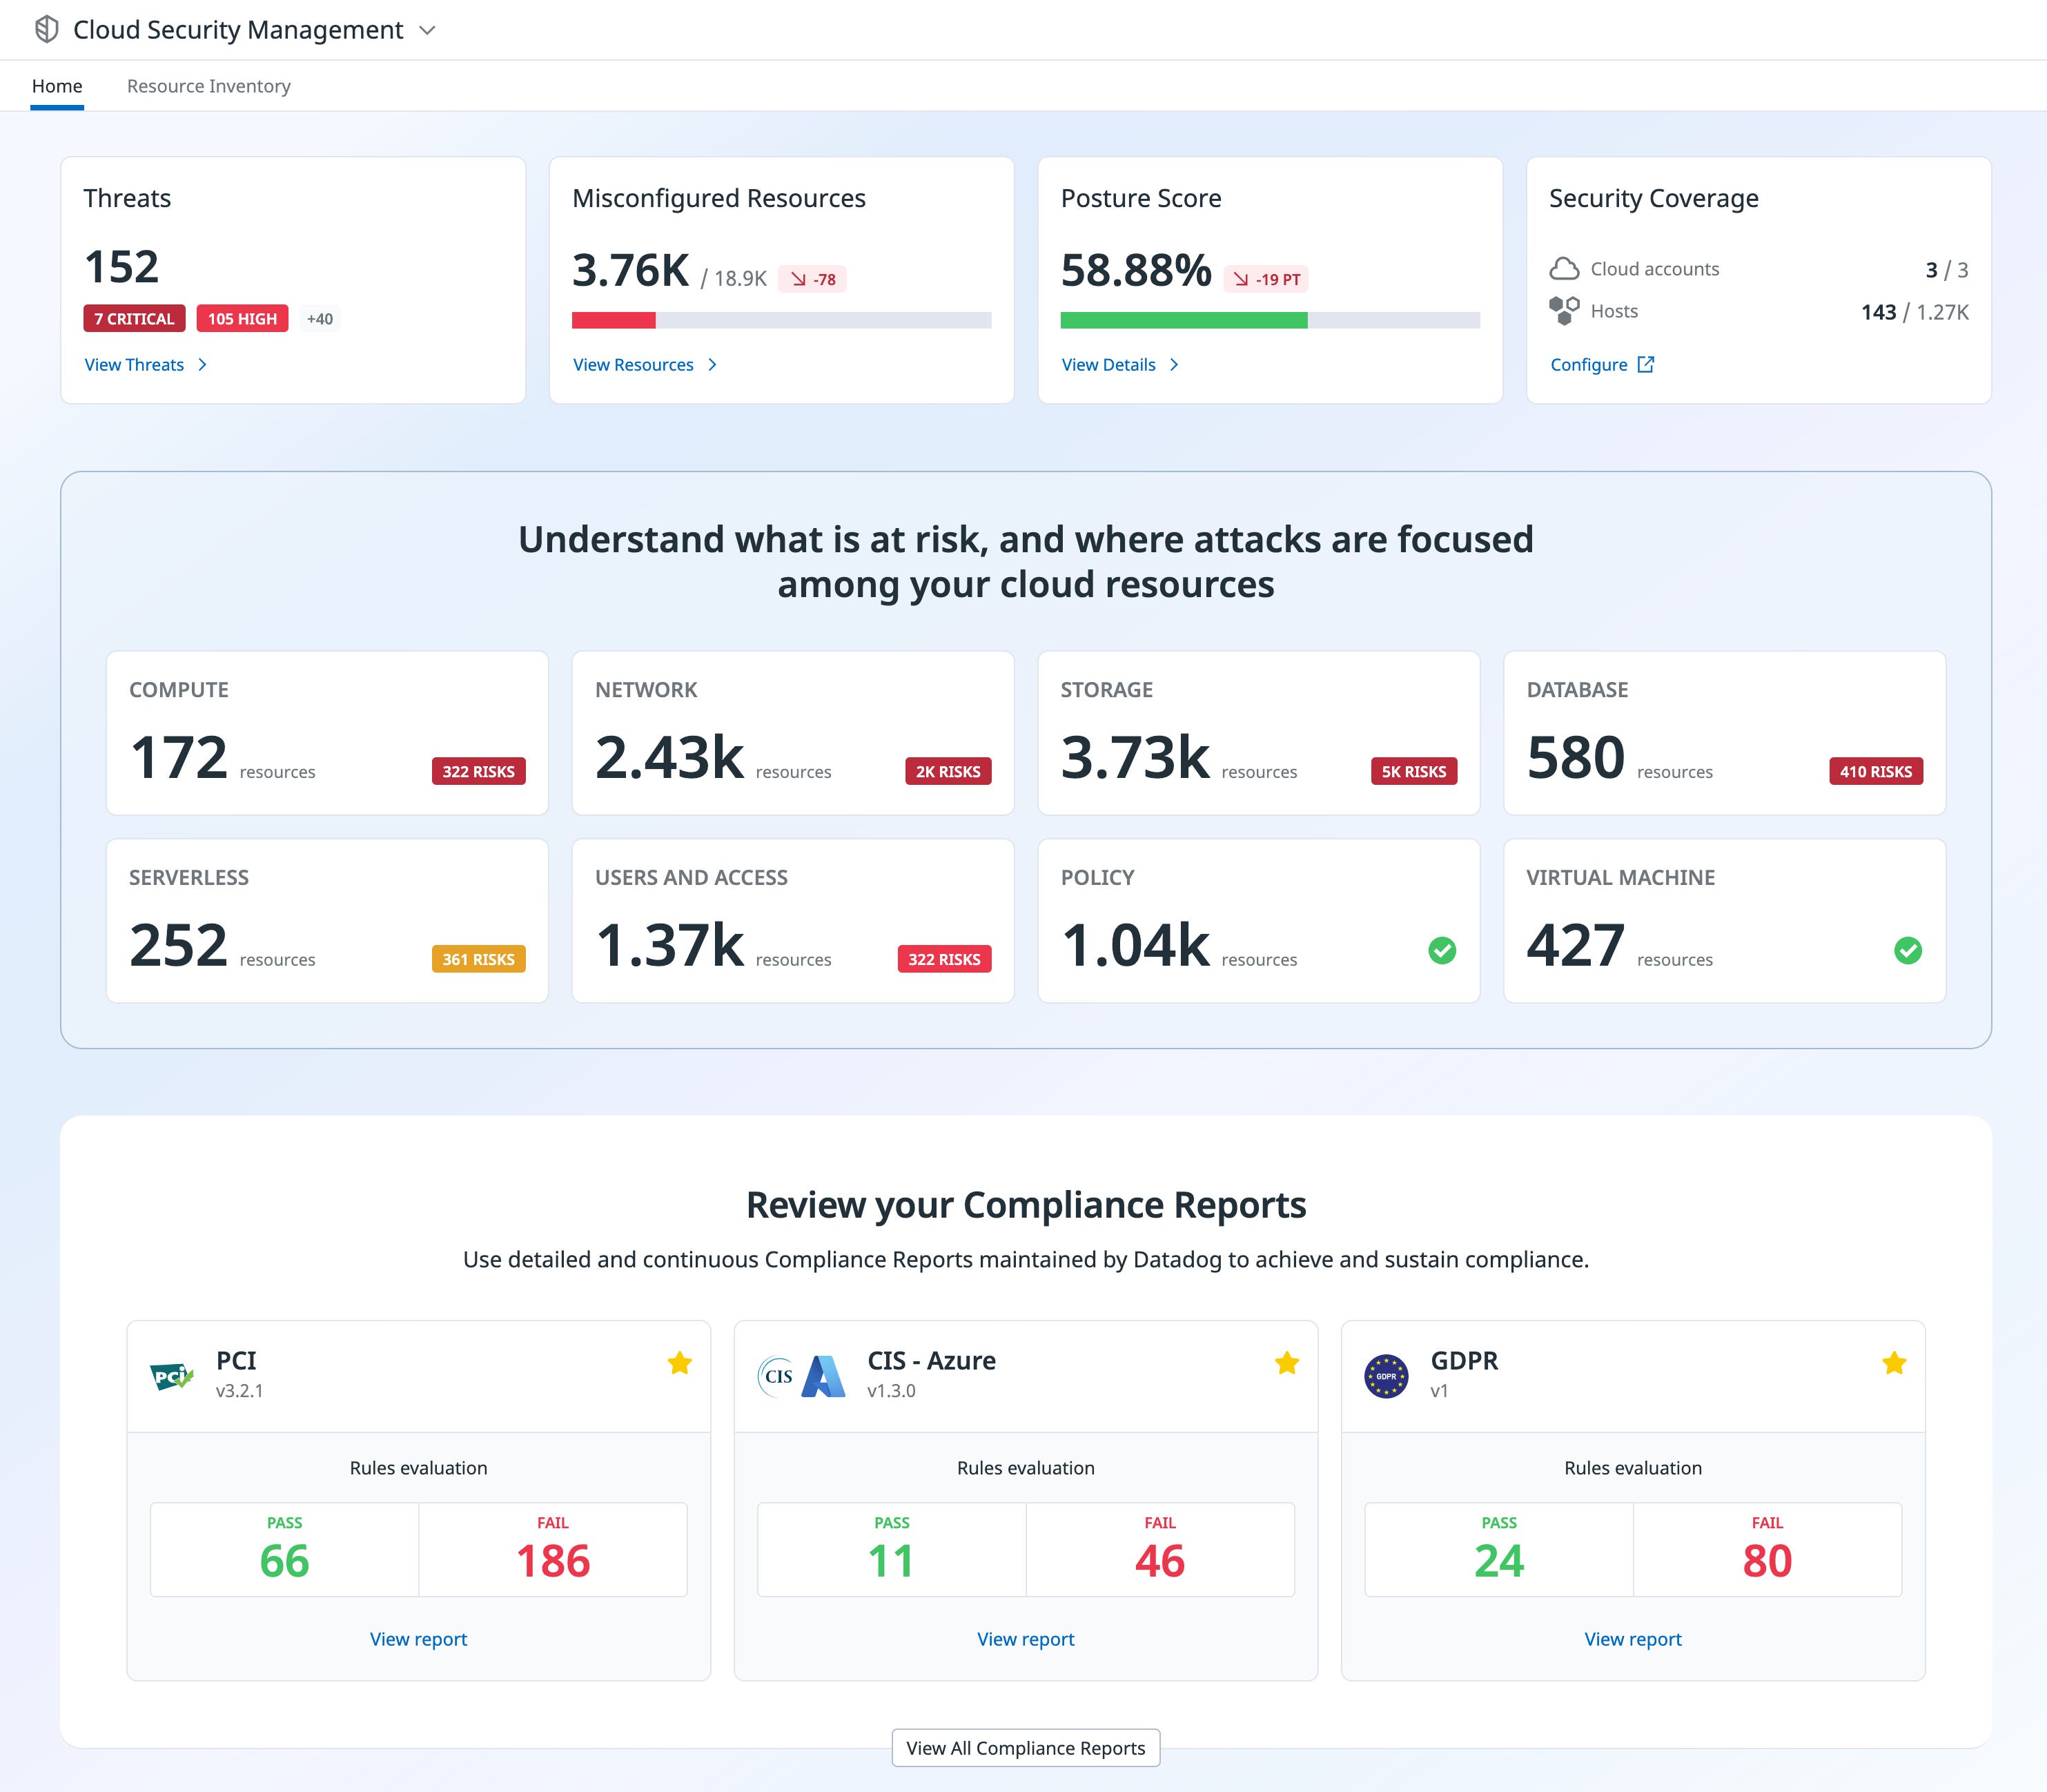
Cyber attacks are becoming more prevalent as organizations continue to migrate their applications to the cloud. But security solutions have historically been unable to keep up with the pace of cloud adoption, creating a disconnect between security teams and DevOps. Datadog Cloud Security Management and the Resource Catalog address this problem by providing a unified view of security risks across an organization’s entire cloud infrastructure. Now, executives have a concise snapshot of their environment, and security teams and DevOps can seamlessly collaborate on identifying, prioritizing, and remediating threats and misconfigurations.
For more information about Datadog Cloud Security Management, check out our dedicated blog post. To sign up for the beta of Resource Catalog, fill out this form.
Application Security Management protection
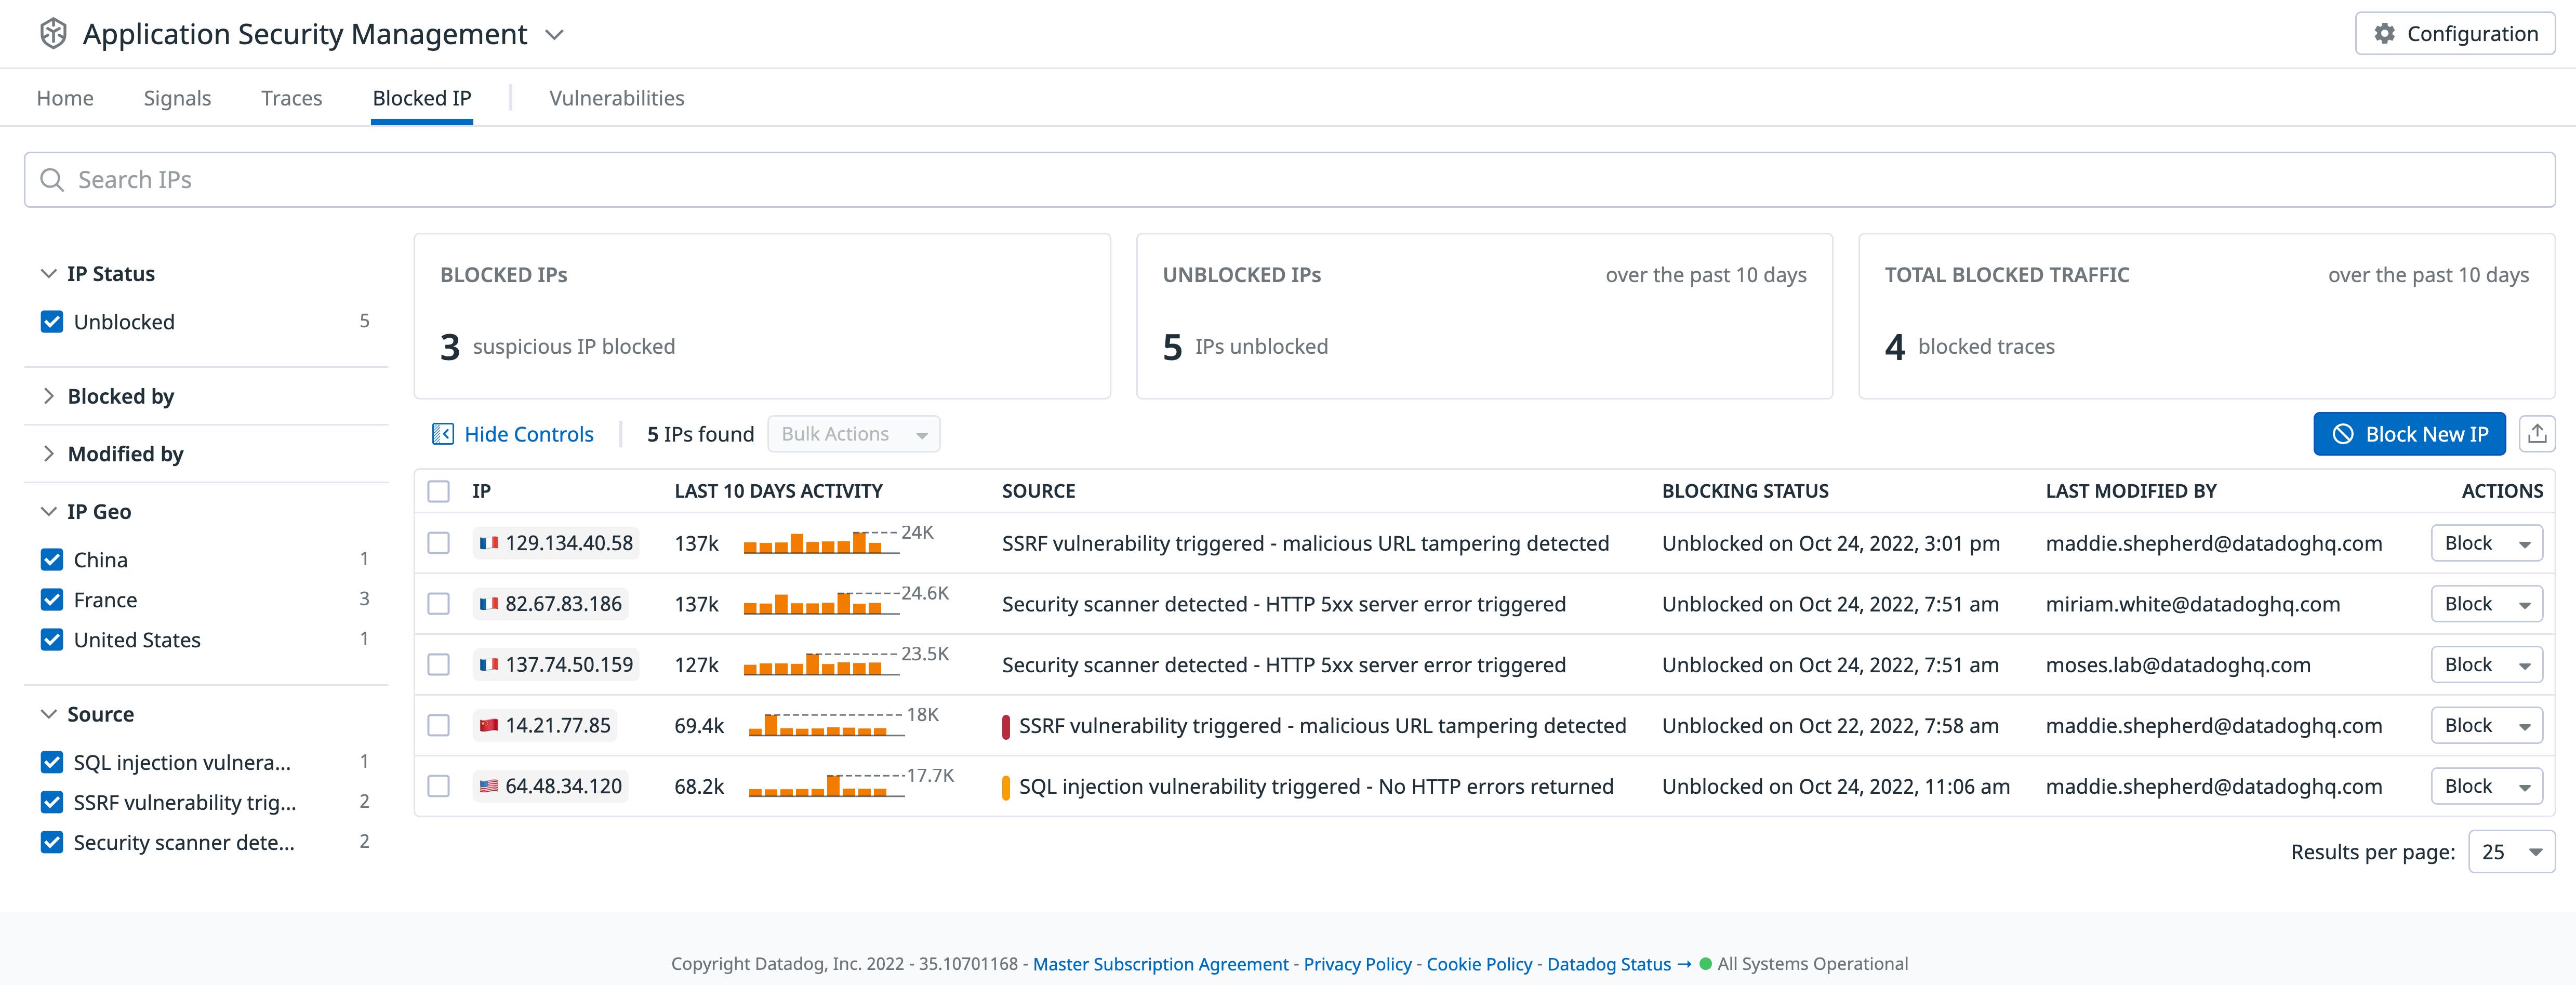
Earlier this year, we launched Datadog Application Security Management (ASM) to help you quickly detect and remediate attacks targeting your web applications and APIs. We’re excited to announce that we’ve expanded Datadog ASM to include native protection capabilities. You can now prevent attacks by blocking malicious IPs directly from Datadog and in one click. In addition, Datadog ASM also includes Vulnerability Monitoring, which automatically flags any code-level vulnerabilities introduced by your application’s open source library dependencies. Together, these new capabilities enable you to identify any service at risk, improve your security posture, and mitigate threats before they escalate.
To get started, you can read more about Datadog ASM, sign up to become a design partner, or start a 14-day free trial.
Cloud Security Posture Management for Google Cloud Platform
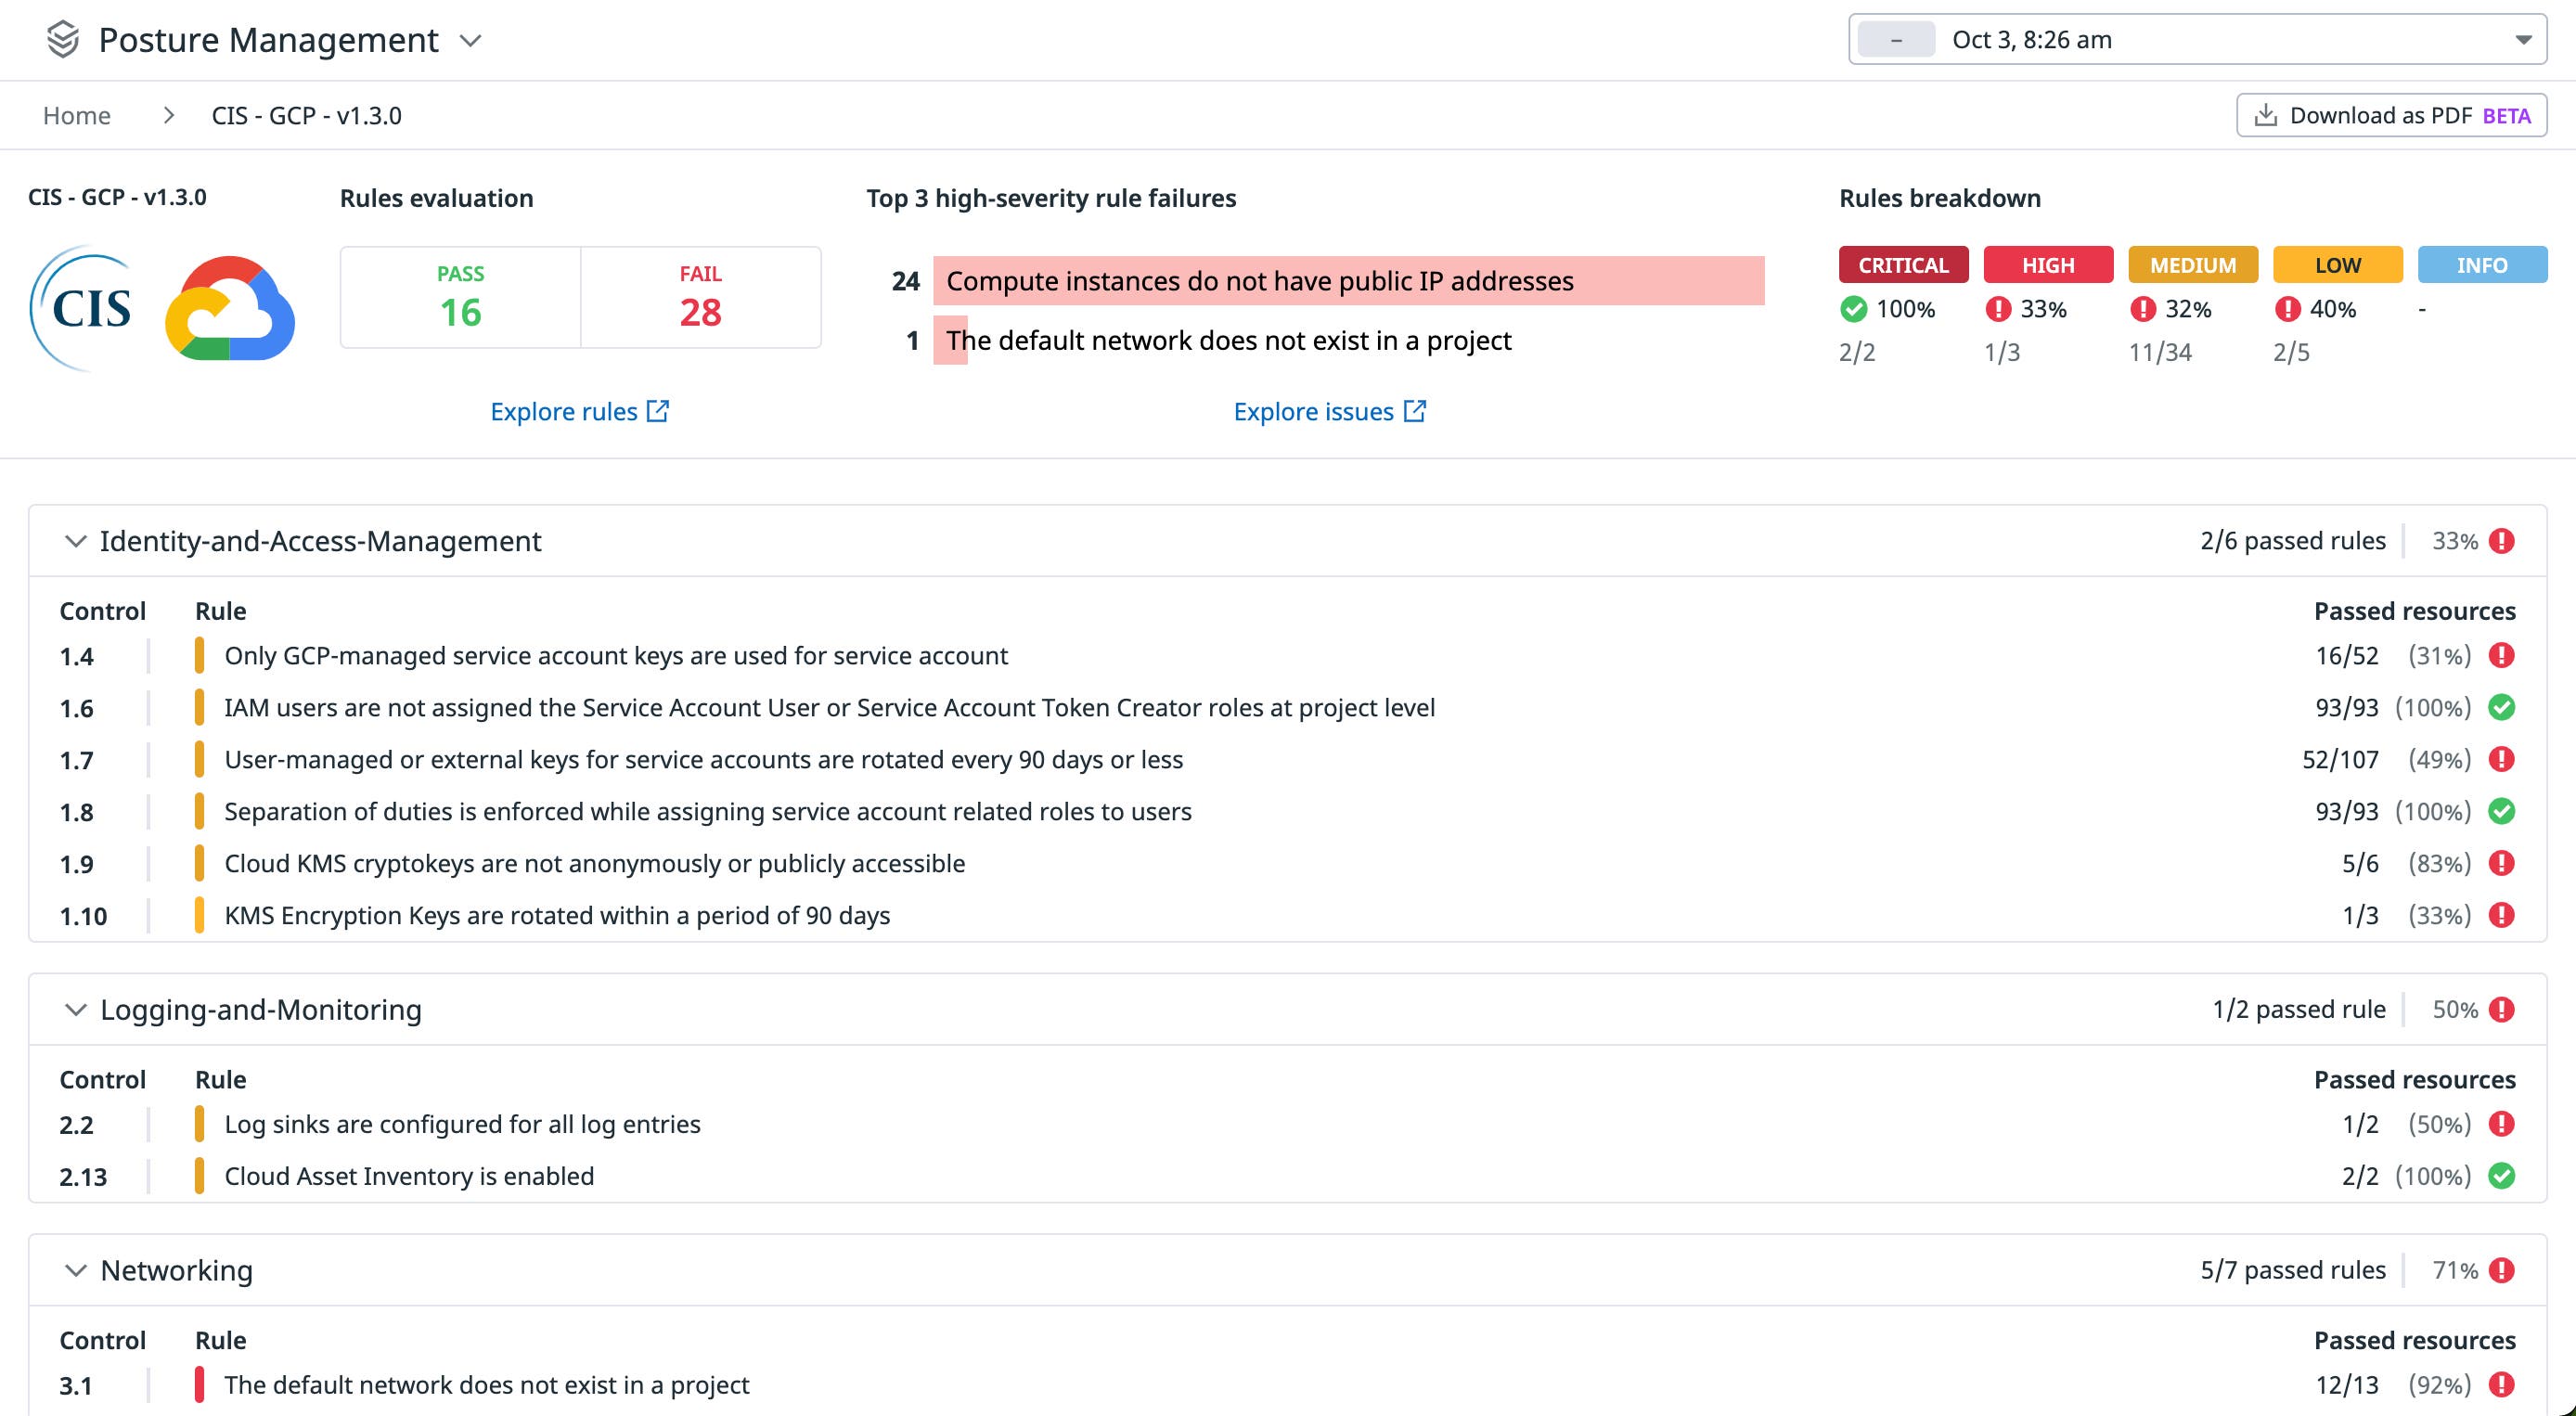
Organizations on Google Cloud Platform (GCP) are scaling their workloads at a rapid pace, which means that there are more resources for them to manage and protect. Without adequate visibility into their infrastructure, teams may overlook misconfigurations that could leave them vulnerable to an attack. Datadog Cloud Security Posture Management (CSPM) already surfaces potentially costly configuration issues, and we’re excited to announce that we’ve expanded our CSPM offering to GCP (in public beta). Now, organizations can leverage Datadog’s built-in compliance controls to verify that resources across all of their Google Cloud environments follow the latest regulatory best practices.
To learn how to efficiently mitigate risk and maintain compliance, check out our documentation.
Sensitive Data Scanner for APM and RUM
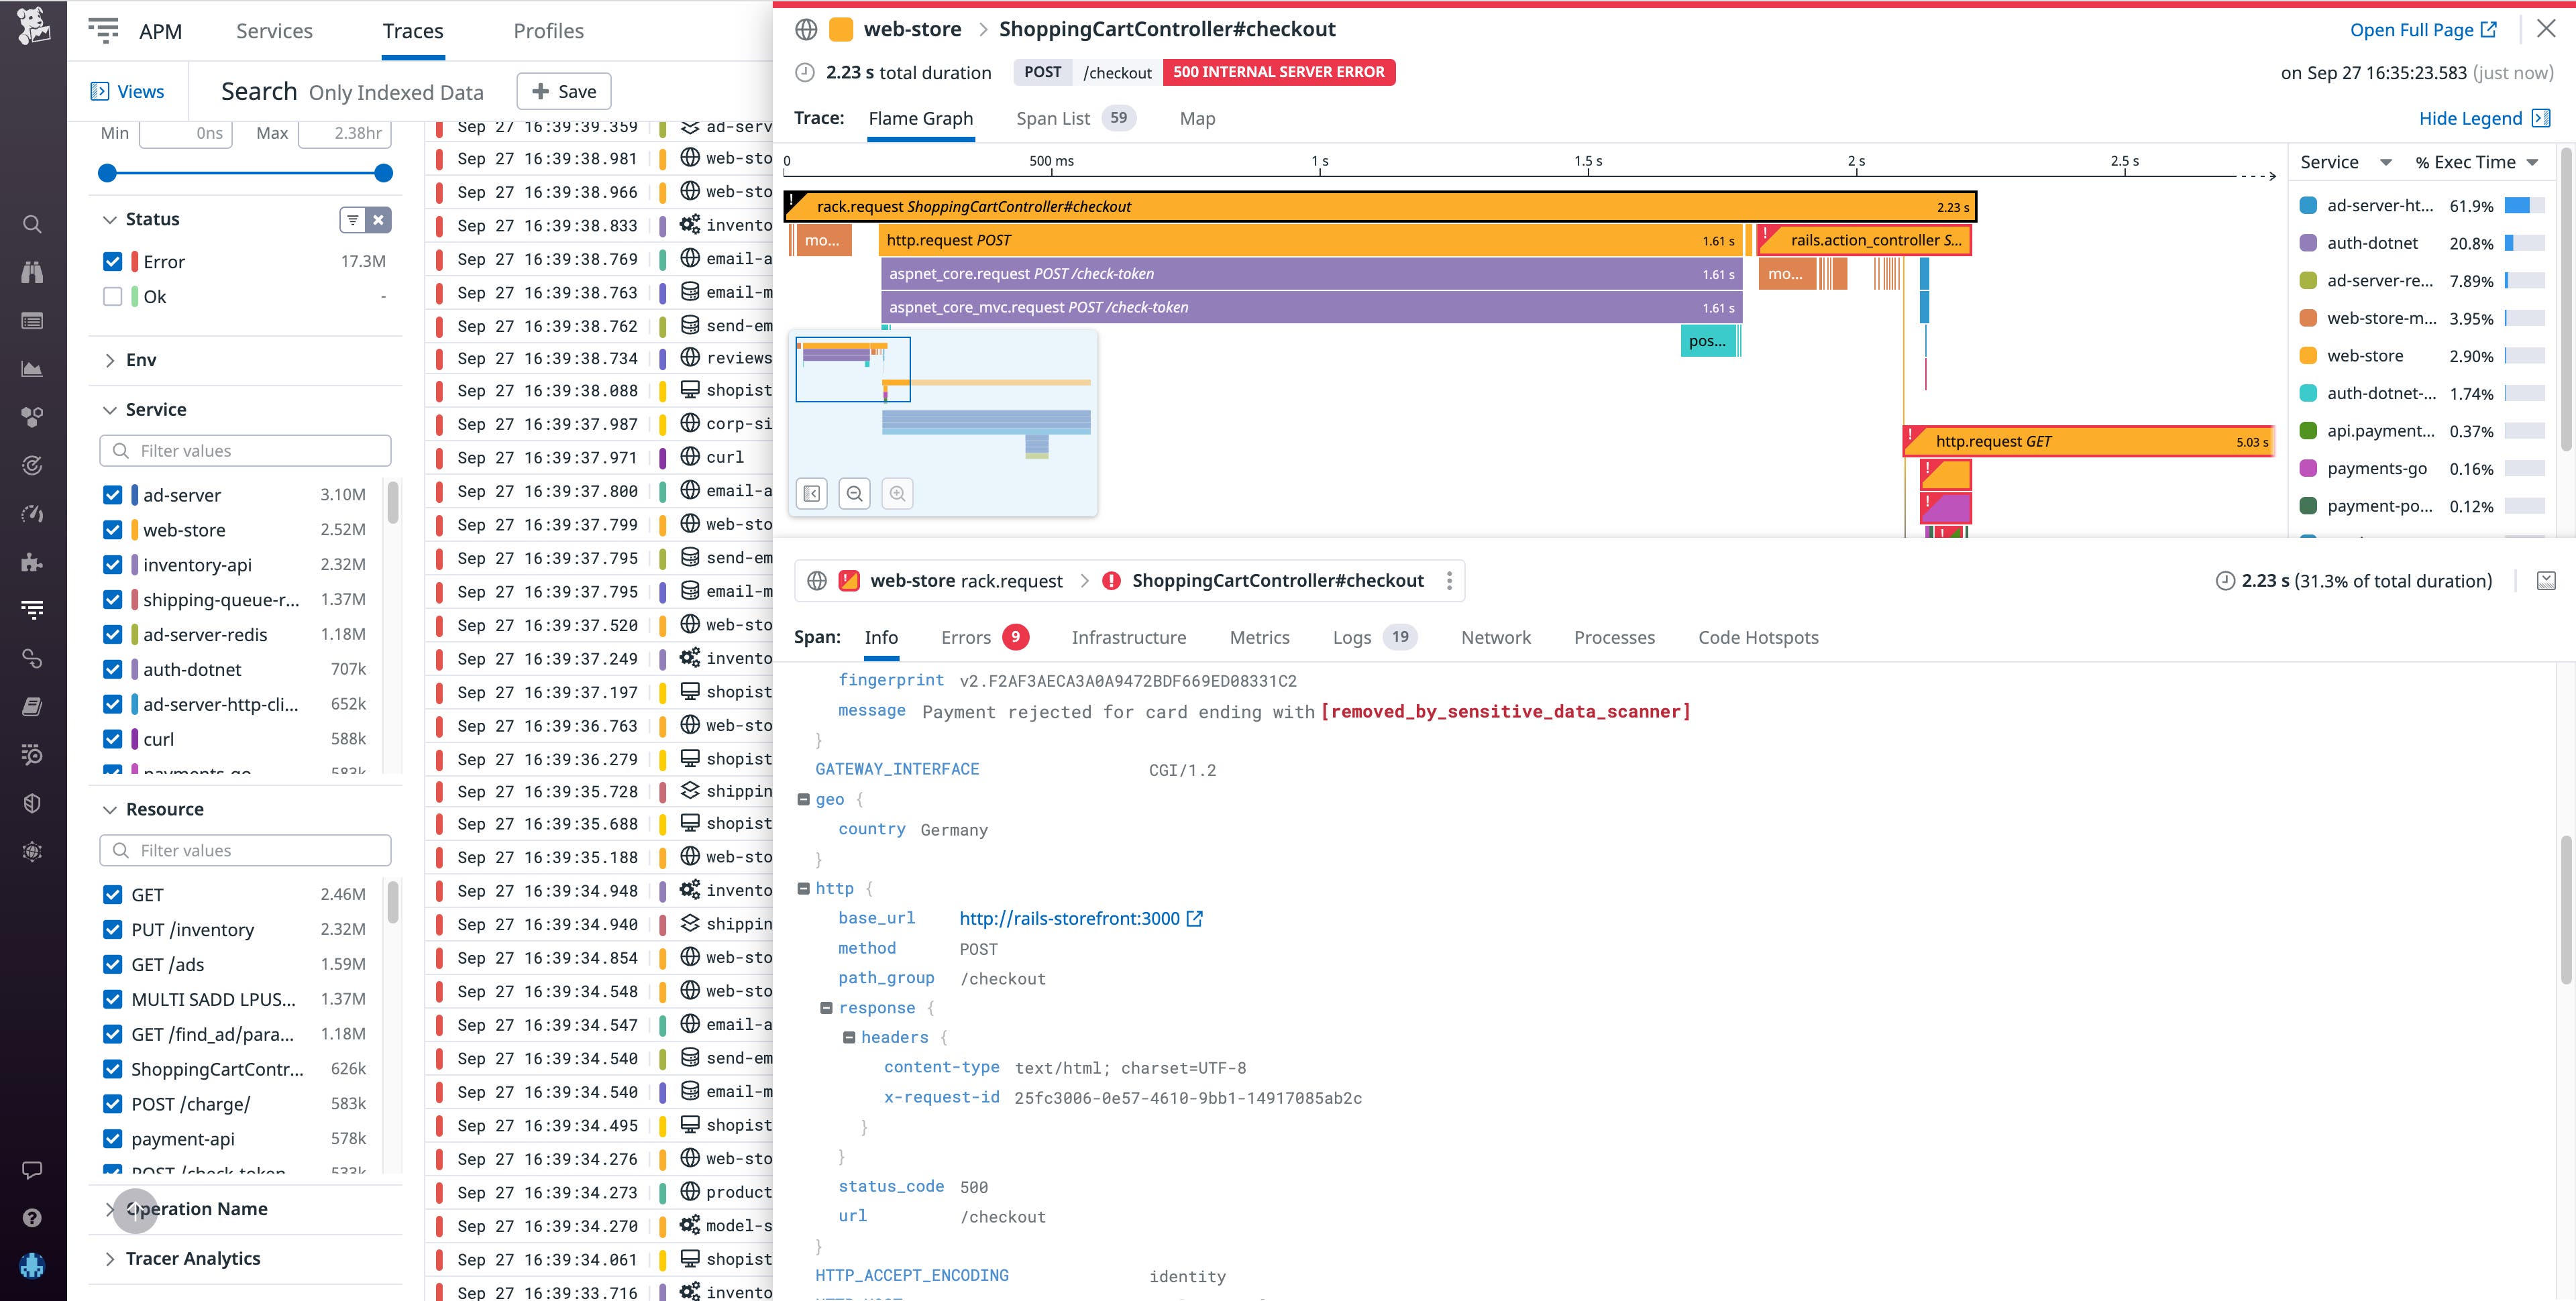
Customer-facing applications often request and process many types of sensitive data, such as API keys, credit card numbers, and email addresses. As your engineering organization and tech grows in size and complexity, it becomes harder to keep track of this sensitive data moving across more services, increasing your exposure to sensitive data leaks. Now, in addition to scanning logs in Log Management, Datadog’s Sensitive Data Scanner continuously scans your APM, RUM, and Events stream data at the time of ingestion in order to detect and then redact or hash sensitive information based on out-of-the-box or custom rules. This expanded capability helps you uphold the privacy of your customers and adhere to compliance regulations, as building out your own sensitive data management solution at the service level at scale would be time consuming and expensive.
Automation and taking action
Event Management
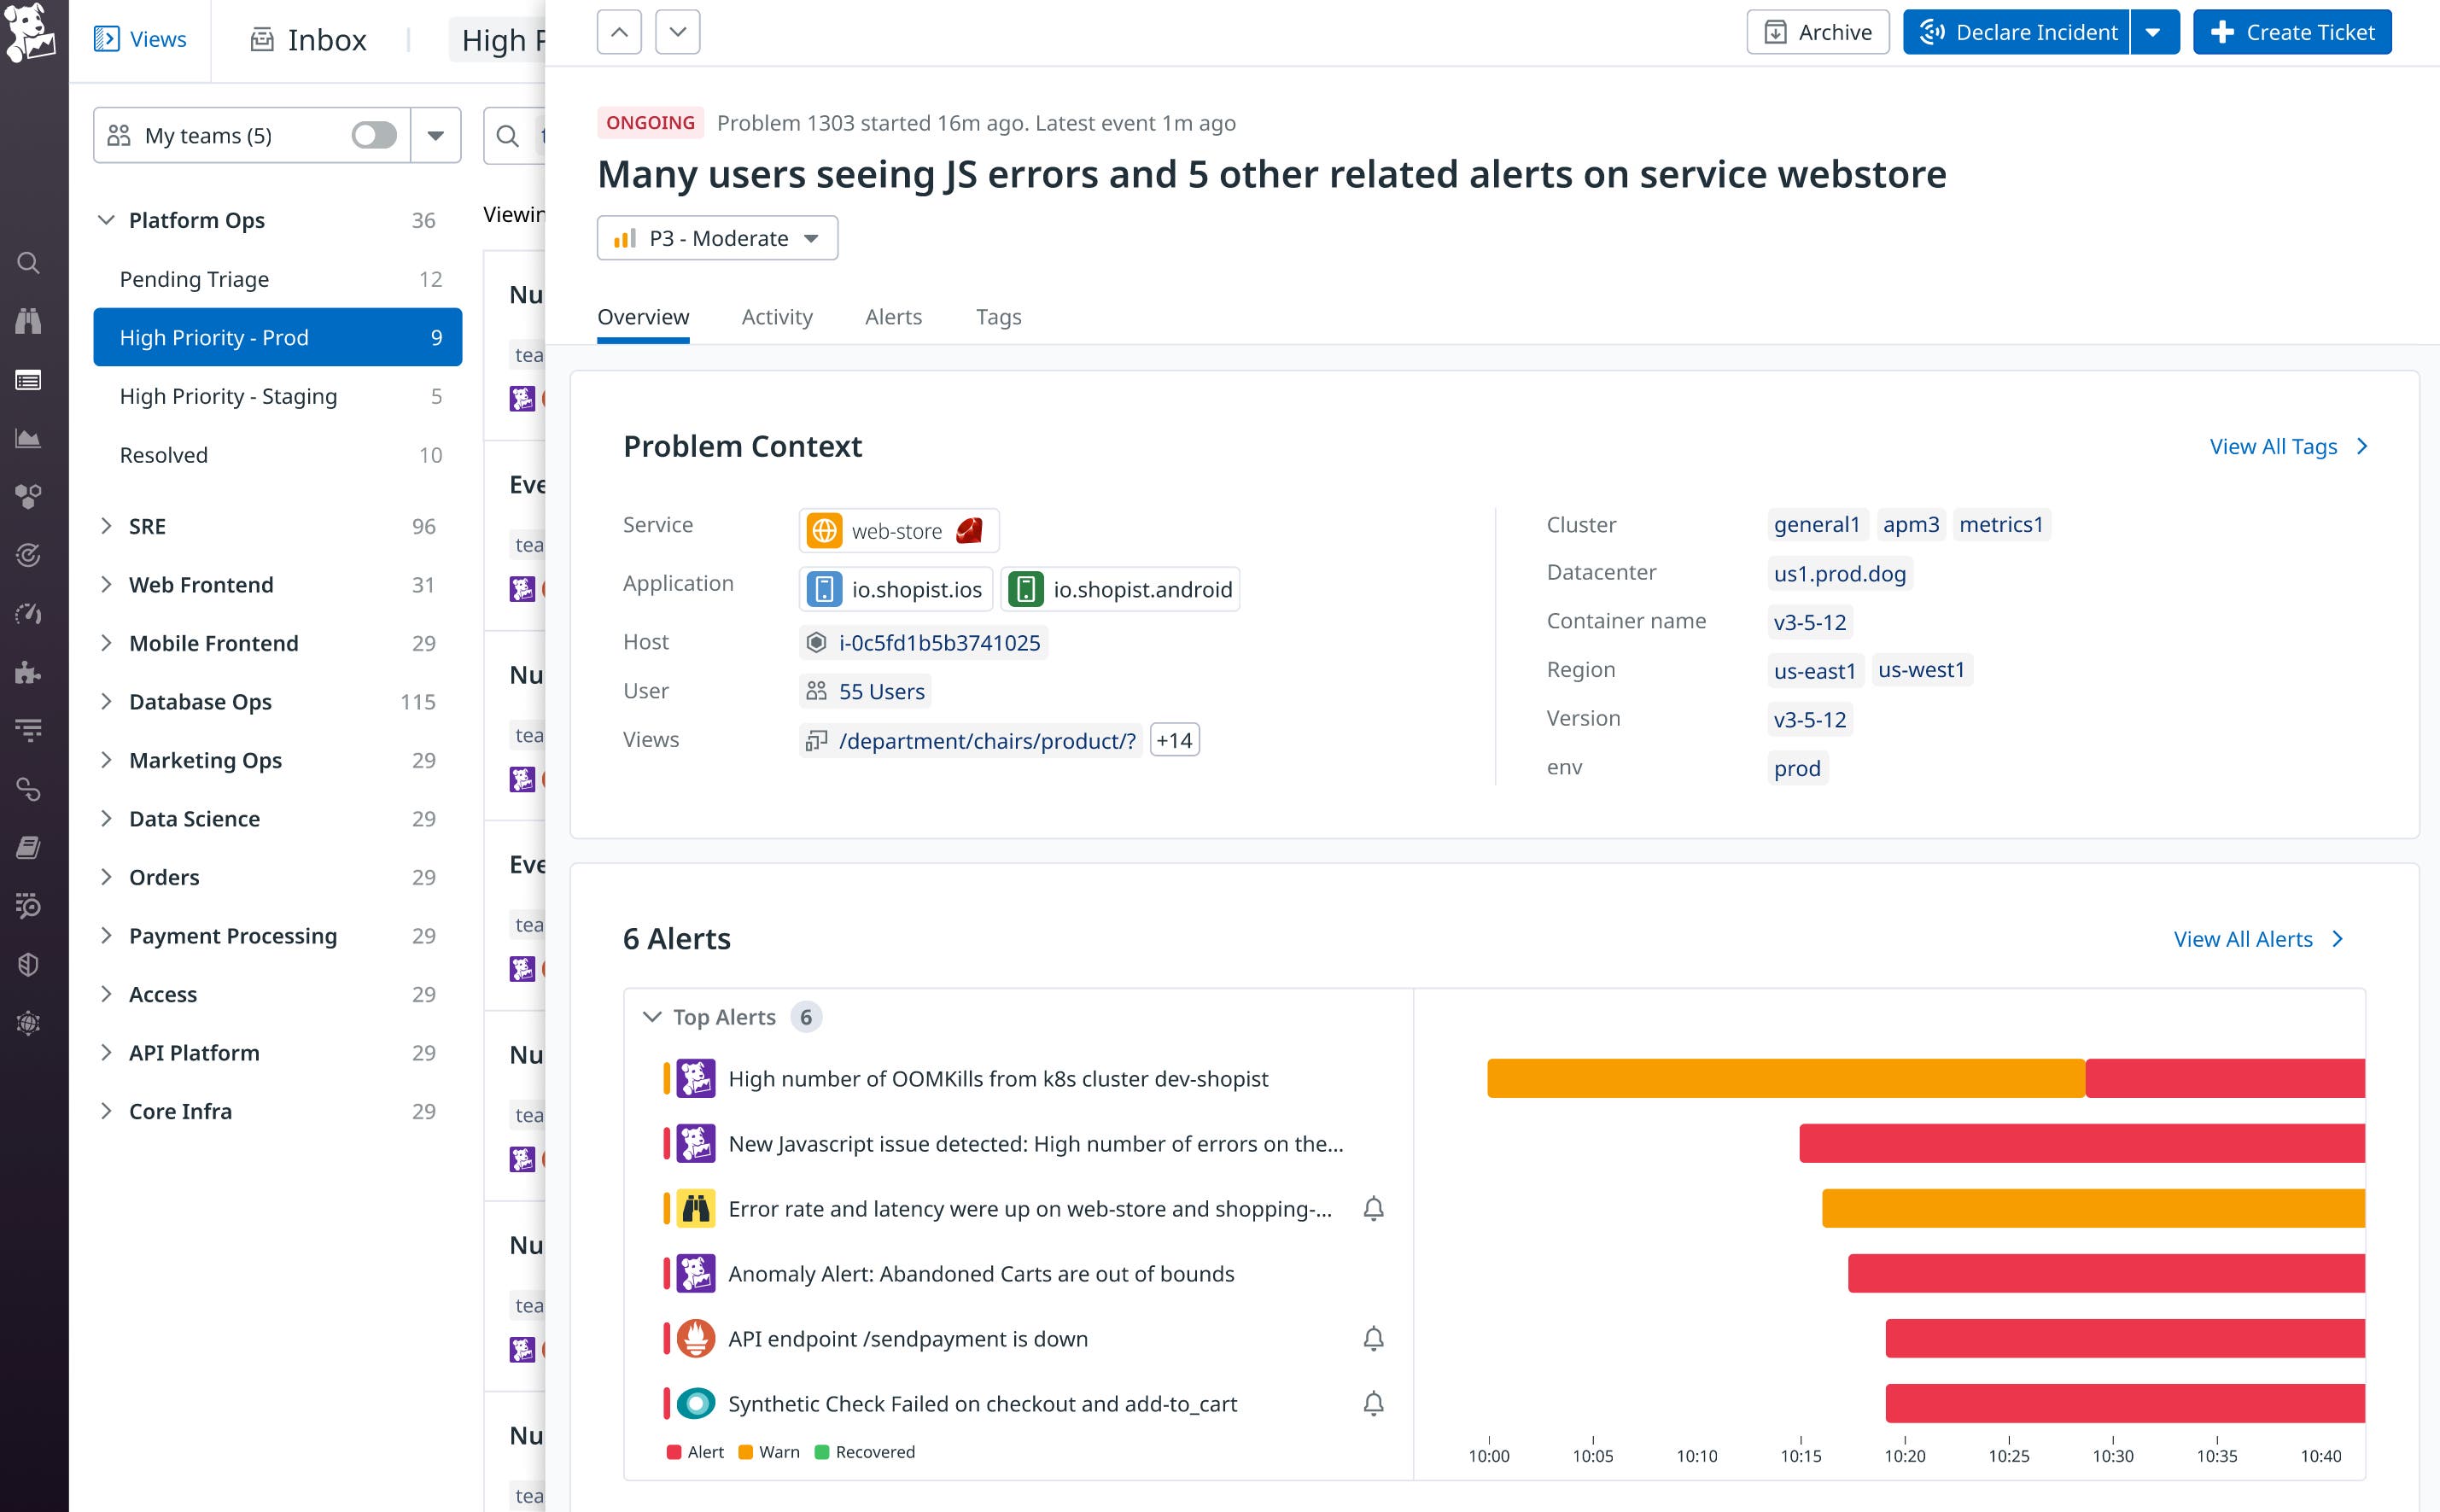
Event Management expands upon Datadog Events and Incident Management to correlate, contextualize, and prioritize events within a single, unified view. Events can be collected from data sources such as Datadog monitoring alerts, Watchdog surfaced signals, and other third-party sources through over 1,000 available integrations to provide your teams a complete view of a problem. Though events and alerts are essential for monitoring, the volume of incoming alerts and events can quickly become untenable as architectures grow in scale and complexity. Additionally, it can become difficult for teams to prioritize which notifications to respond to and which require immediate attention.
Event Management addresses these challenges by automatically tying together related events and alerts, which decreases the number of notifications you need to investigate and enables you to quickly spot root causes. For example, instead of needing to investigate alerts for a spike in OOMKilled errors and a spike in JavaScript errors separately, Event Management will detect that these alerts are related and group them into a single “problem” that you can investigate on one page. Event Management also integrates with platforms like Jira, ServiceNow, and Slack so you can quickly loop in teammates to escalate an investigation.
Event Management is currently in Preview. To request access, fill out this form.
Workflow automation
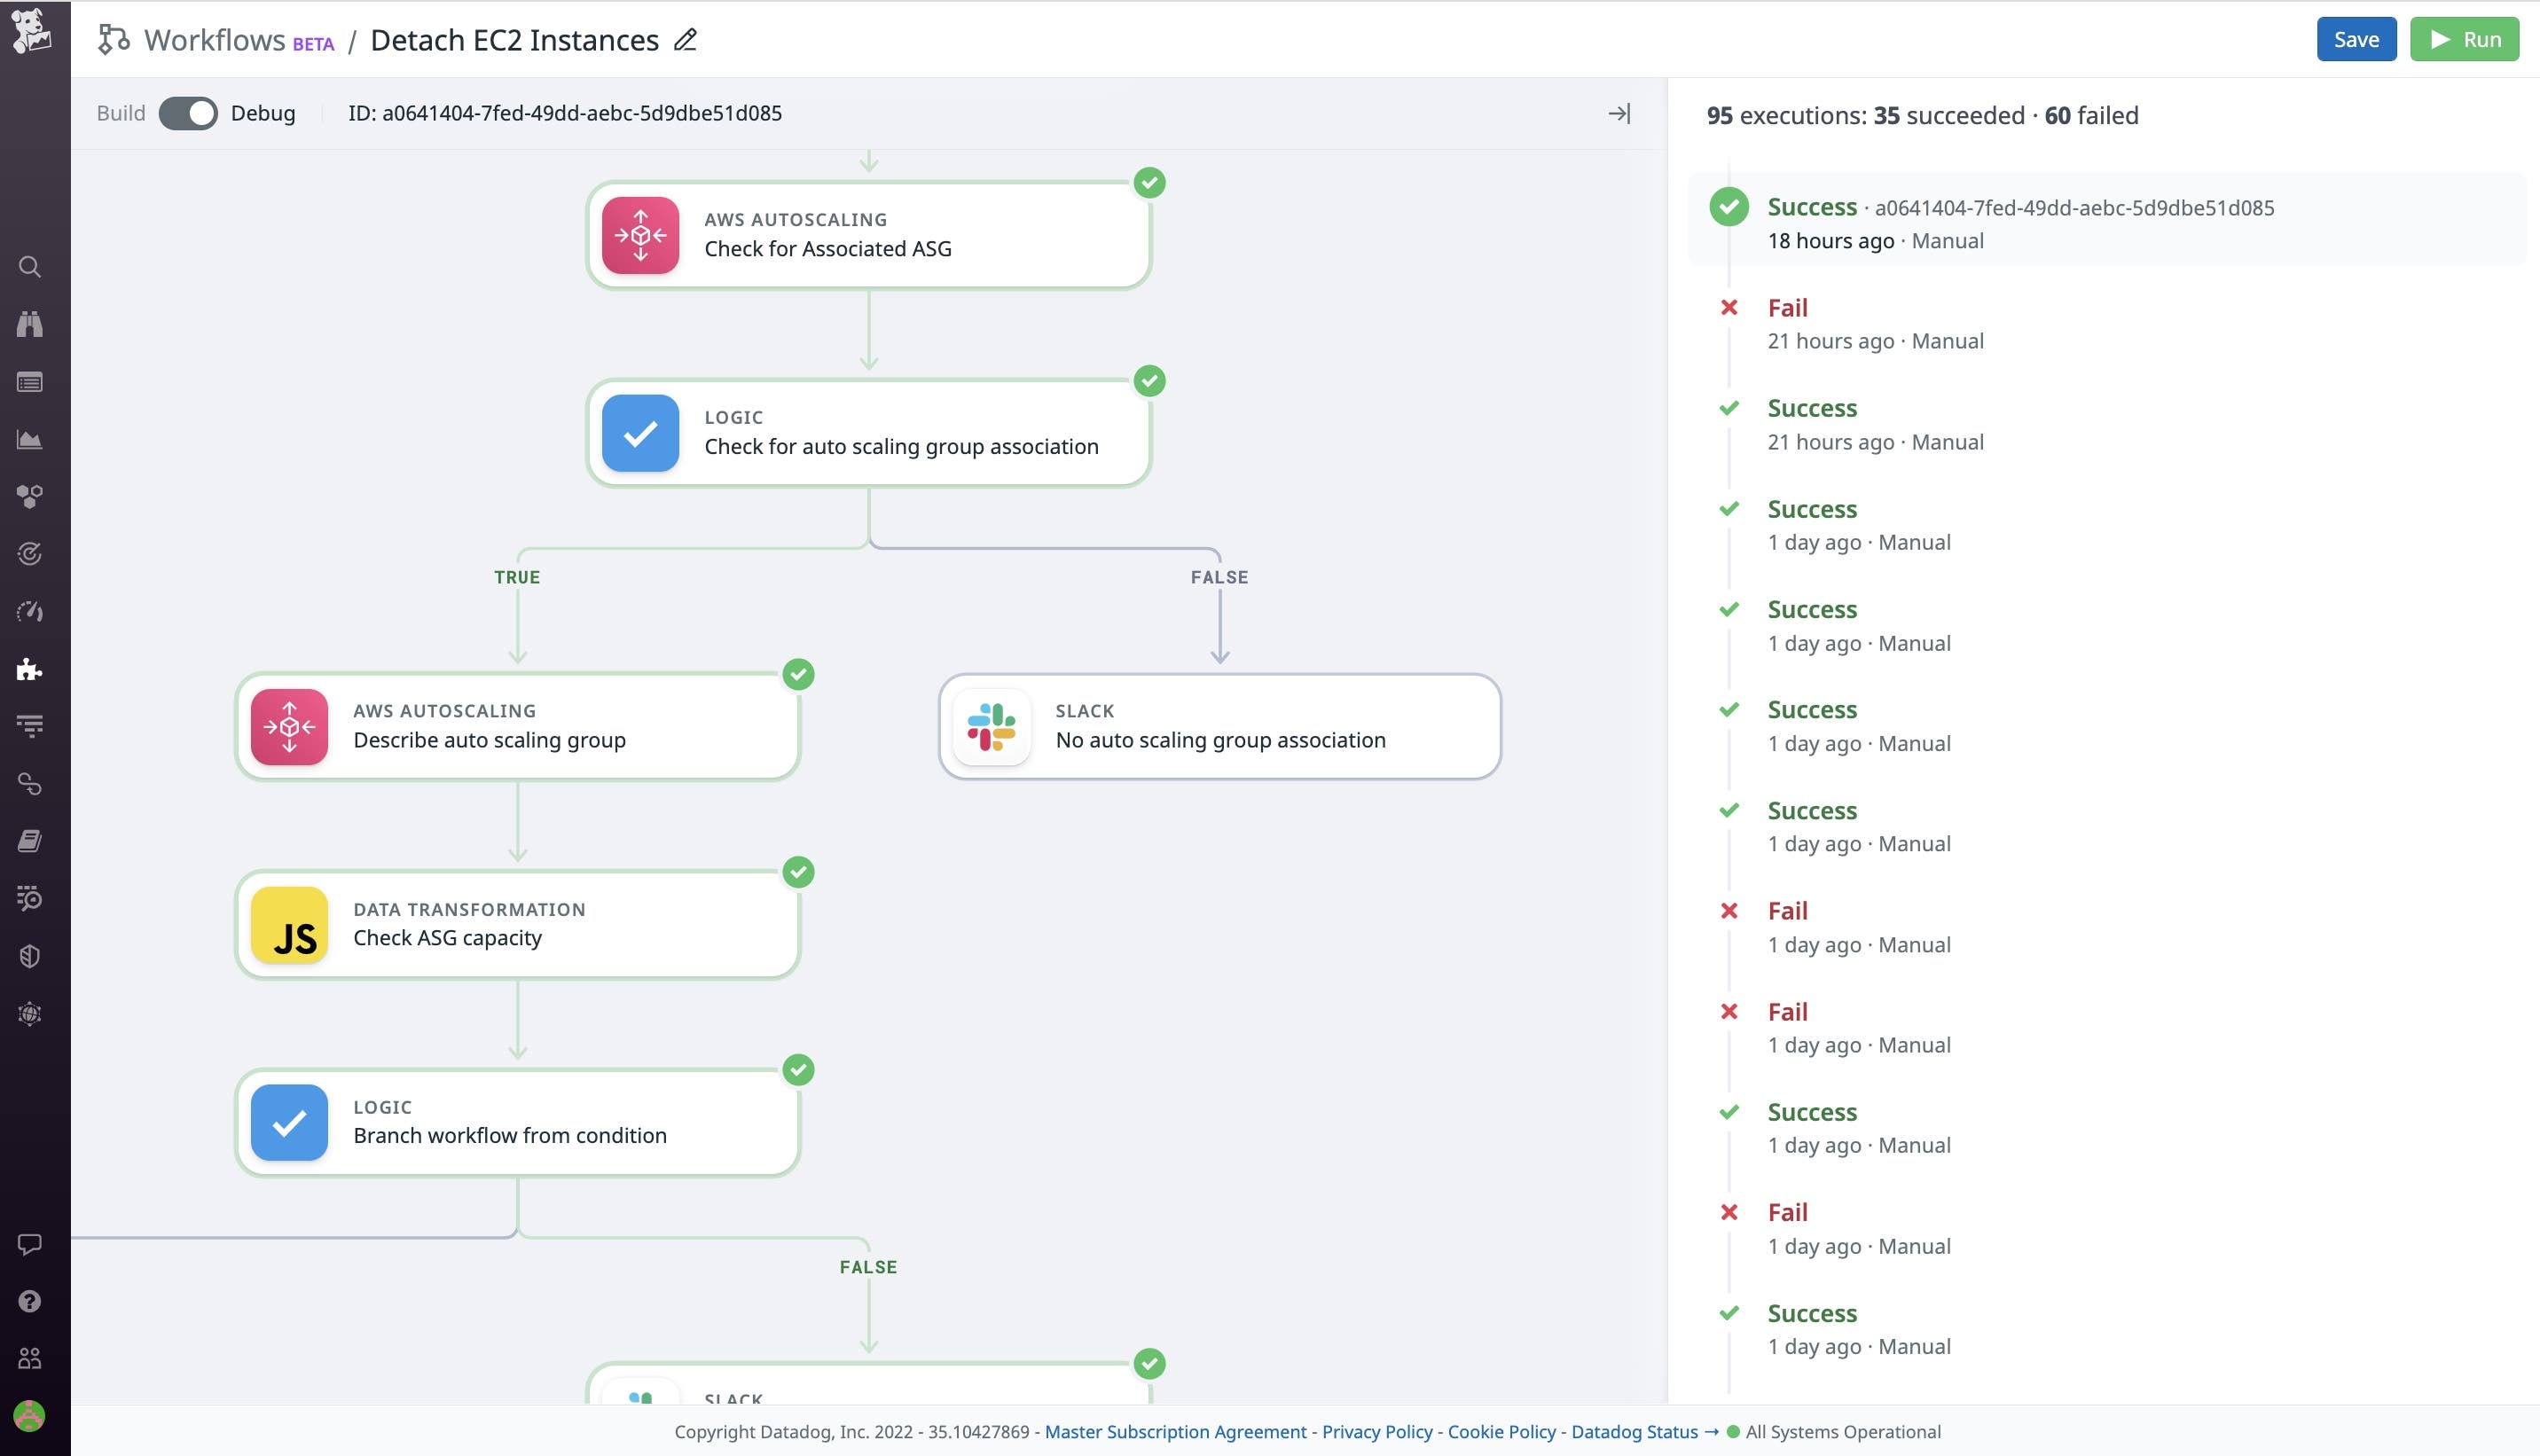
Engineering teams often perform complex and error-prone processes to address and remediate disruptions in their systems. These processes usually require teams to regularly context switch between different monitoring tools and execute several manual tasks, increasing the time taken to bring systems back to health. With Datadog Workflows, you can streamline your monitoring and troubleshooting processes by automatically executing a flow of tasks and incorporating user input only where necessary. Datadog Workflows is an automation and orchestration feature that can run in response to specific events such as triggered alerts and security detection rules. Additionally, you can manually trigger workflows and schedule event triggers to ensure that they’re running when needed. You can configure a workflow with an easy-to-use UI that offers more than 1,000 actions to automatically execute tasks. For example, you can configure a workflow that automatically redeploys Lambda function revisions to run in response to a high error rate alert.
Read our blog post to learn more about how Datadog Workflows helps teams quickly remediate issues and confidently manage their systems by automating troubleshooting processes.
Regulated industries
PCI compliance for Log Management and APM
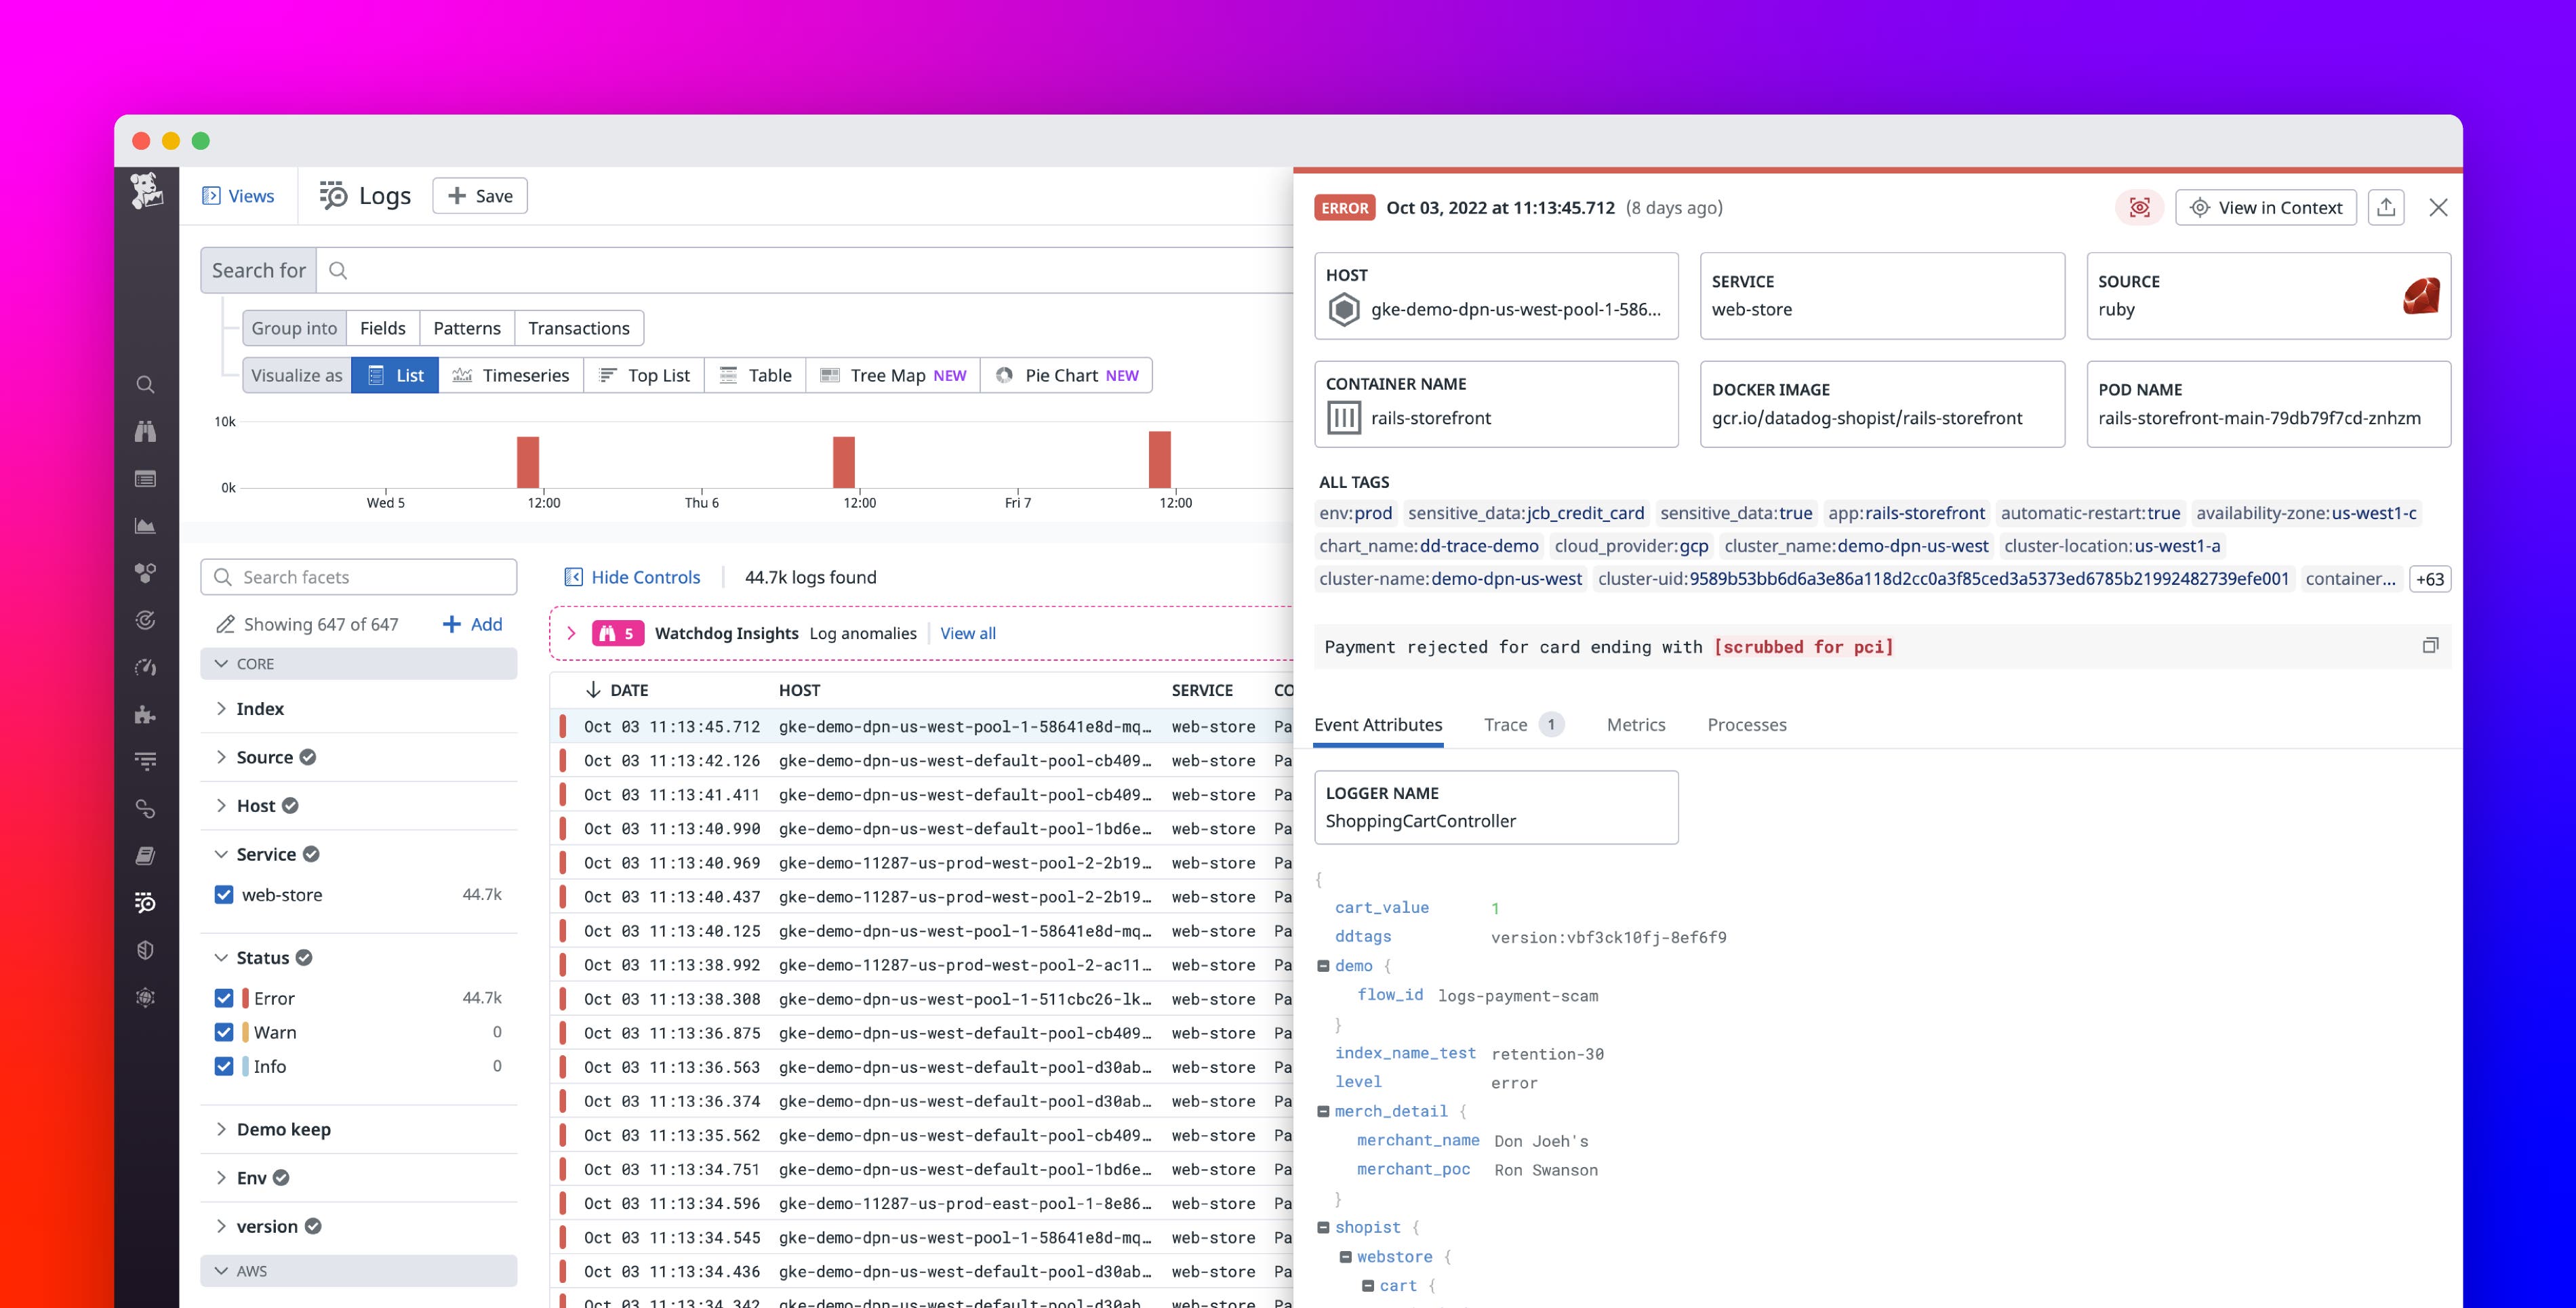
Monitoring within the guidelines of the Payment Card Industry (PCI) Data Security Standard (DSS) is a core requirement for any organization that stores, processes, or transmits cardholder data online. To meet this requirement, many organizations have resorted to using multiple monitoring platforms, funneling PCI-regulated data and non-PCI-regulated data into separate silos. We’re pleased to announce that Datadog now offers PCI-compliant Log Management and Application Performance Monitoring (APM). This means that organizations that handle cardholder data can now rely on Datadog—a PCI Level 1 Service Provider—for a comprehensive monitoring solution within our US1 environment.
To learn about how Datadog fulfills the PCI DSS and can help your organization do the same, check out our dedicated blog post.
HIPAA-compliant observability and security platform
For healthcare organizations, running applications in the cloud can mean efficiency and better service availability for users. But it also introduces complexity and new challenges in ensuring data security. Healthcare organizations need visibility into the health and performance of their applications while maintaining compliance and proper data governance. Datadog’s HIPAA-compliant observability and security platform provides healthcare organizations end-to-end visibility into the health, performance, and security of their applications. Organizations can now collect metrics, logs, traces, and other key telemetry into a unified platform for monitoring and troubleshooting. And HIPAA-enabled log management and security monitoring enables teams to maintain data compliance and quickly identify potential leaks of PII.
To learn more about Datadog’s HIPAA-compliant observability and security solutions, see our blog post.
Incident Management, Session Replay, and Continuous Profiler in Datadog for Government
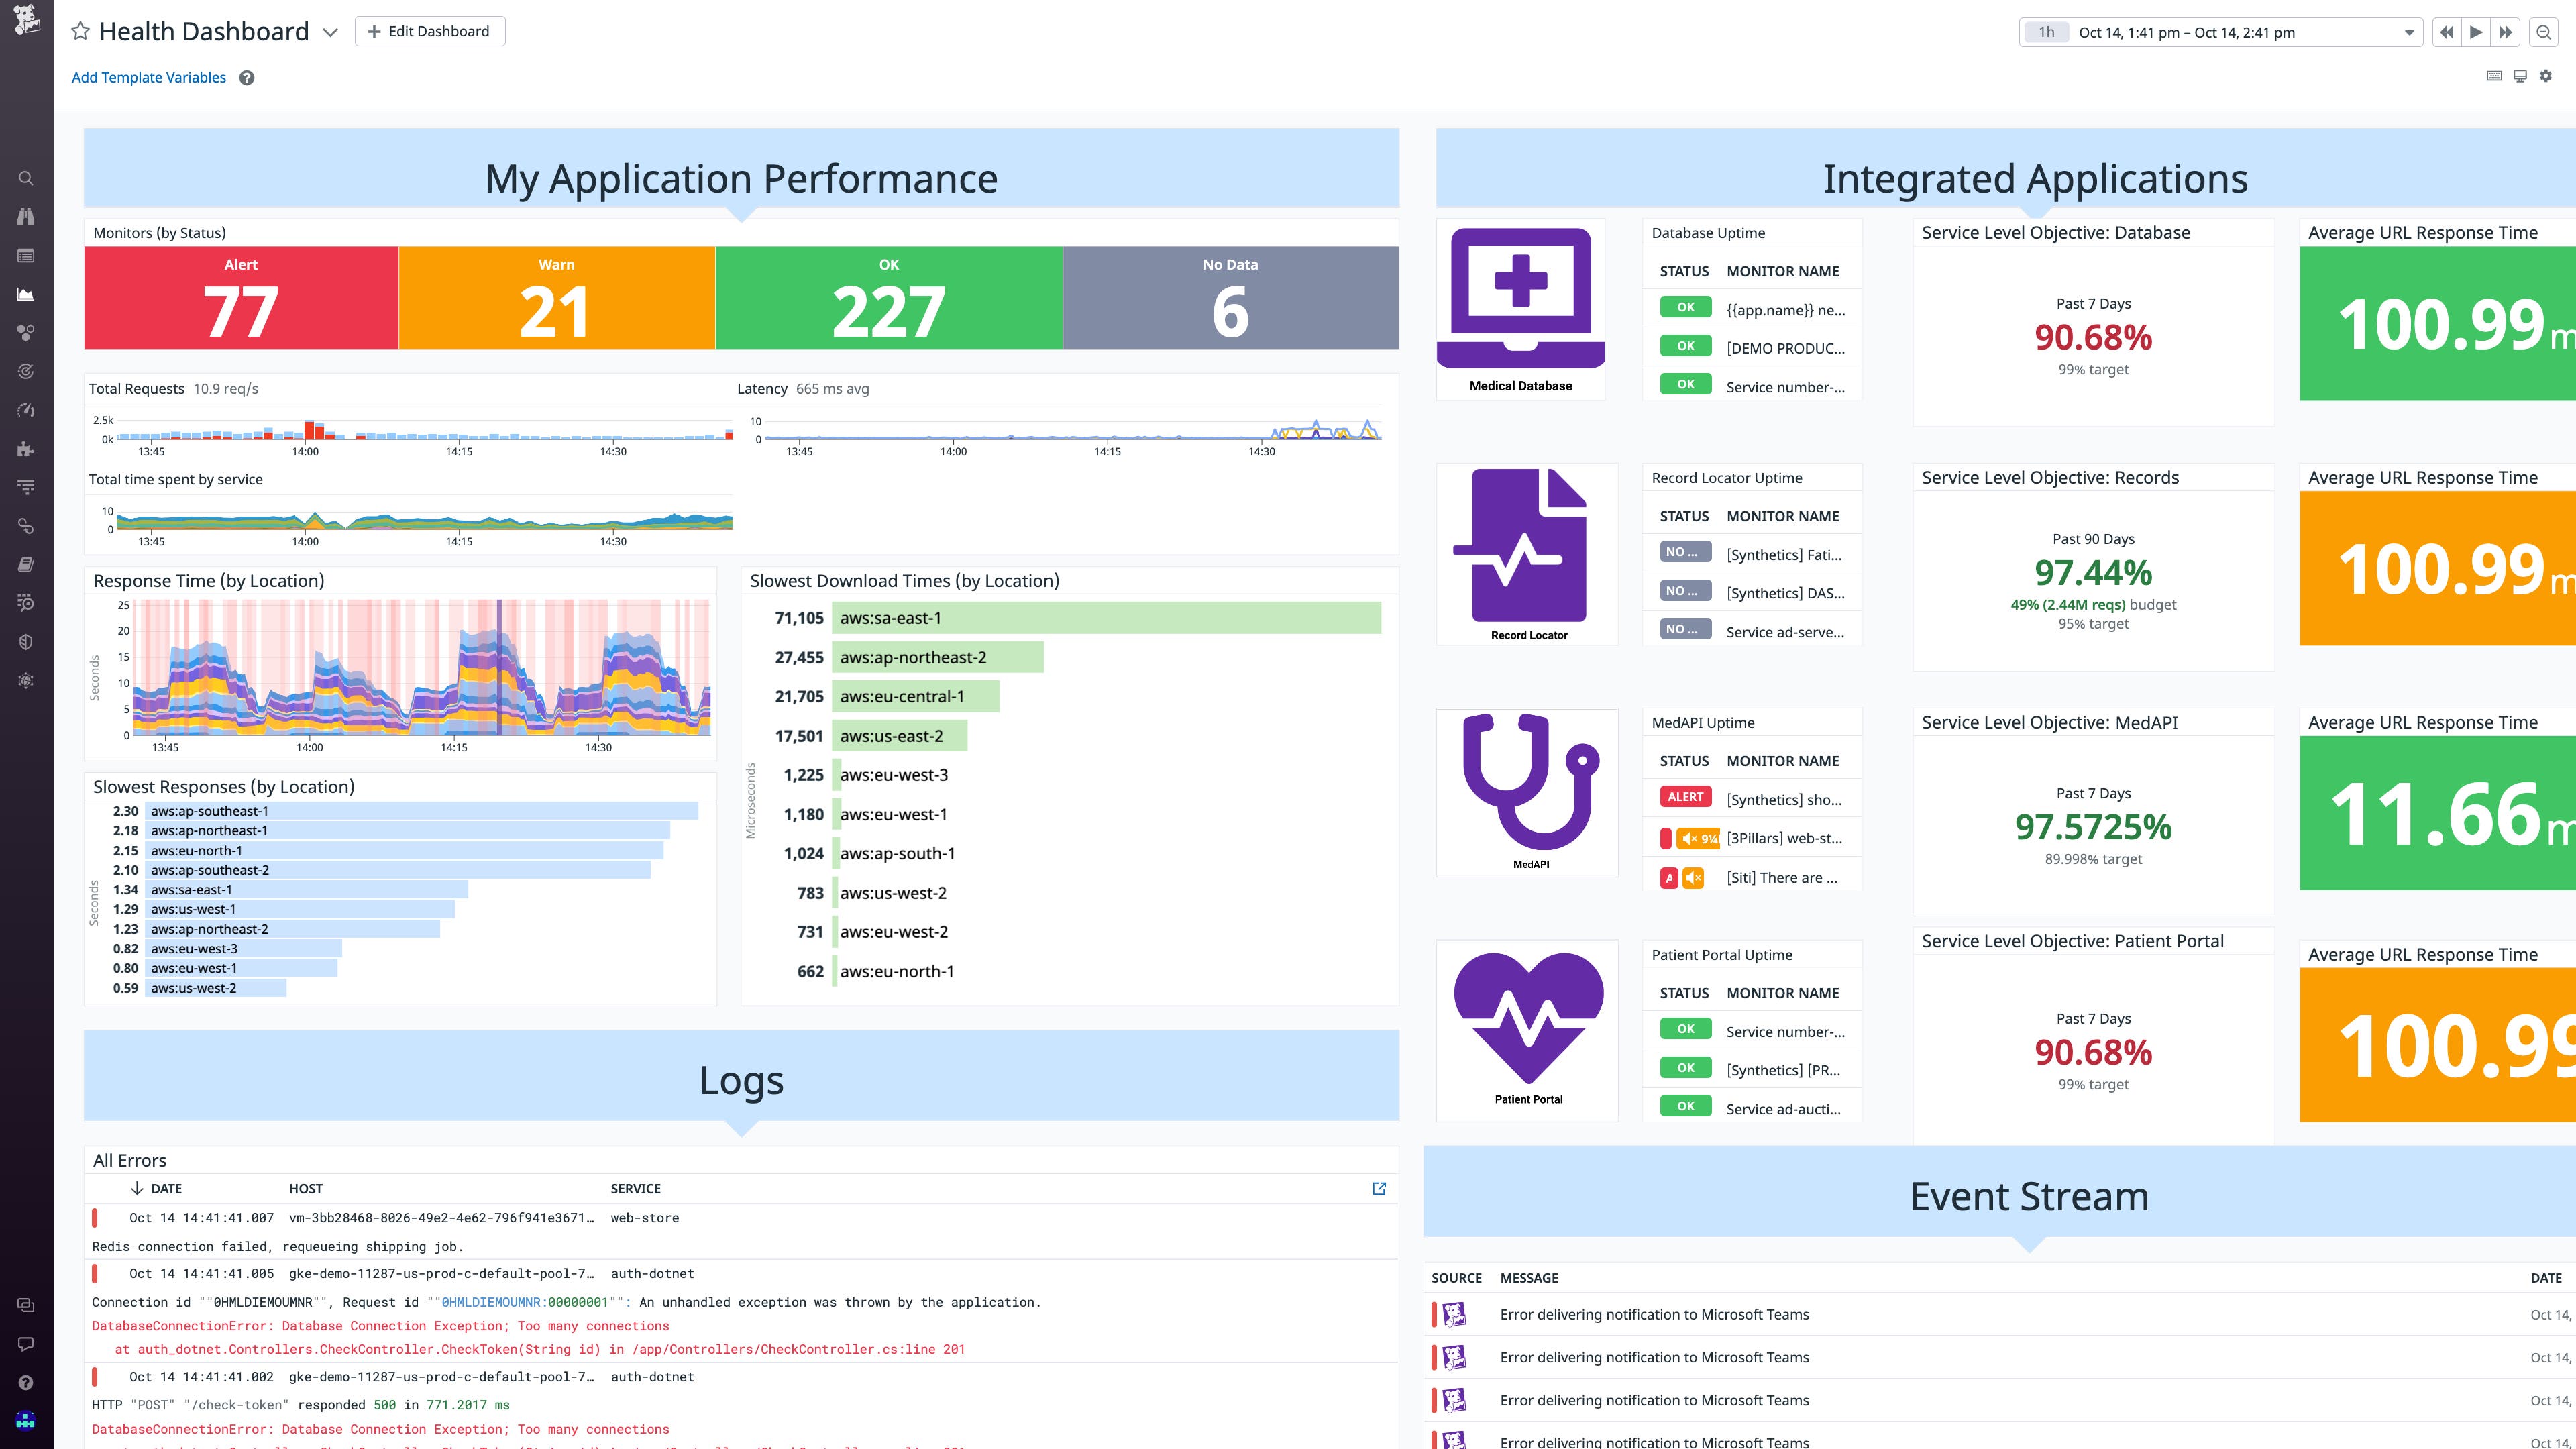
Monitoring in the cloud can present special difficulties for government agencies and other organizations affected by governmental security standards, which dictate in strict terms how data can and must be collected and managed. At the same time, the demand for reliable public-sector web applications is growing—and with it, the need for monitoring solutions to help ensure their reliability, as well as their compliance with critical and hard-to-navigate guidelines. We’re pleased to announce that Datadog Incident Management, Session Replay, and Continuous Profiling are now available on US1-FED, our dedicated site for customers who need the protections offered by a FedRAMP Moderate-level authorization.
This augments our existing monitoring tools for government agencies, educational institutions, and other public-sector organizations. With this expanded toolset, you can now use Datadog for Government to identify and mitigate incidents that lead to service disruptions, directly capture and analyze user experience, and analyze and optimize code-level performance—resting assured that you’re doing so safely and securely in compliance with FedRAMP’s airtight security guidelines.
Digital Experience Monitoring
Mobile app testing
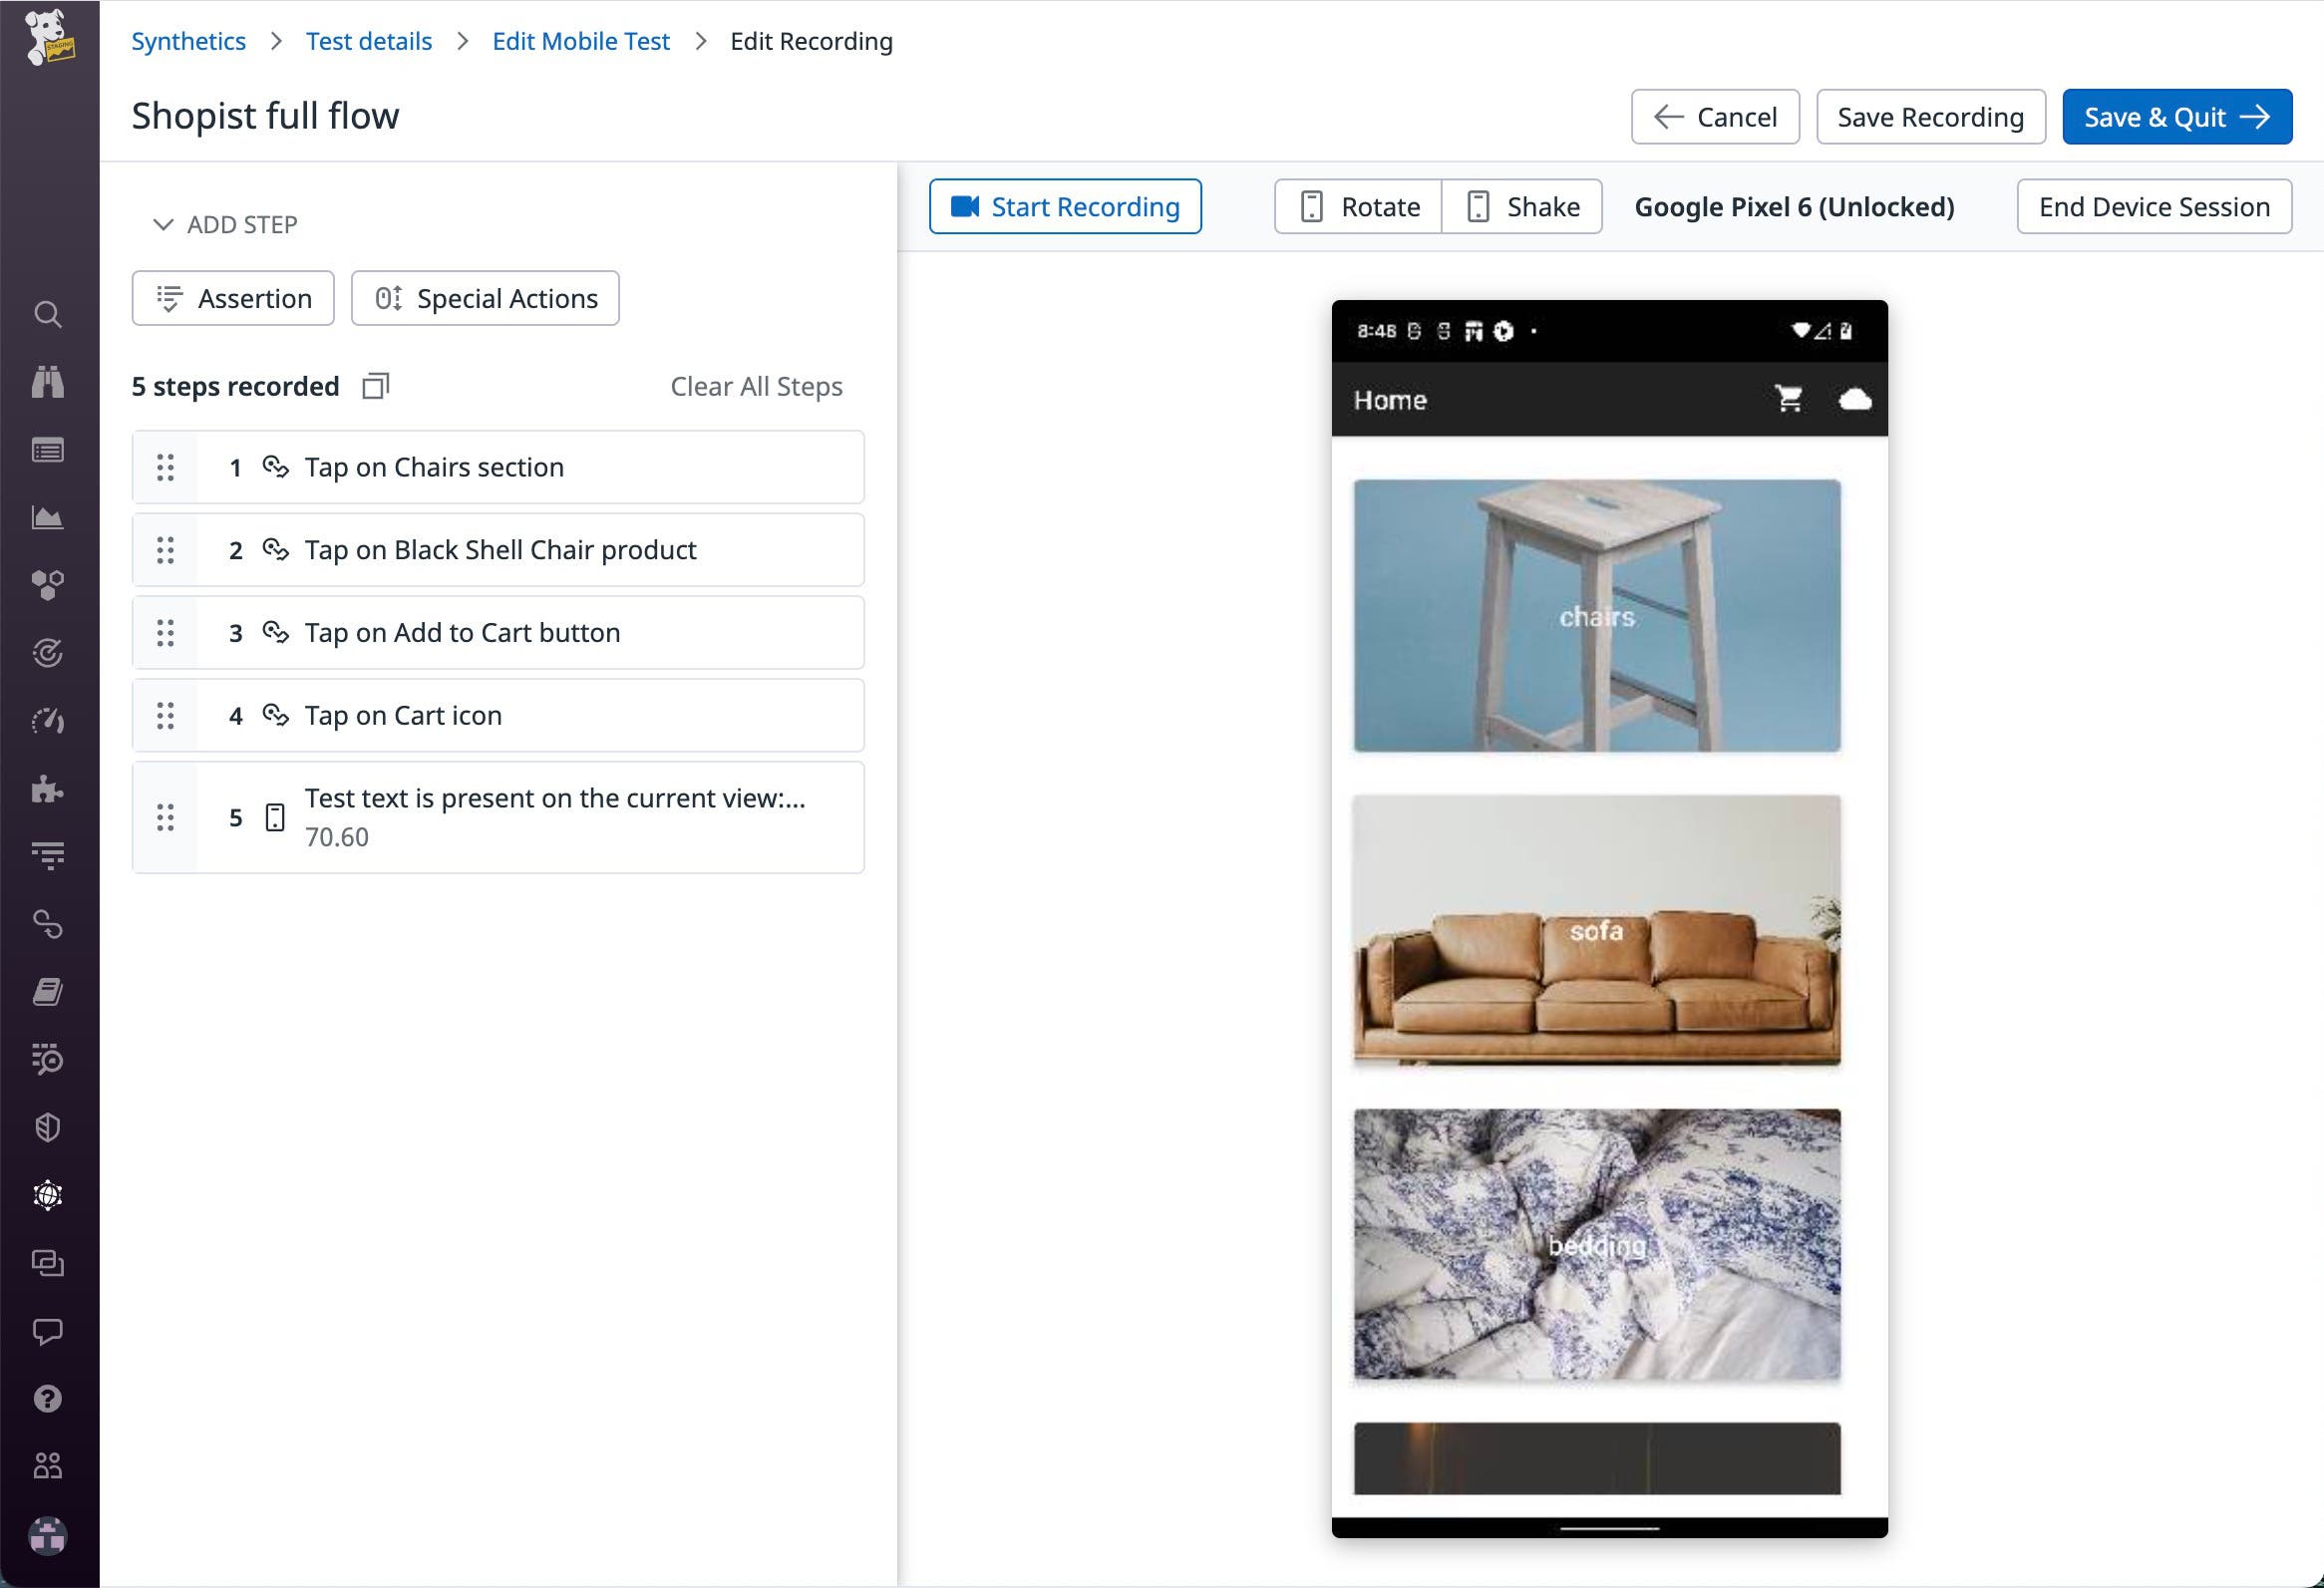
Datadog’s digital experience monitoring tools enable you to continuously assess the function and performance of your web frontends in production by creating and running end-to-end synthetic tests with simulated requests and actions. Datadog now also supports mobile application feature testing for both iOS and Android devices, so you can create step-by-step recordings of key application workflows and test them on real devices. Mobile application tests can be triggered automatically within your CI/CD pipelines, enabling you to catch and fix regressions before they make it to production. When tests run, Datadog provides detailed pass/fail results that include screenshots of each step so that your engineers can quickly visualize what went wrong. To keep your tests resilient, Datadog automatically detects and ignores trivial UI changes—this spares your test authors from having to constantly update test definitions for minor cosmetic tweaks. You can now get started testing your mobile apps by signing up for the Preview.
Heatmaps
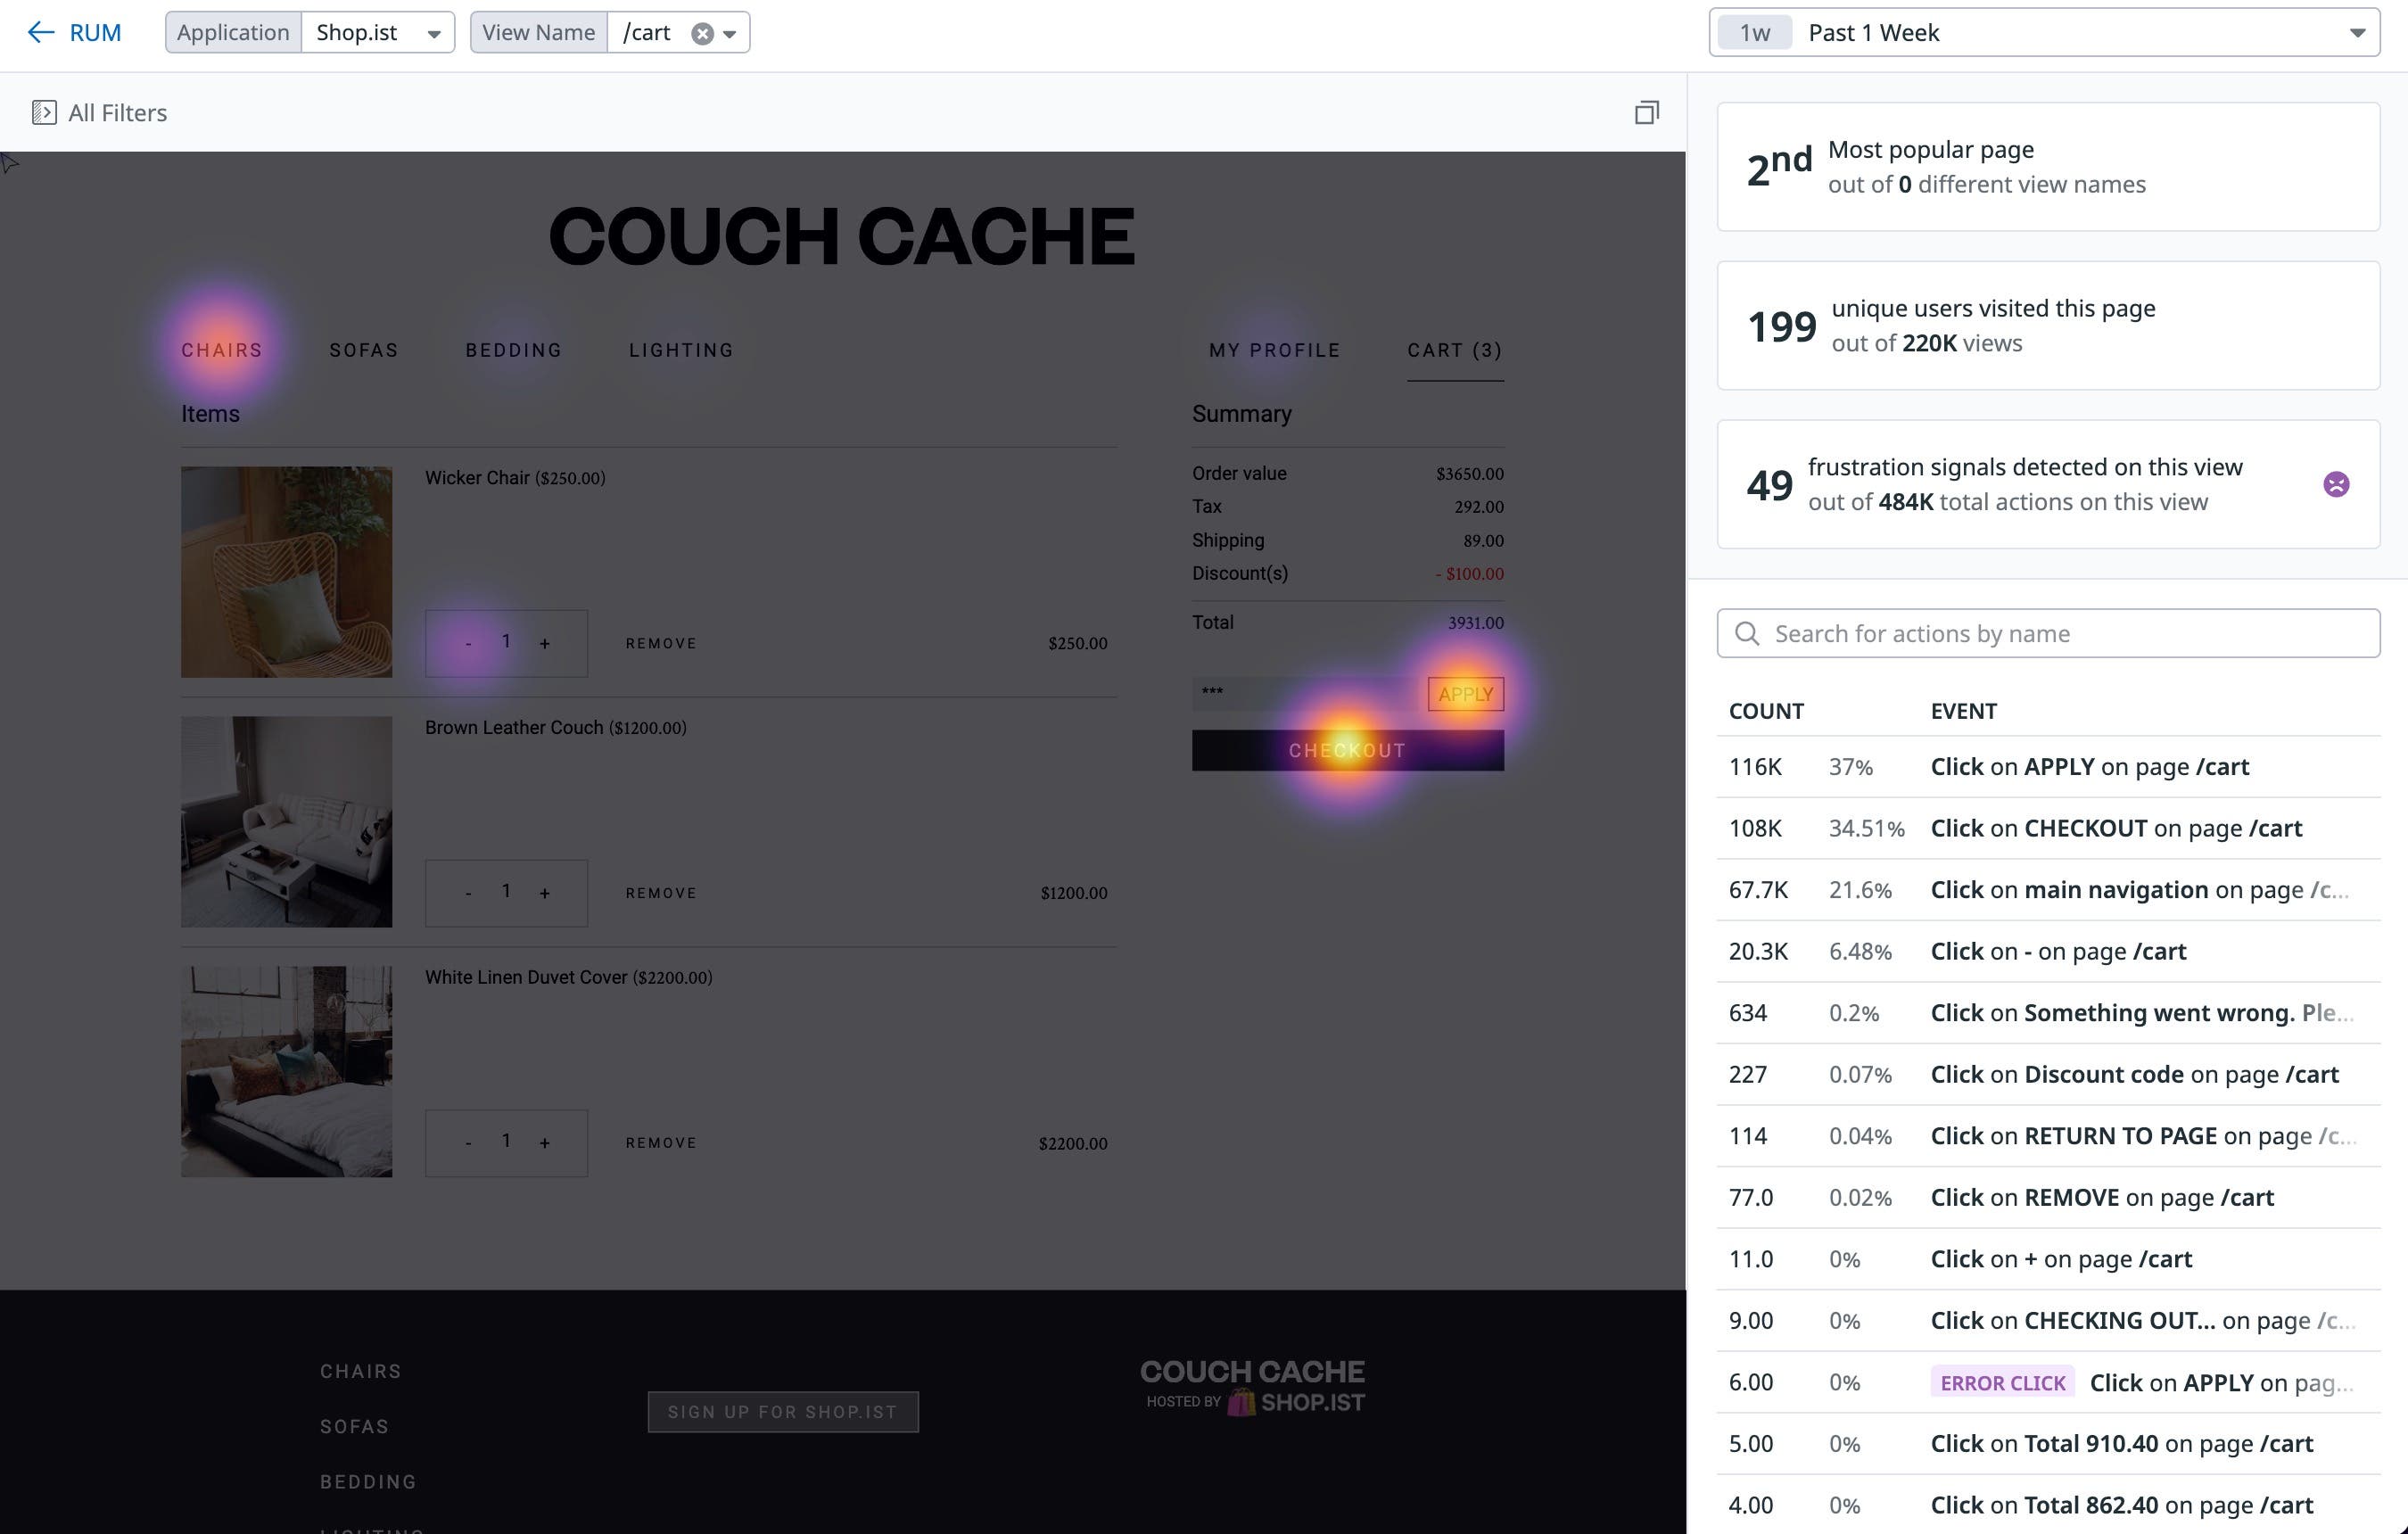
Last year, we released Session Replay, which captures video-like records of individual user sessions—removing the guesswork from troubleshooting frontend errors and reducing your mean time to resolution. With Heatmaps, we’ve introduced the next step in our evolution of Session Replay by further enhancing your frontend troubleshooting and enabling you to quickly spot patterns in user behavior. Heatmaps provide you with an aggregated view of how users interact with specific pages of your website or application by visually highlighting areas of that page at different levels of intensity based on user clicks. Let’s say you want to test whether any elements on a page are preventing users from discovering your main revenue-generating buttons and links by watching Session Replays. Instead of watching dozens or even hundreds of replays, you can switch to a view of a heatmap to quickly get an aggregated view of user behavior on that page and determine whether there are distracting elements on a page preventing users from accessing key calls to action (CTAs). Heatmaps can help you uncover hidden patterns in user behavior, encourage faster debugging, and increase organizational efficiency by illustrating the parts of pages users are interacting with most. Heatmaps is currently in Preview. To request access, please fill out this form.
RUM for Flutter mobile applications
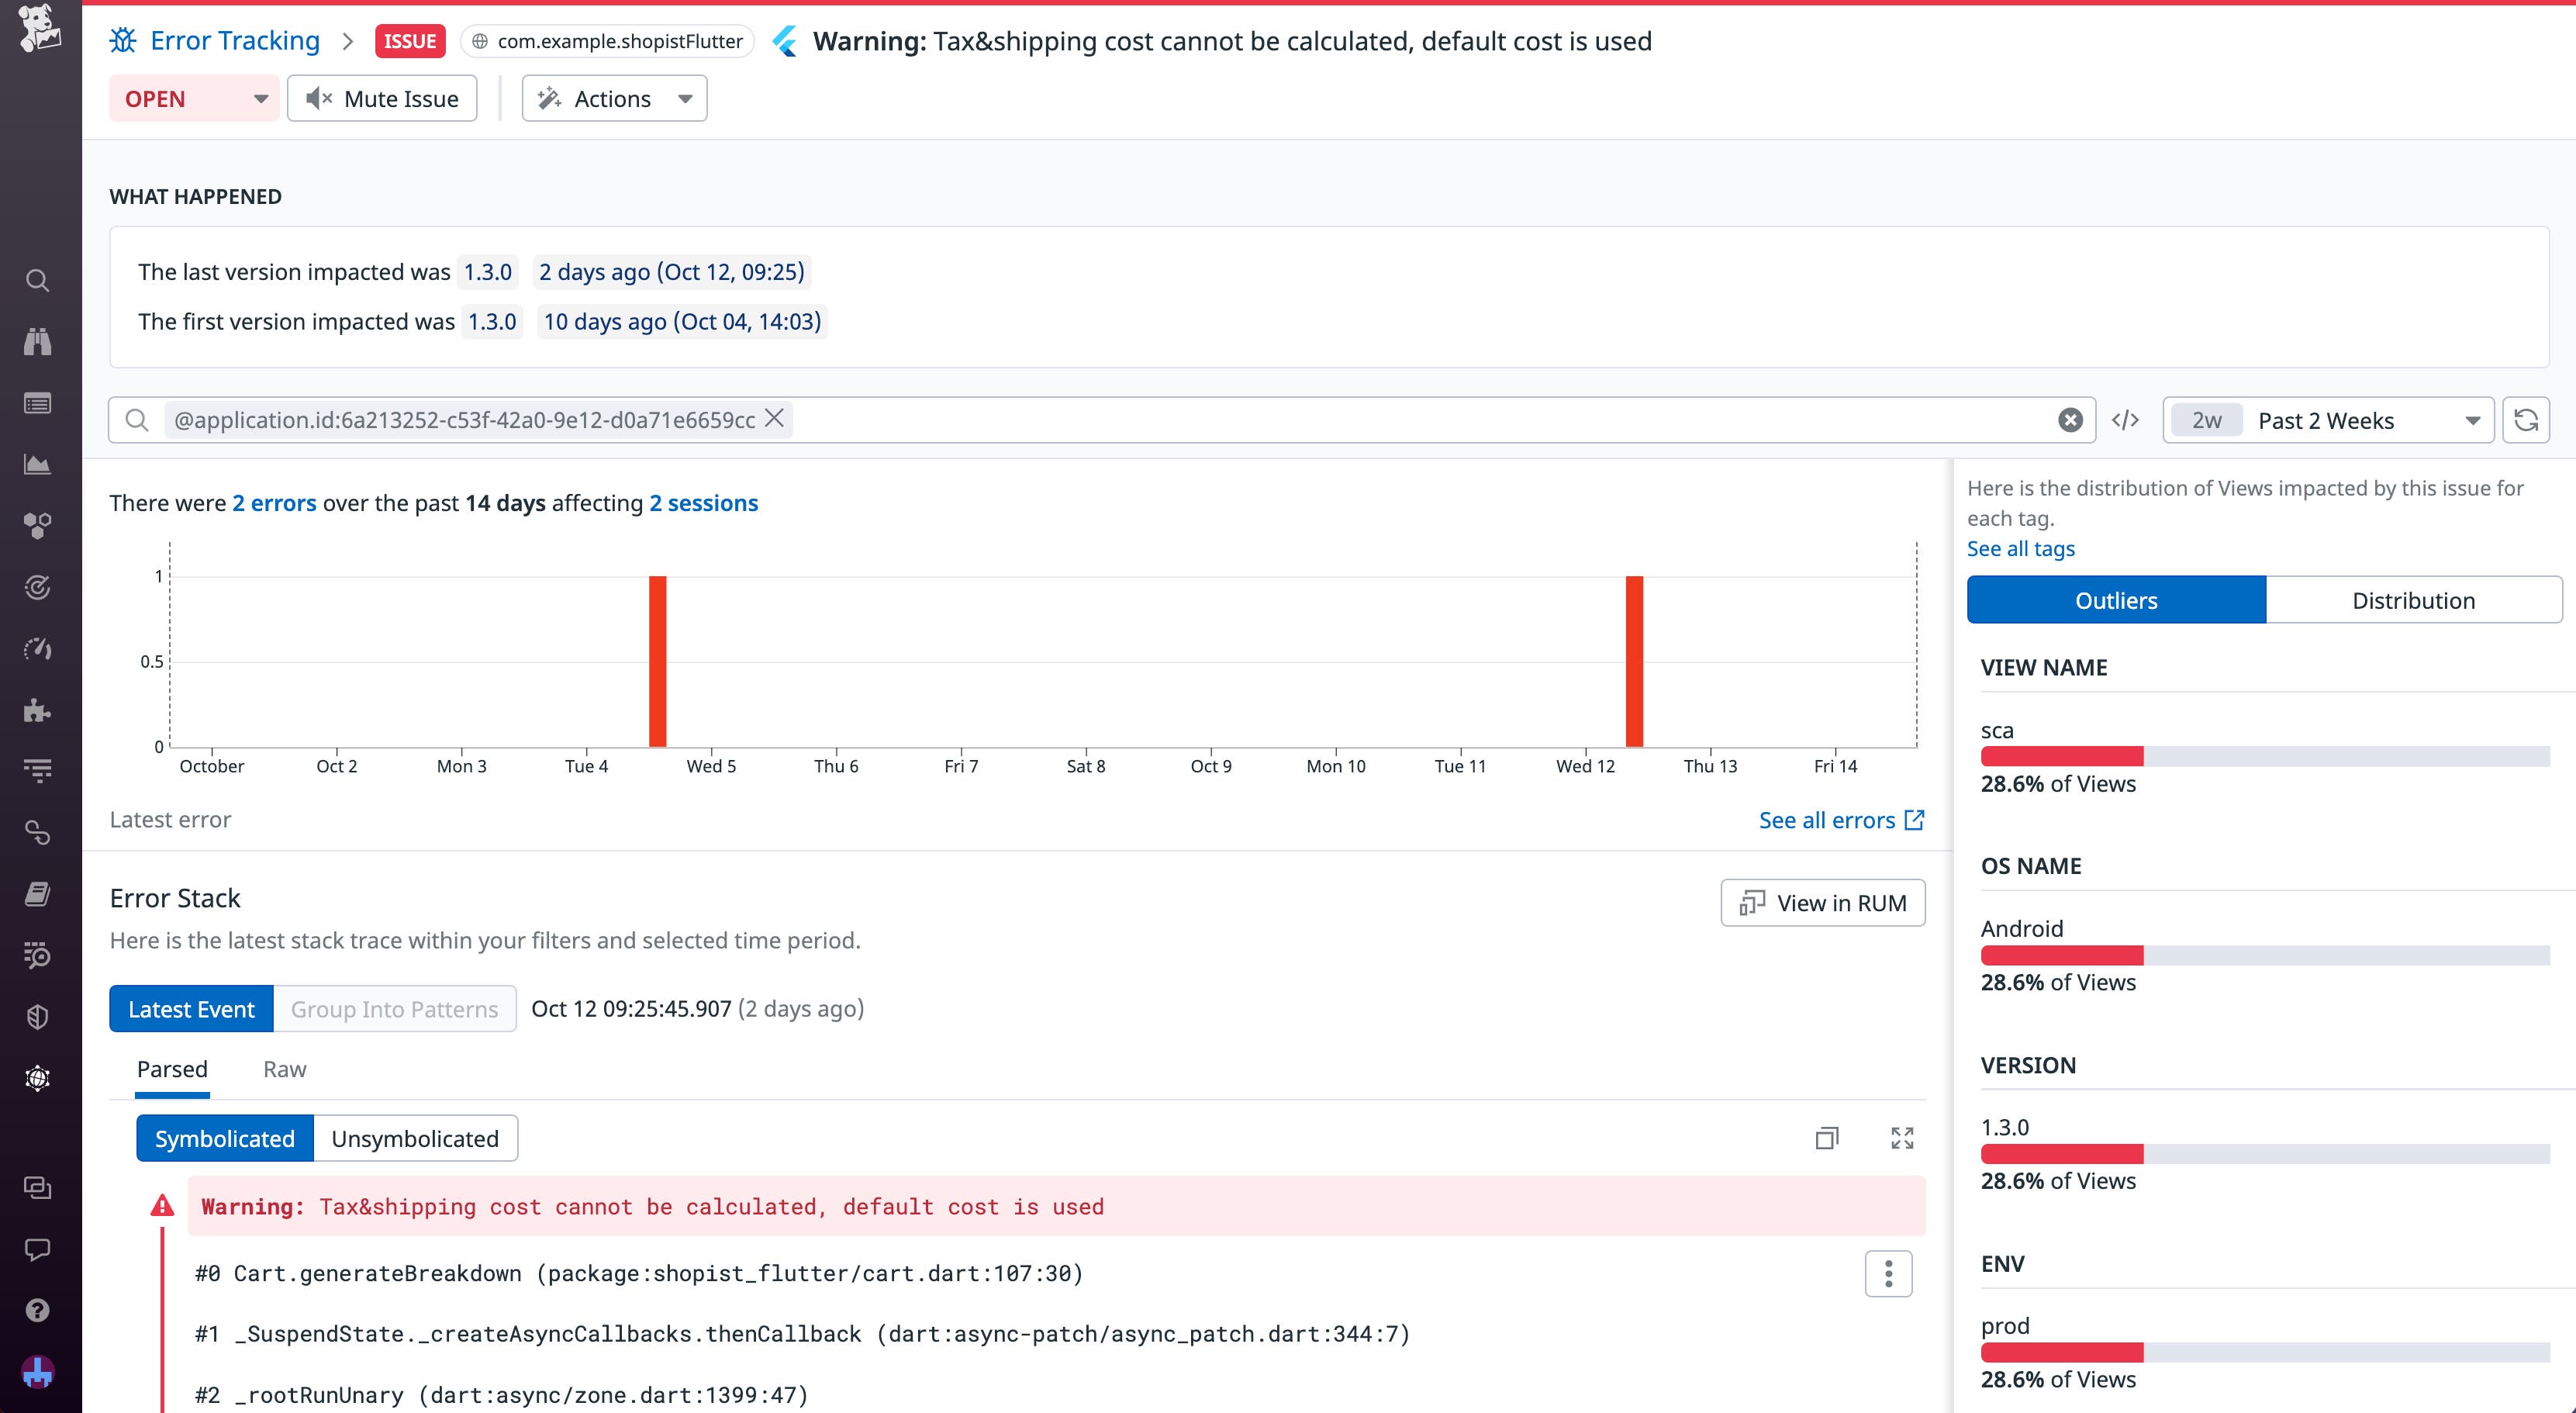
Flutter is a popular open source framework that allows you to create multi-platform applications from a single codebase. Repurposing code with Flutter can save you significant time and effort, but it can also make it challenging to troubleshoot effectively across different devices and operating systems. By giving you deep insight into your user sessions, Datadog Mobile RUM for Flutter provides you with the context you need to monitor cross-platform application performance and investigate issues. Session tags help you drill down into user journeys and evaluate UX across mobile devices, while Mobile Vitals allow you to investigate performance problems and troubleshoot contextual crash reports. You can even link Mobile RUM with APM to view Flutter traces, enabling you to pinpoint root causes faster. Read our blog post to learn more.
APM
Remotely configure your APM sampling rate
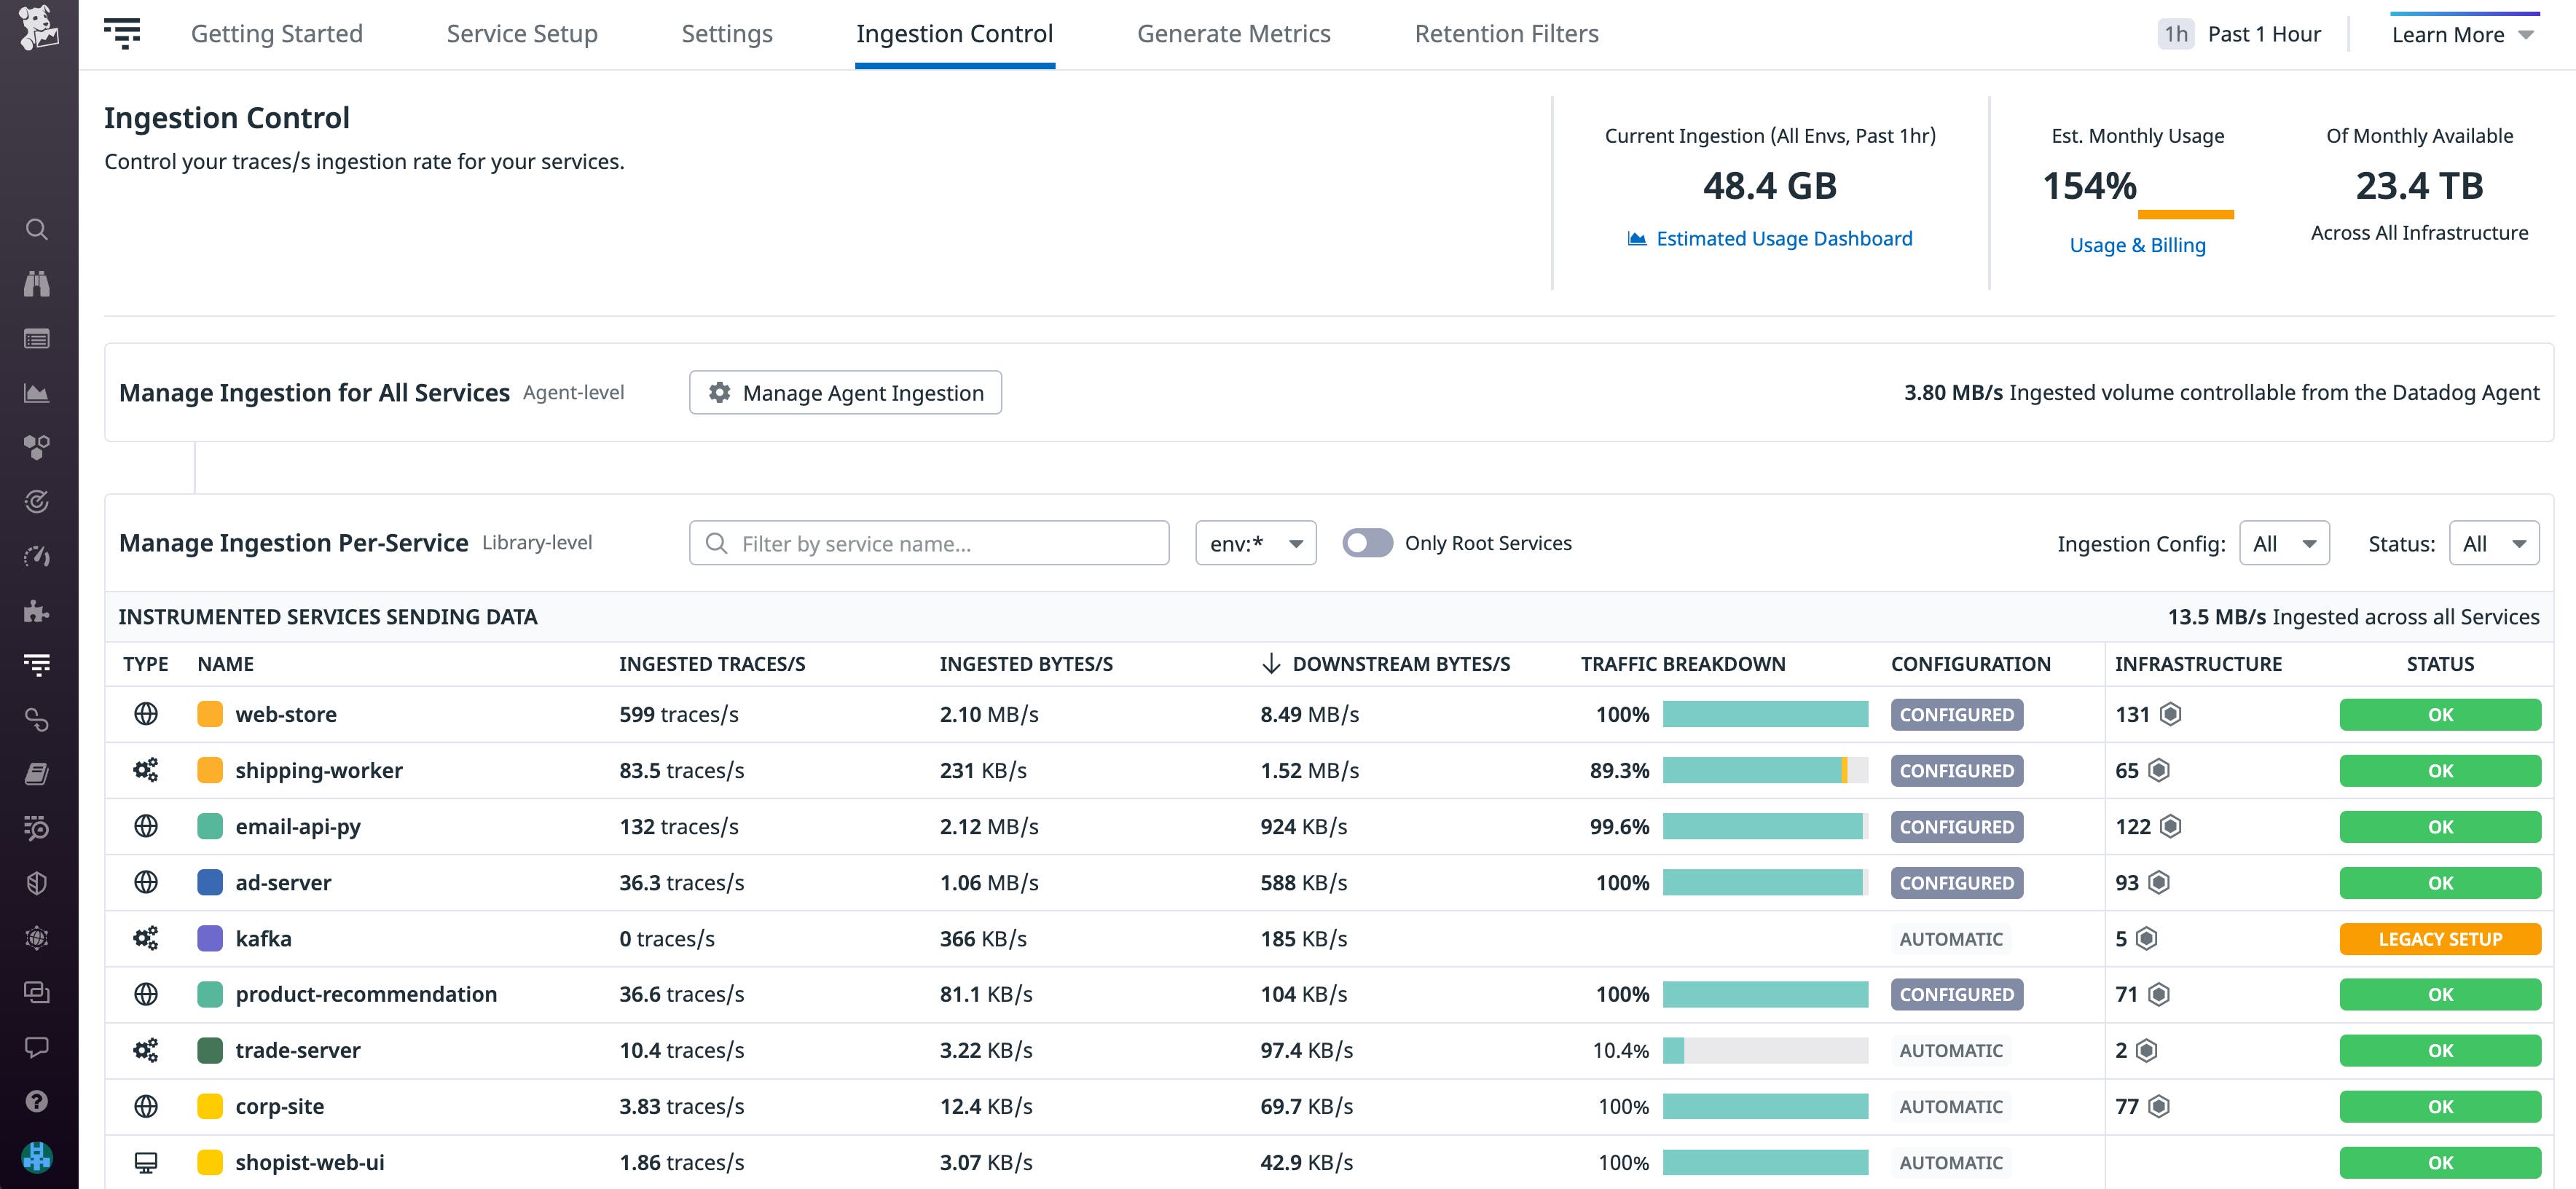
Finding a healthy balance between the volume of spans to ingest for each environment and your budgeted usage is invaluable when attempting to align your network costs with your business goals. You can now remotely configure the Datadog Agent to change its trace sampling rates from Datadog APM’s Ingestion Control page, where you can set rules to scale your organization’s trace ingestion according to your needs. Remotely managing your sampling configuration enables you to immediately forecast how changes will affect your ingestion volume without needing to restart our Agent. Remote Configuration for APM sampling rates will soon be available in Preview. To express interest in early access, you can contact Datadog Support.
Library injection into Kubernetes environments via admission controller
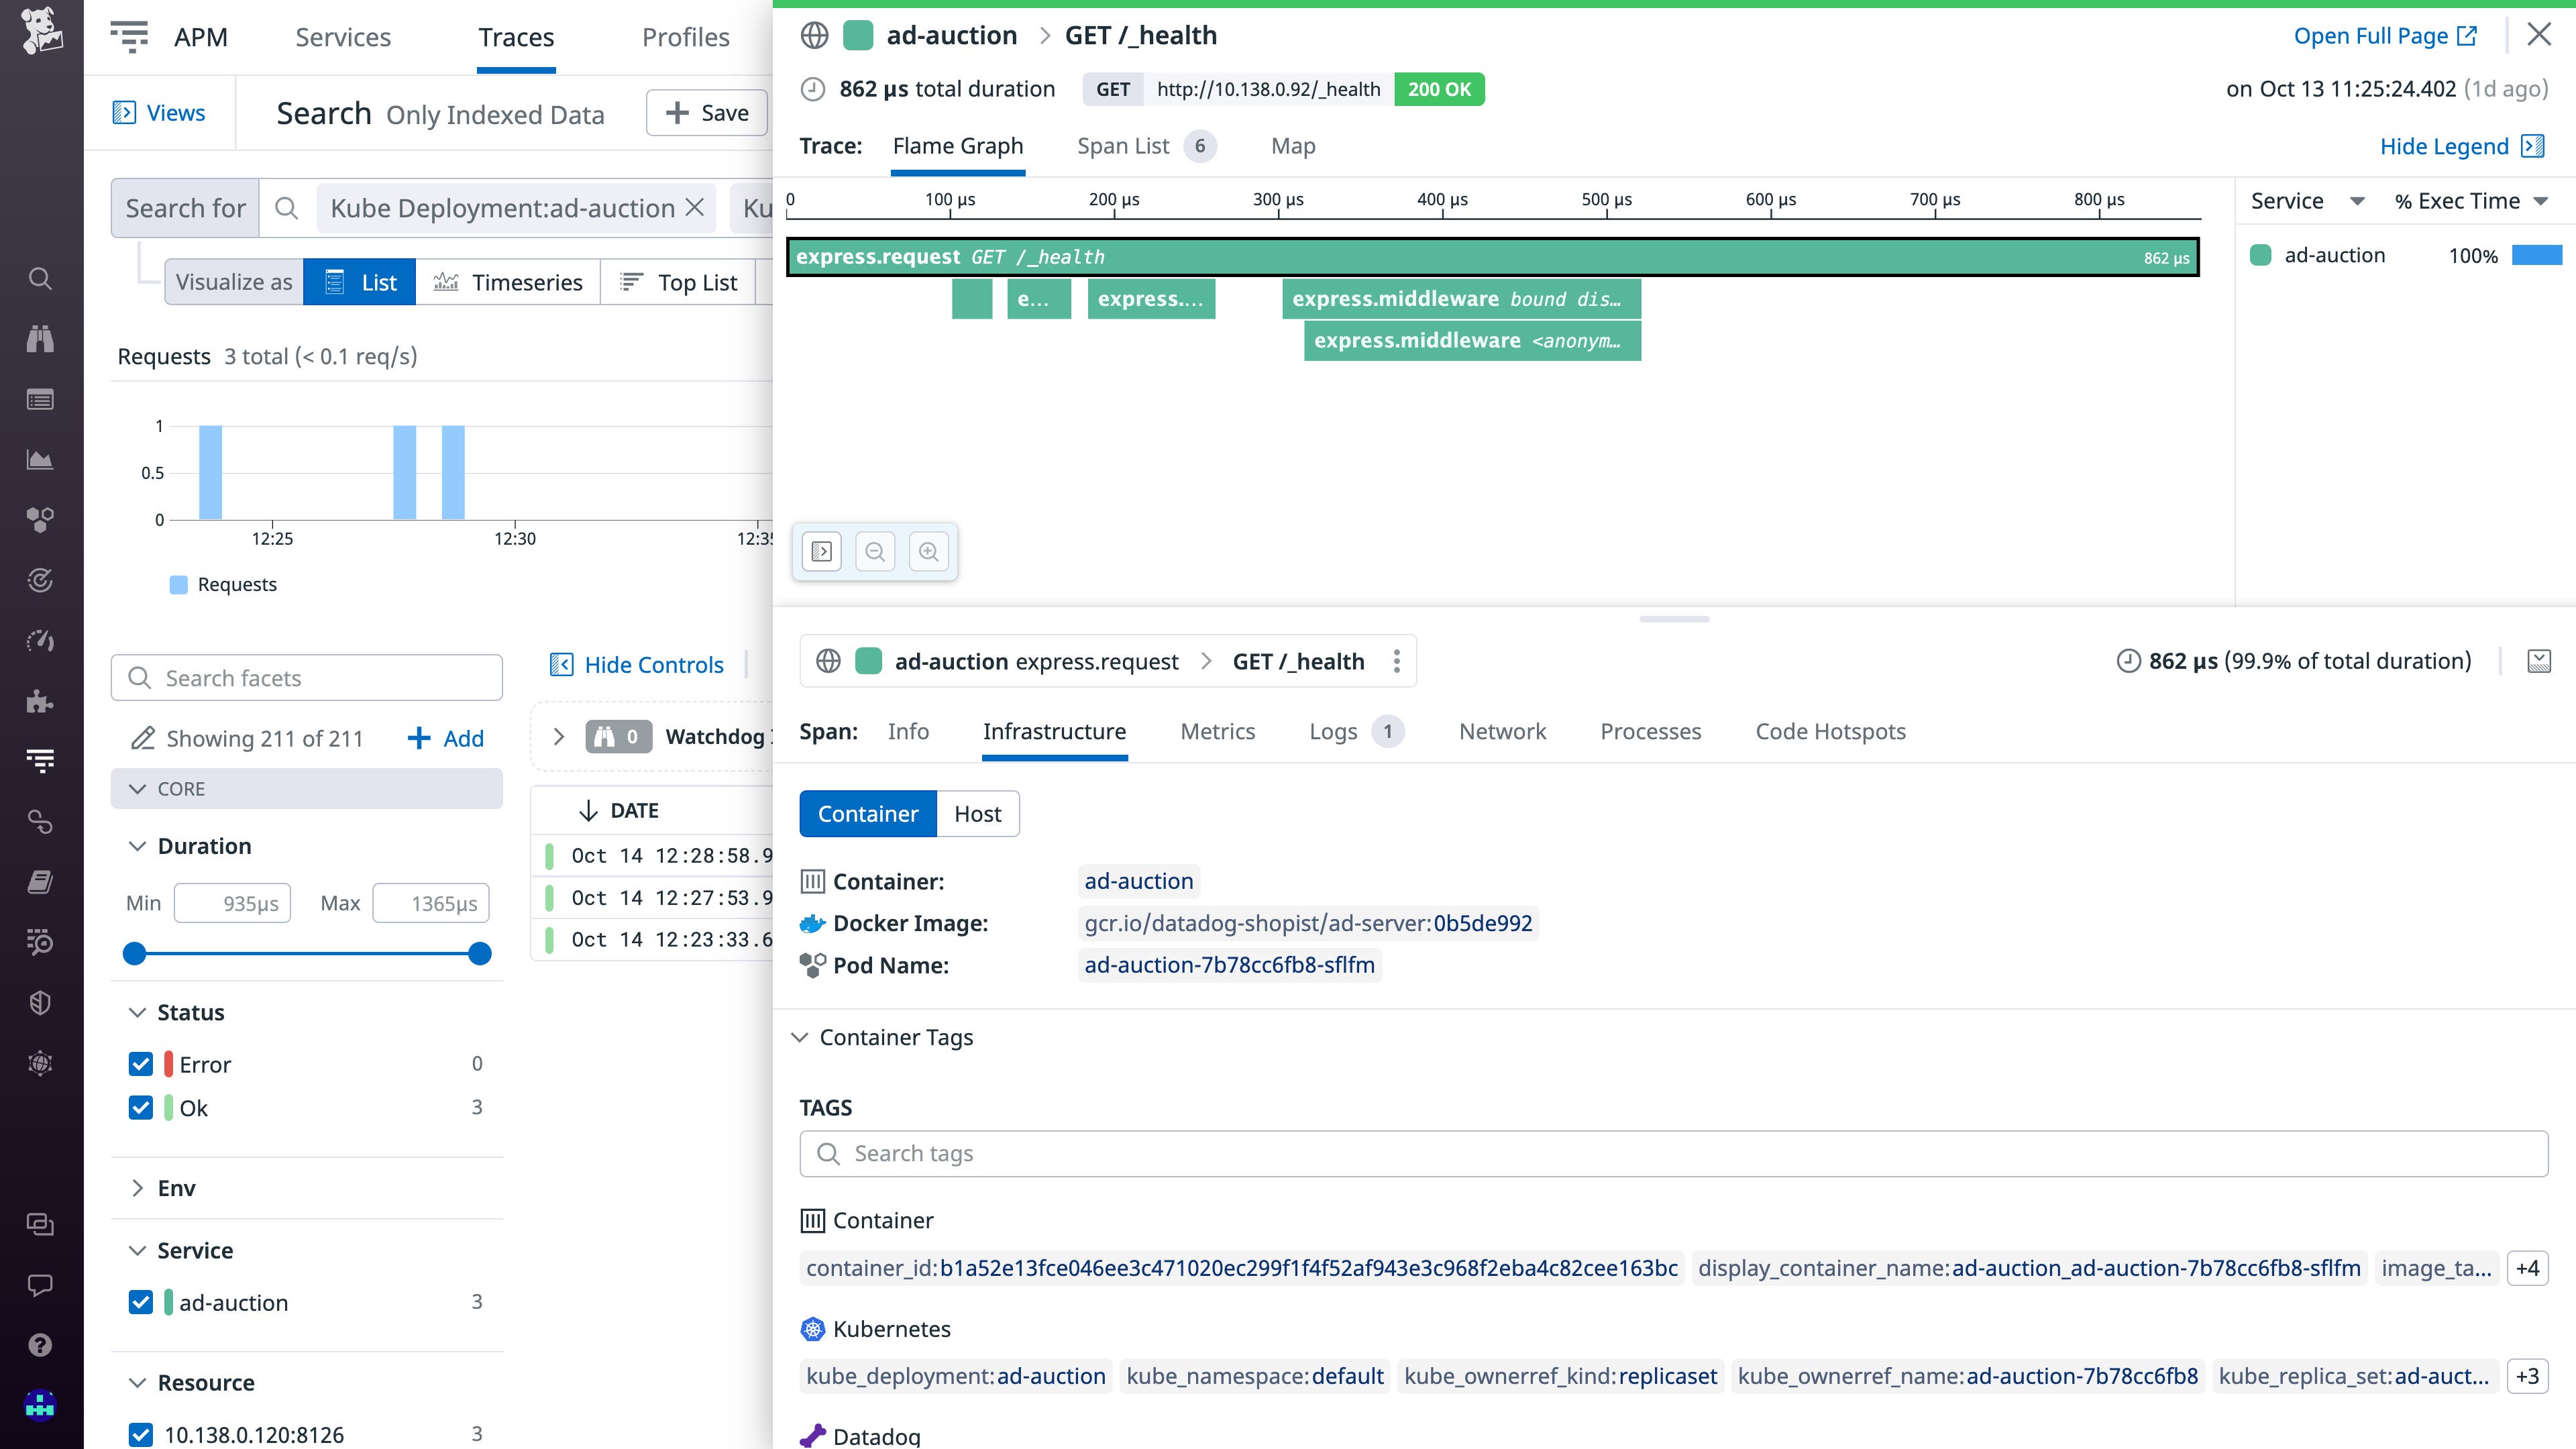
Historically, tracing containerized applications required building a new application image that includes the necessary libraries to configure tracing at application startup. Now, by utilizing the Datadog admission controller, you can inject libraries and their respective configuration variables into your Kubernetes containers. By injecting the libraries directly from the admission controller, you can collect distributed traces from your containerized workloads without needing to modify their application images. With this method, you also are able to quickly configure other APM suite features, such as Application Security Management, Continuous Profiler, and Data Streams Monitoring. In all, you are now able to simplify the logistics around instrumenting your applications and scale your cloud workloads in minutes while having full visibility into their performance at your fingertips. Library injection is currently available in beta for the Java and Node libraries, and support for other languages is coming soon. See our documentation for more information.
Send critical metrics, traces, and logs with no code changes using Dynamic Instrumentation
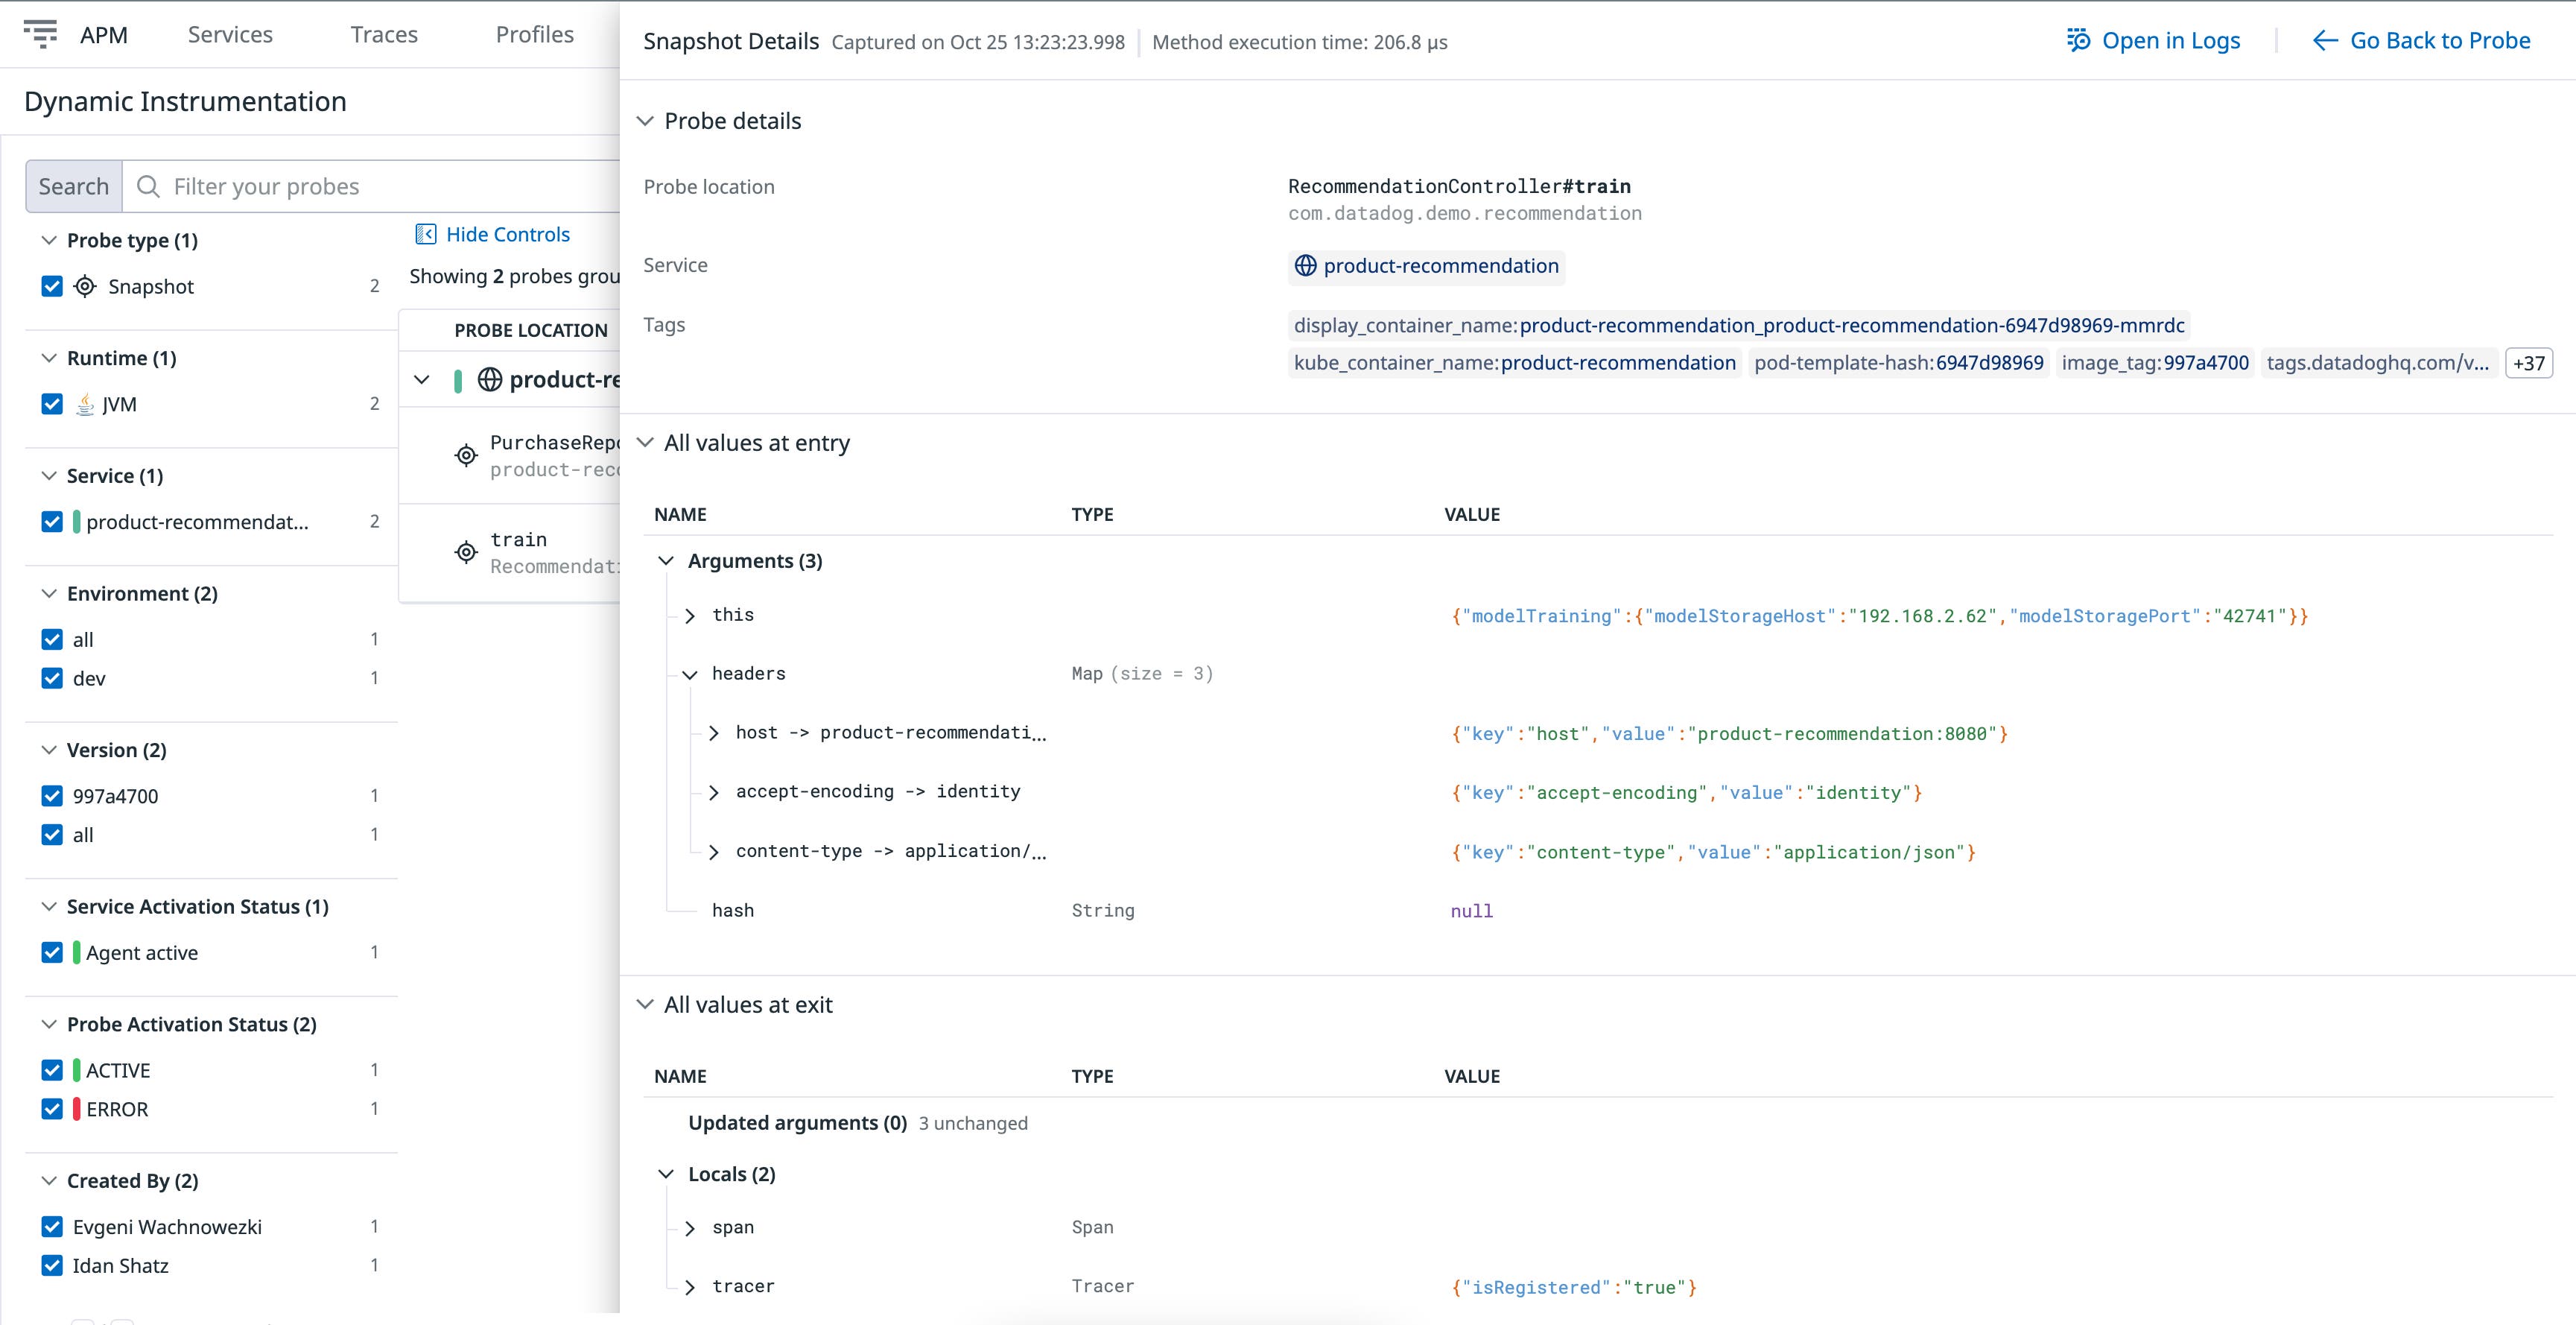
In an attempt to avoid the complex process of troubleshooting, reproducing, and resolving production issues in distributed systems, developers often add a log line to their code or instrument other types of telemetry in order to understand the problem better in production. However, before they reach production, these code changes must go through the entire CI/CD pipeline—including builds, tests, and deployments—in multiple environments. But even then, the chances are that additional telemetry will be missing, requiring the developer to repeat the process. Datadog Dynamic Instrumentation eliminates this burden by allowing application developers to add telemetry on the fly with no code changes or redeployments. This reduces friction between development, operations, QA, and other teams and accelerates resolution times. In addition, Dynamic Instrumentation provides deep visibility into your production code by allowing you to add executional context data such as local variables and invocation parameters right from the Datadog UI as your code is running in production. Any telemetry that you add through Dynamic Instrumentation can be removed with a single click at any time, allowing you to easily prevent unnecessary data ingestion. Dynamic Instrumentation is currently in Preview. To request access, fill out this form.
NDM
Monitor network performance issues with SNMP Traps
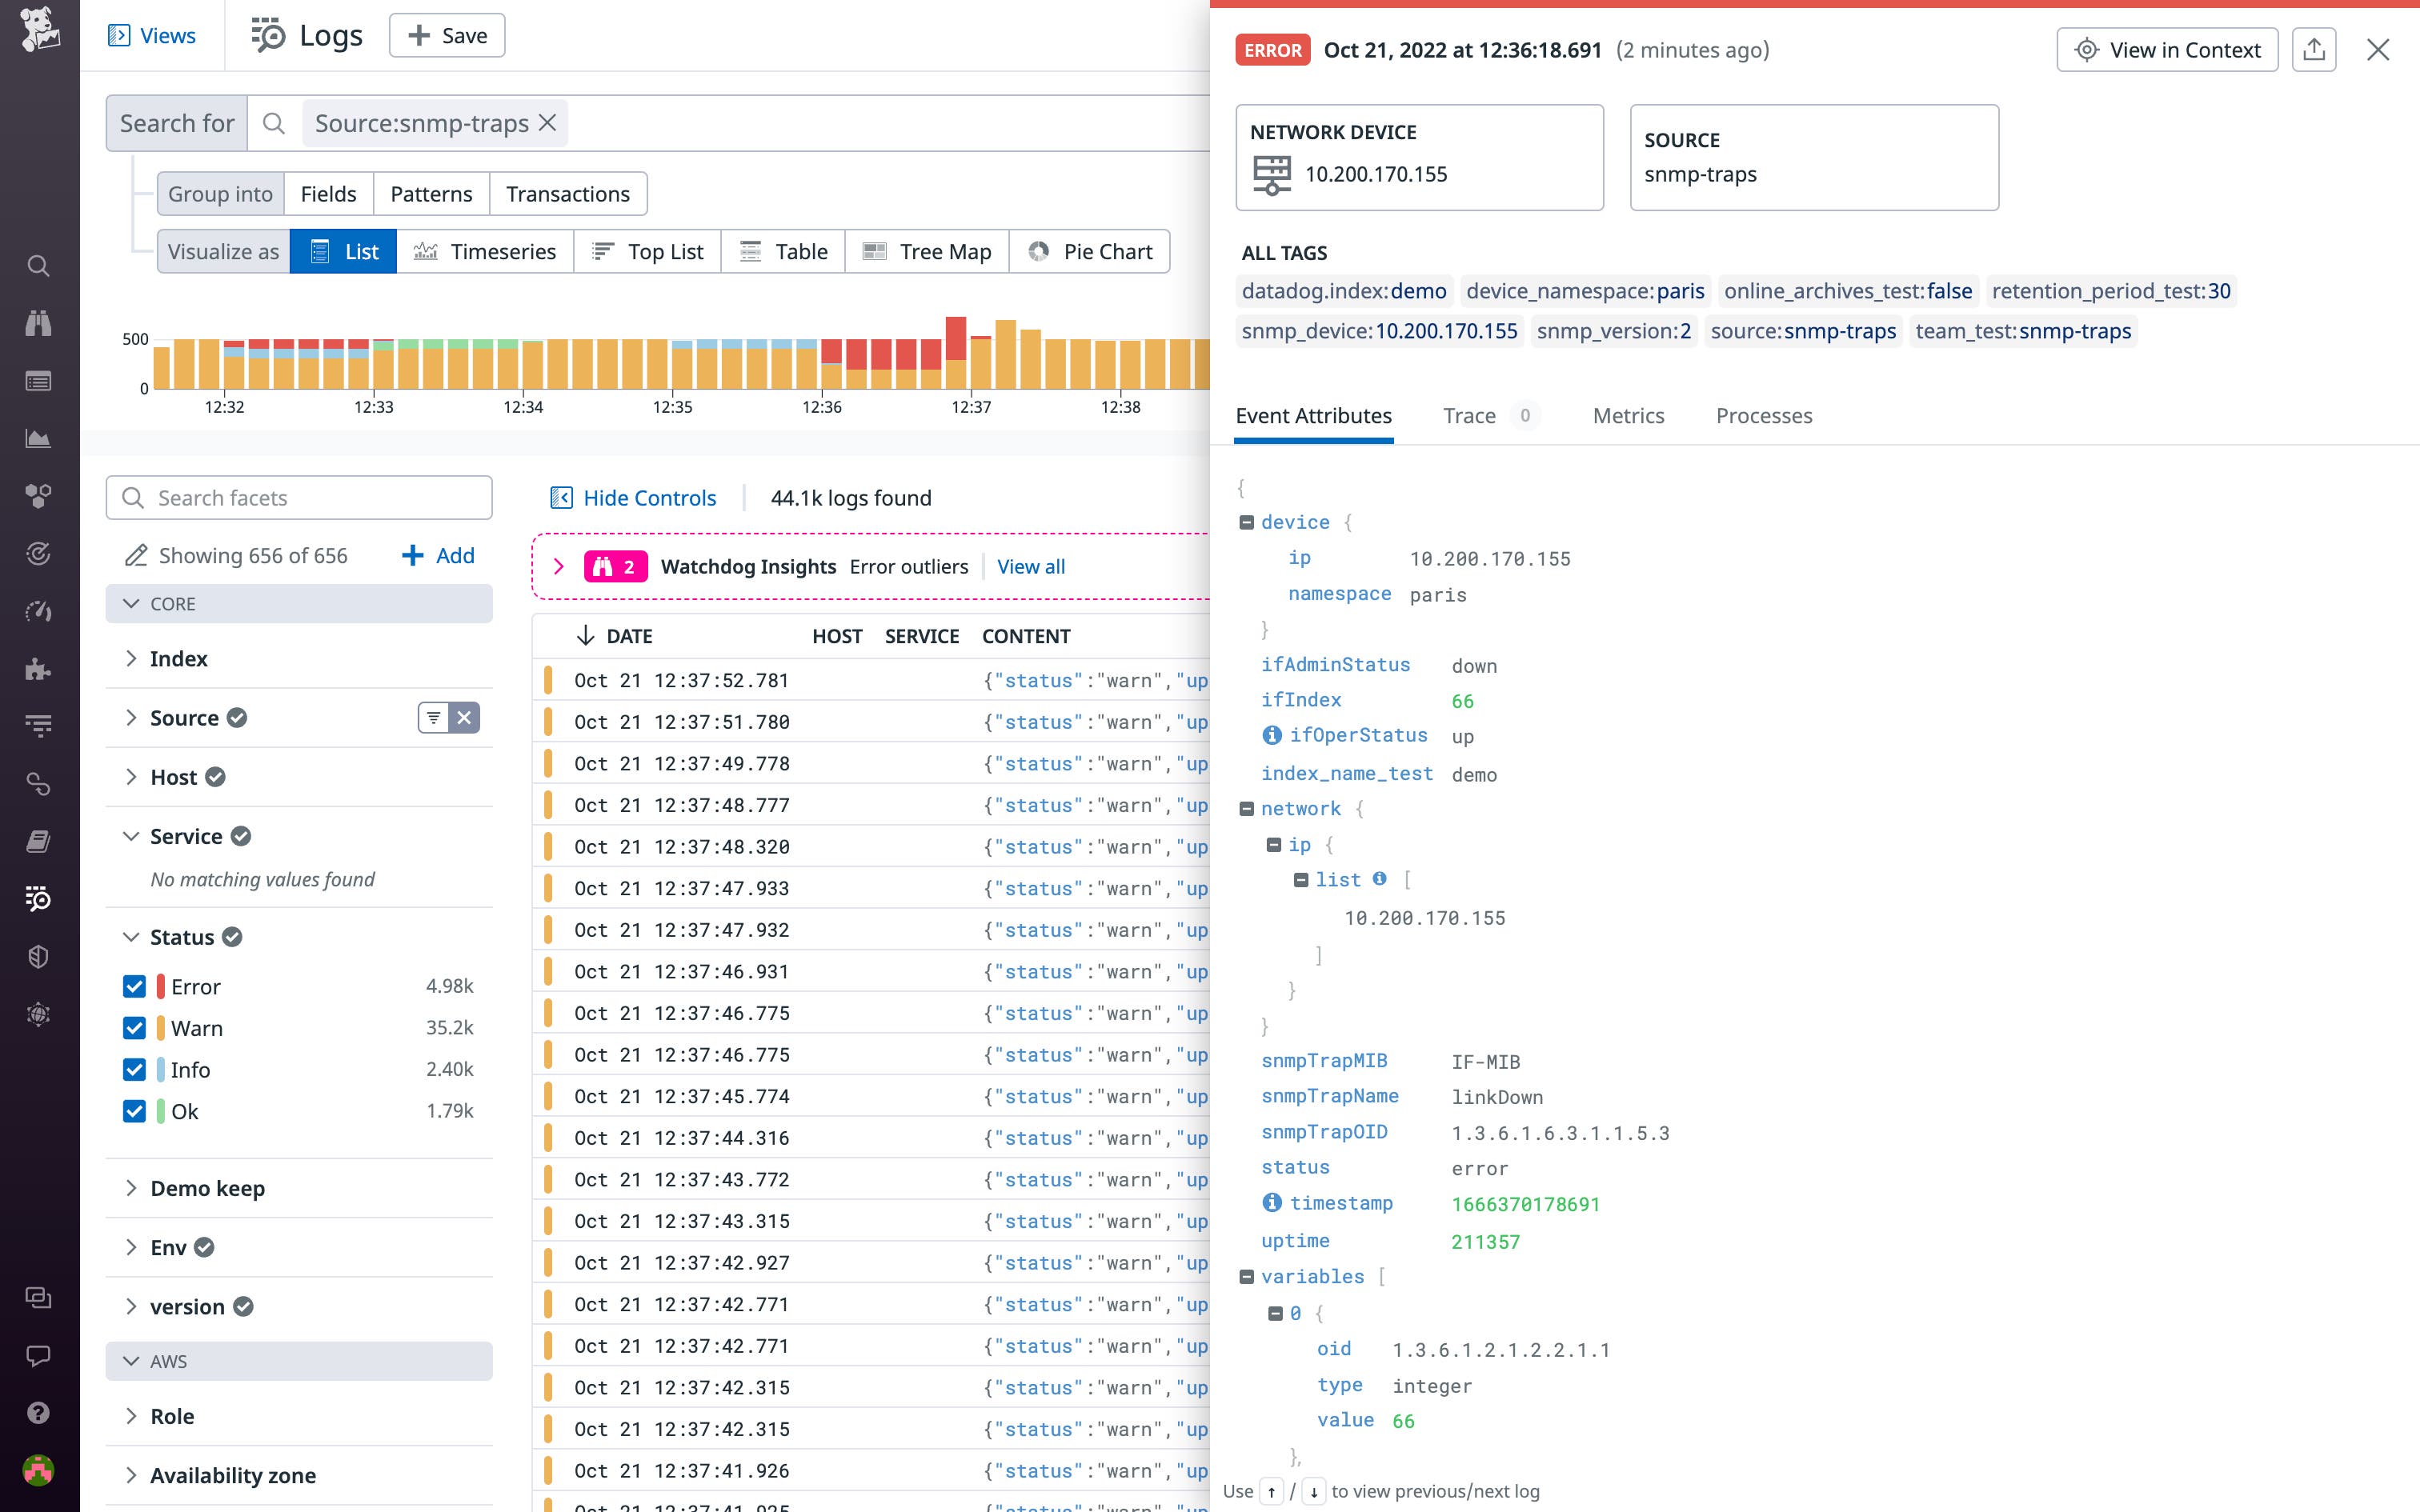
Datadog Network Device Monitoring (NDM) provides real-time health and performance data for network engineers and organizations, monitoring entire fleets of on-premises equipment, including routers, switches, and firewalls. NDM polls these devices with Simple Network Management Protocol (SNMP)—but issues that occur outside of polling periods, as well as hardware failures, aren’t picked up by SNMP. To fill in these gaps in visibility, Datadog NDM now collects SNMP Traps. SNMP Trap events are triggered by network devices when they encounter unusual activity, such as a sudden state change on a piece of equipment, enabling you to catch critical network issues right when they happen. You can set up Datadog monitors on specific SNMP Trap events to receive alerts via email, ticketing tools like ServiceNow, or mobile device notifications to guarantee a rapid response. From there, you can use these alerts to troubleshoot with tools such as Log Patterns, which helps you identify related Traps from other devices, or by analyzing the health of your entire network using the Network Devices page, which visualizes key metrics from all of your network devices and across every layer.
Learn more about SNMP Traps via our blog.
Visualize IP traffic flows with NetFlow Monitoring
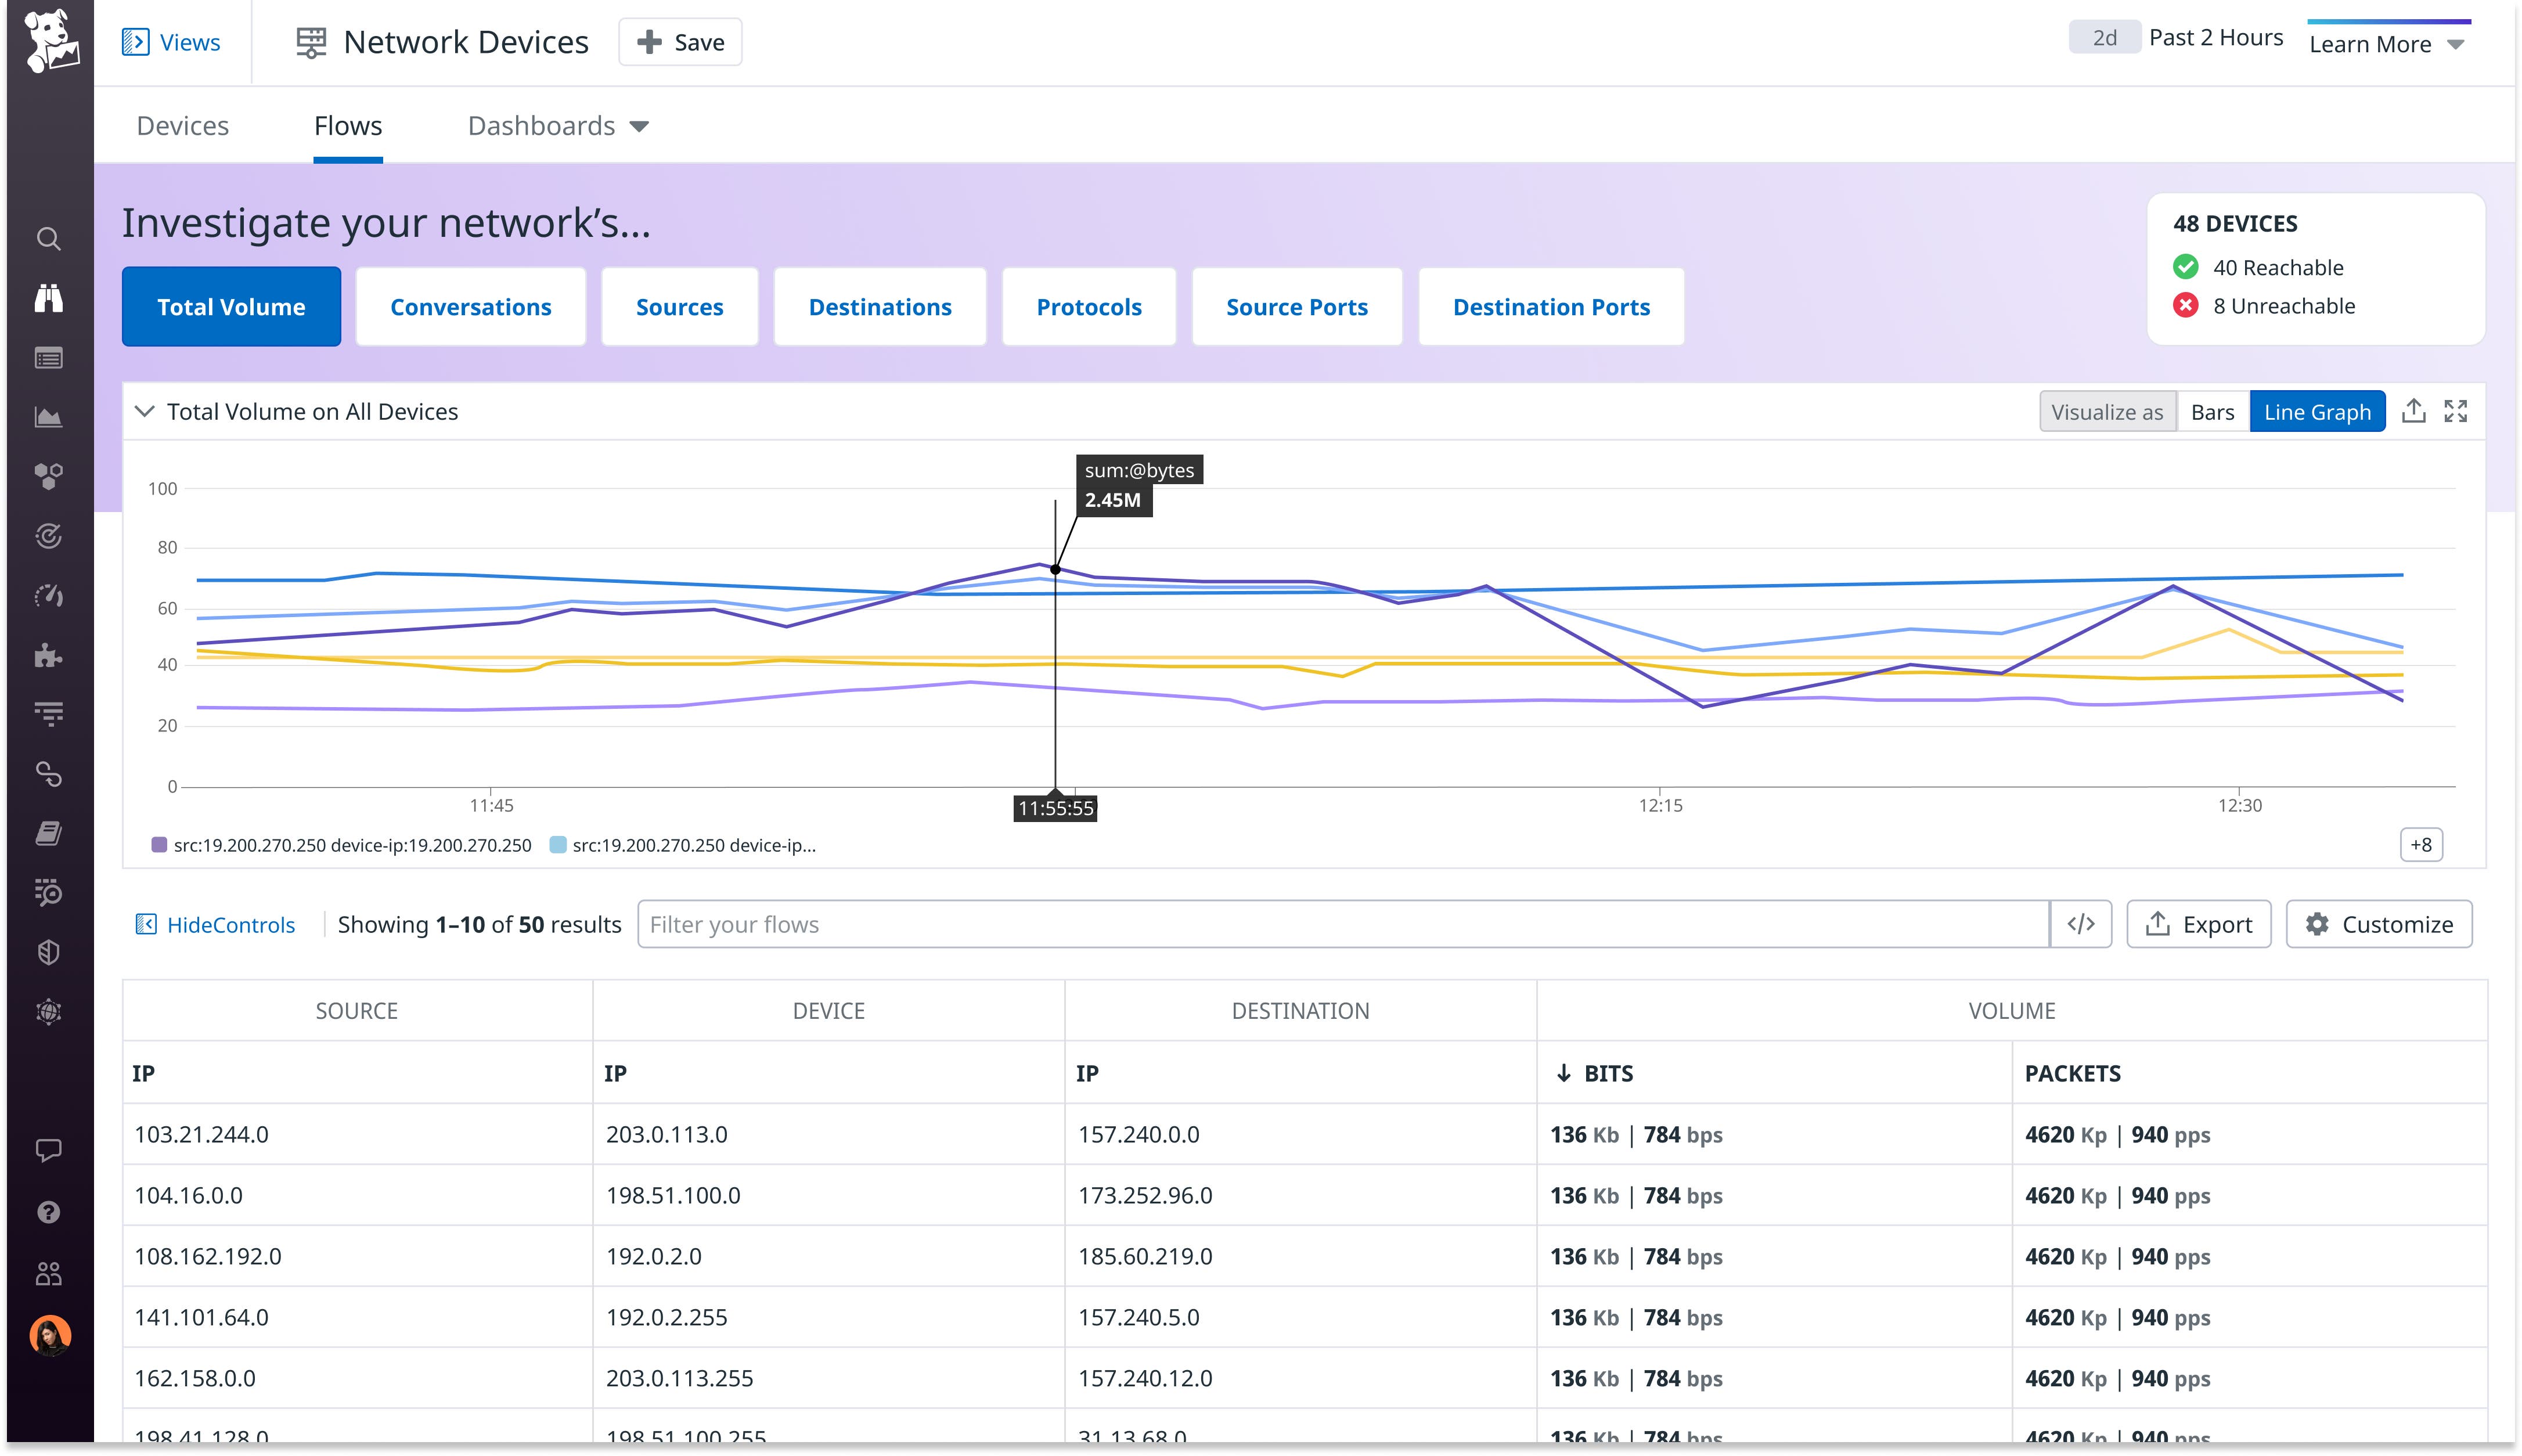
For complete visibility into network health, organizations need directional, flow-level information from network equipment—that’s why NetFlow has become a popular protocol for monitoring IP traffic flows across a mesh of network devices. Datadog Network Device Monitoring (NDM) now supports NetFlow traffic monitoring, so you can configure all of your devices to send NetFlow data to Datadog via the Agent. By using NDM to measure your NetFlow traffic, you can break traffic down by facets like device, port, and protocol. This way, you can easily find the top talkers (applications or devices) on a specific router to debug network congestion, audit the bandwidth consumption of each of your teams, and much more. NetFlow Monitoring is now available for Datadog customers as a public beta. For more details, see our documentation.
Log Management
Observability Pipelines Configuration Builder
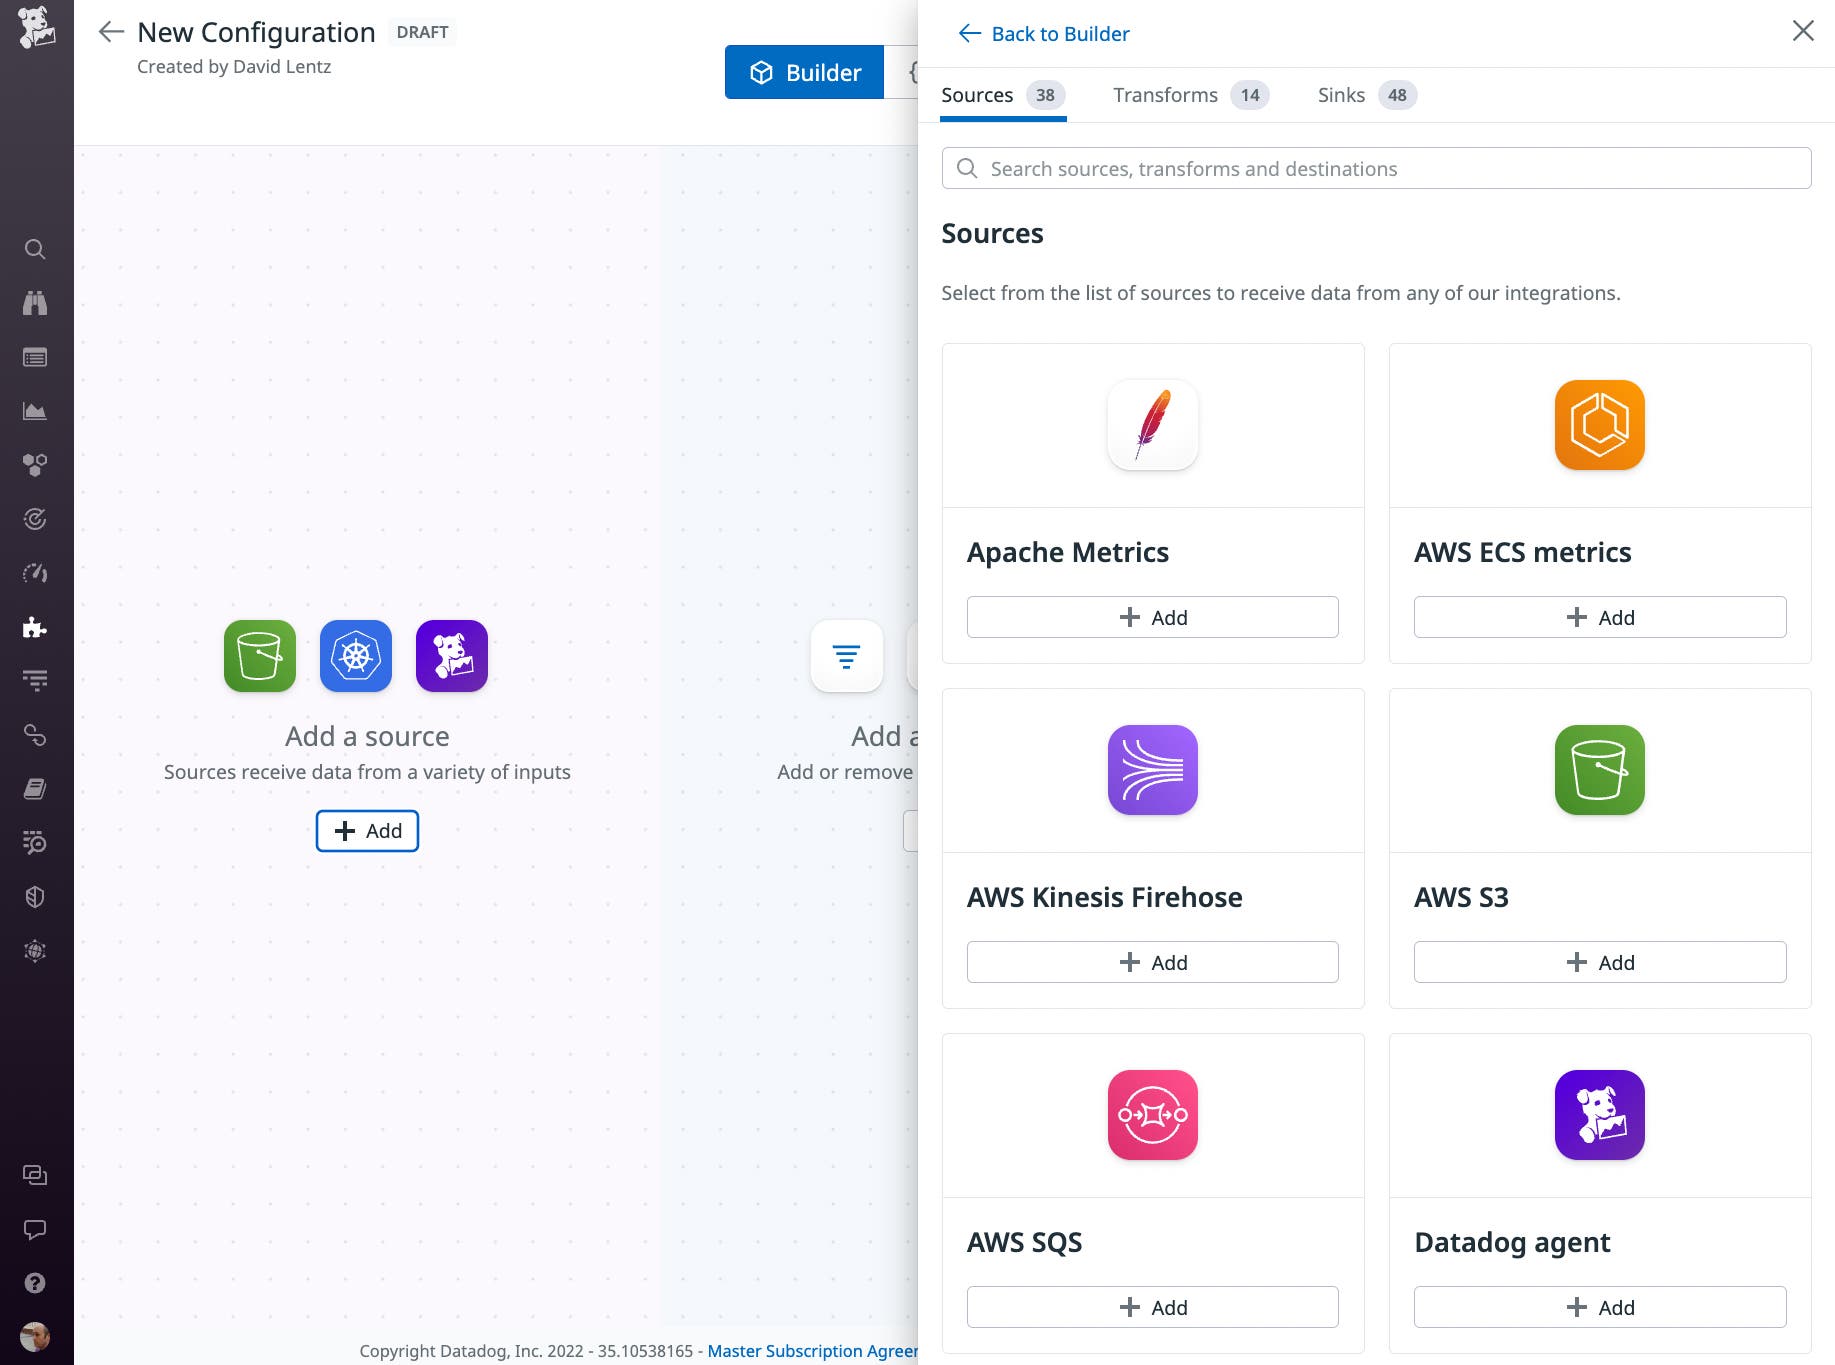
Datadog Observability Pipelines enable you to ingest, transform, and route your observability data from any source to any destination at petabyte scale. To give you even greater control over your growing volume of telemetry, we’re introducing Observability Pipelines Configuration Builder, which lets you create and manage your pipelines with a simple-to-use UI. You can easily modify pipeline sources, destinations, and processing rules using a drag-and-drop editor, and Configuration Builder visualizes nesting relationships among your pipelines. See the documentation for more information on how you can start using Observability Pipelines.
Log forwarding to custom destinations
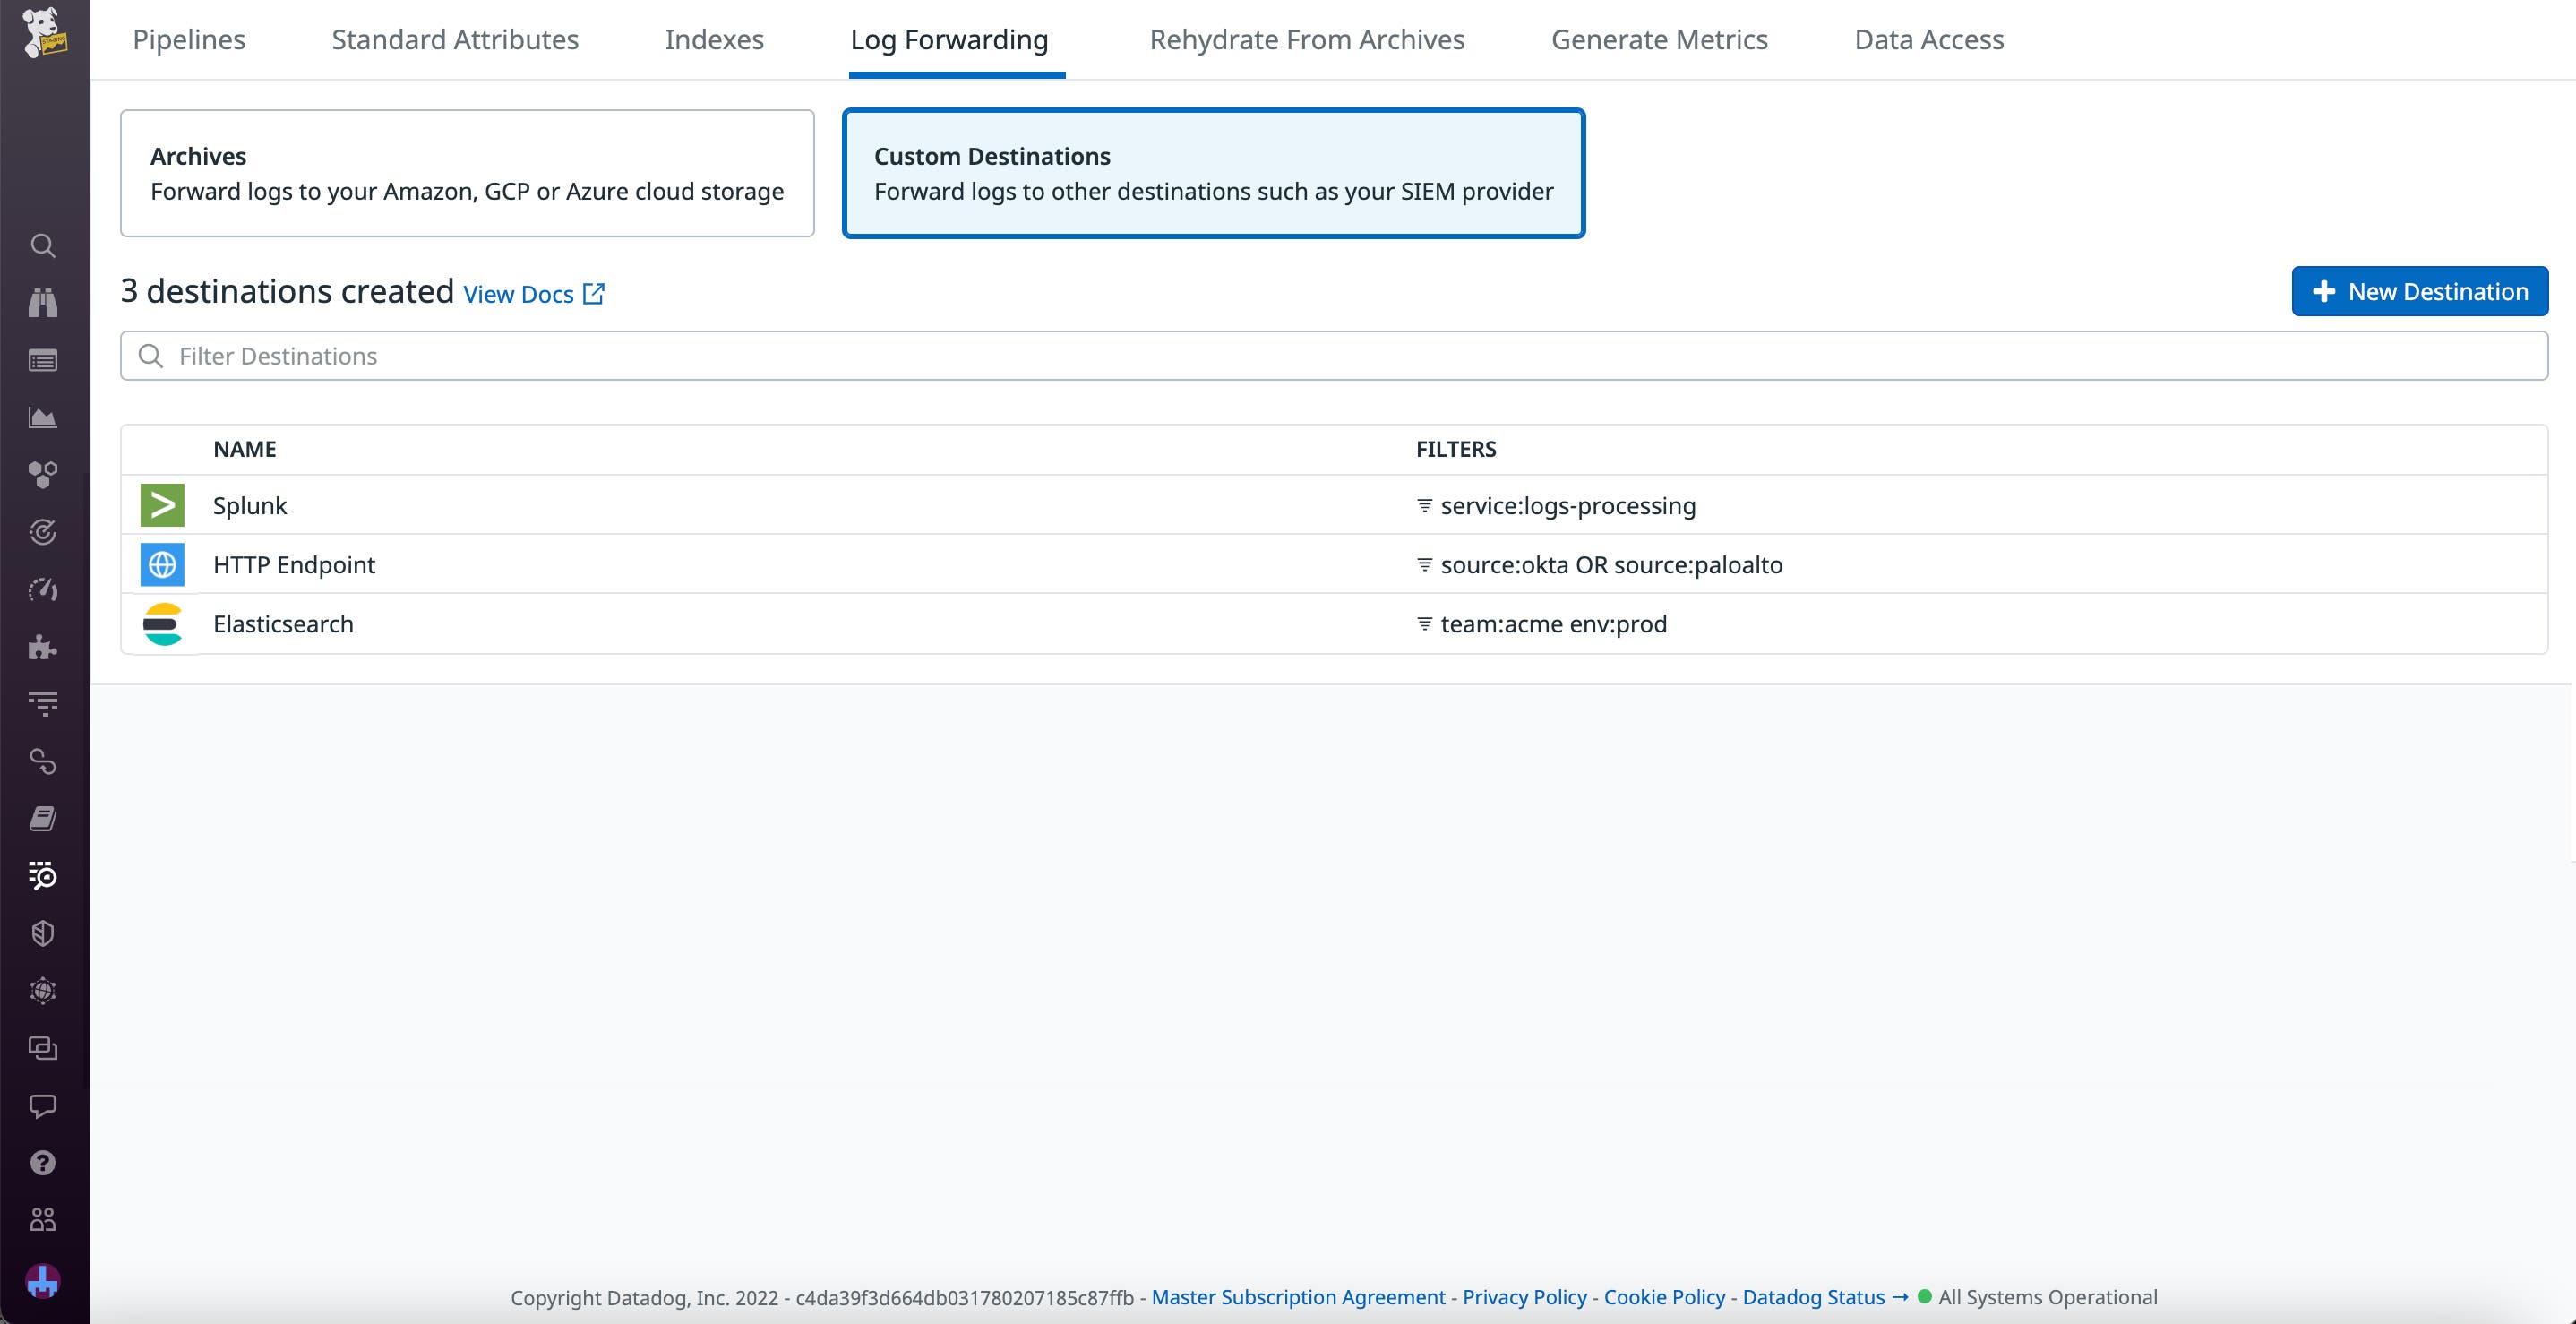
In large organizations, teams often rely on a variety of platforms for ingesting and analyzing logs, which can lead to tool sprawl and make it difficult to enforce logging standards. Datadog Log Pipelines enables you to centralize your log processing activity, but you still face the challenge of distributing these logs back to your teams. To help with this, Log Pipelines now allows you to forward your logs from Datadog to Splunk, Elasticsearch, and HTTP endpoints. With Log Forwarding, you can quickly and easily configure custom destinations, secure them with RBAC, and start automatically routing your processed logs across platforms. This allows you to centrally collect, parse, and standardize your logs in Datadog while still providing each team in your organization with the flexibility they need to work effectively. Log Forwarding can help you accommodate existing workflows as you migrate to Datadog Log Management, streamline communication between teams using different platforms, maintain local backups for compliance, and easily collaborate with external organizations on projects. Check out our blog post to learn more.
Log anomalies as alerts
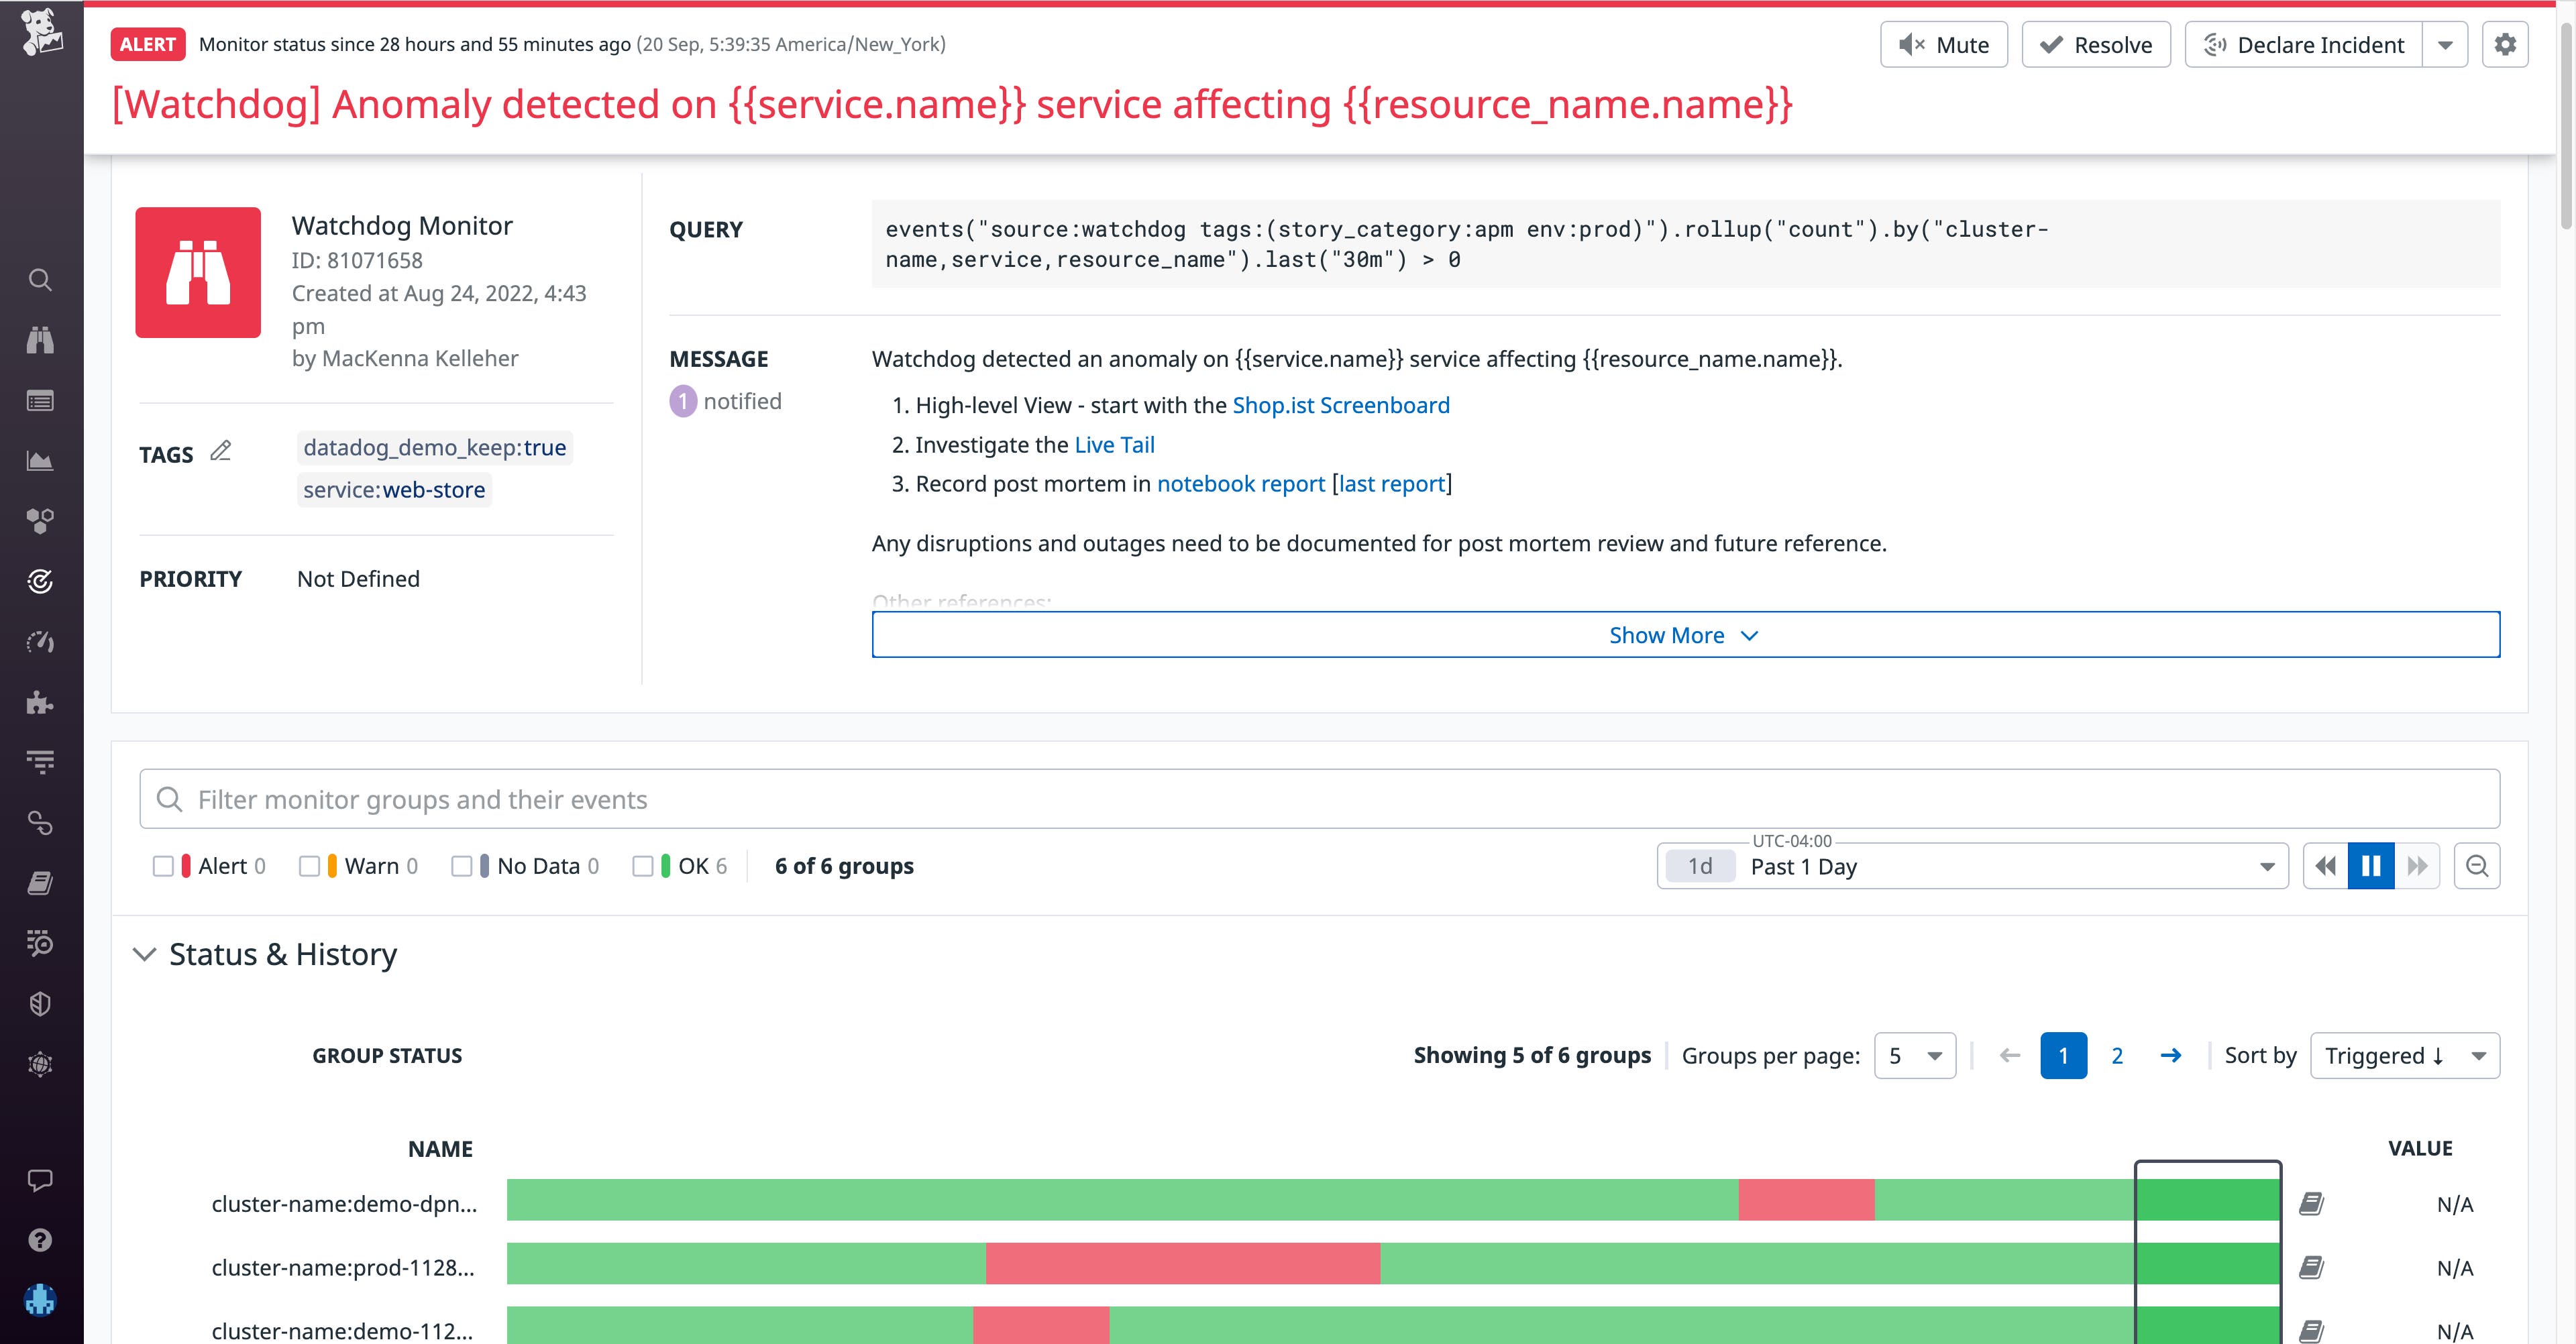
Monitors are critical for staying on top of issues in your application. However, creating effective monitors requires you to determine the likely causes of future incidents, which requires experience resolving issues in your infrastructure—but even experienced team members are vulnerable to unknowns. Now, you can create Watchdog monitors powered by Datadog Log Anomaly Detection (LAD) and scope them by environment, service, source, and status. LAD-powered monitors automatically scan your logs to surface anomalous behavior without requiring a lot of guesswork or knowledge of previous incidents. For example, you can scope an LAD-powered monitor to scan only your production environment logs for issues (e.g., new error patterns and spikes in error patterns) and alert you to them as they arise. Additionally, LAD-powered alerts stream into the Watchdog Alerts feed, so you can discover anomalies that will help you make continuous improvements to your application without the pressure of an ongoing investigation. To take advantage of LAD-powered monitors, sign up for the Preview here.
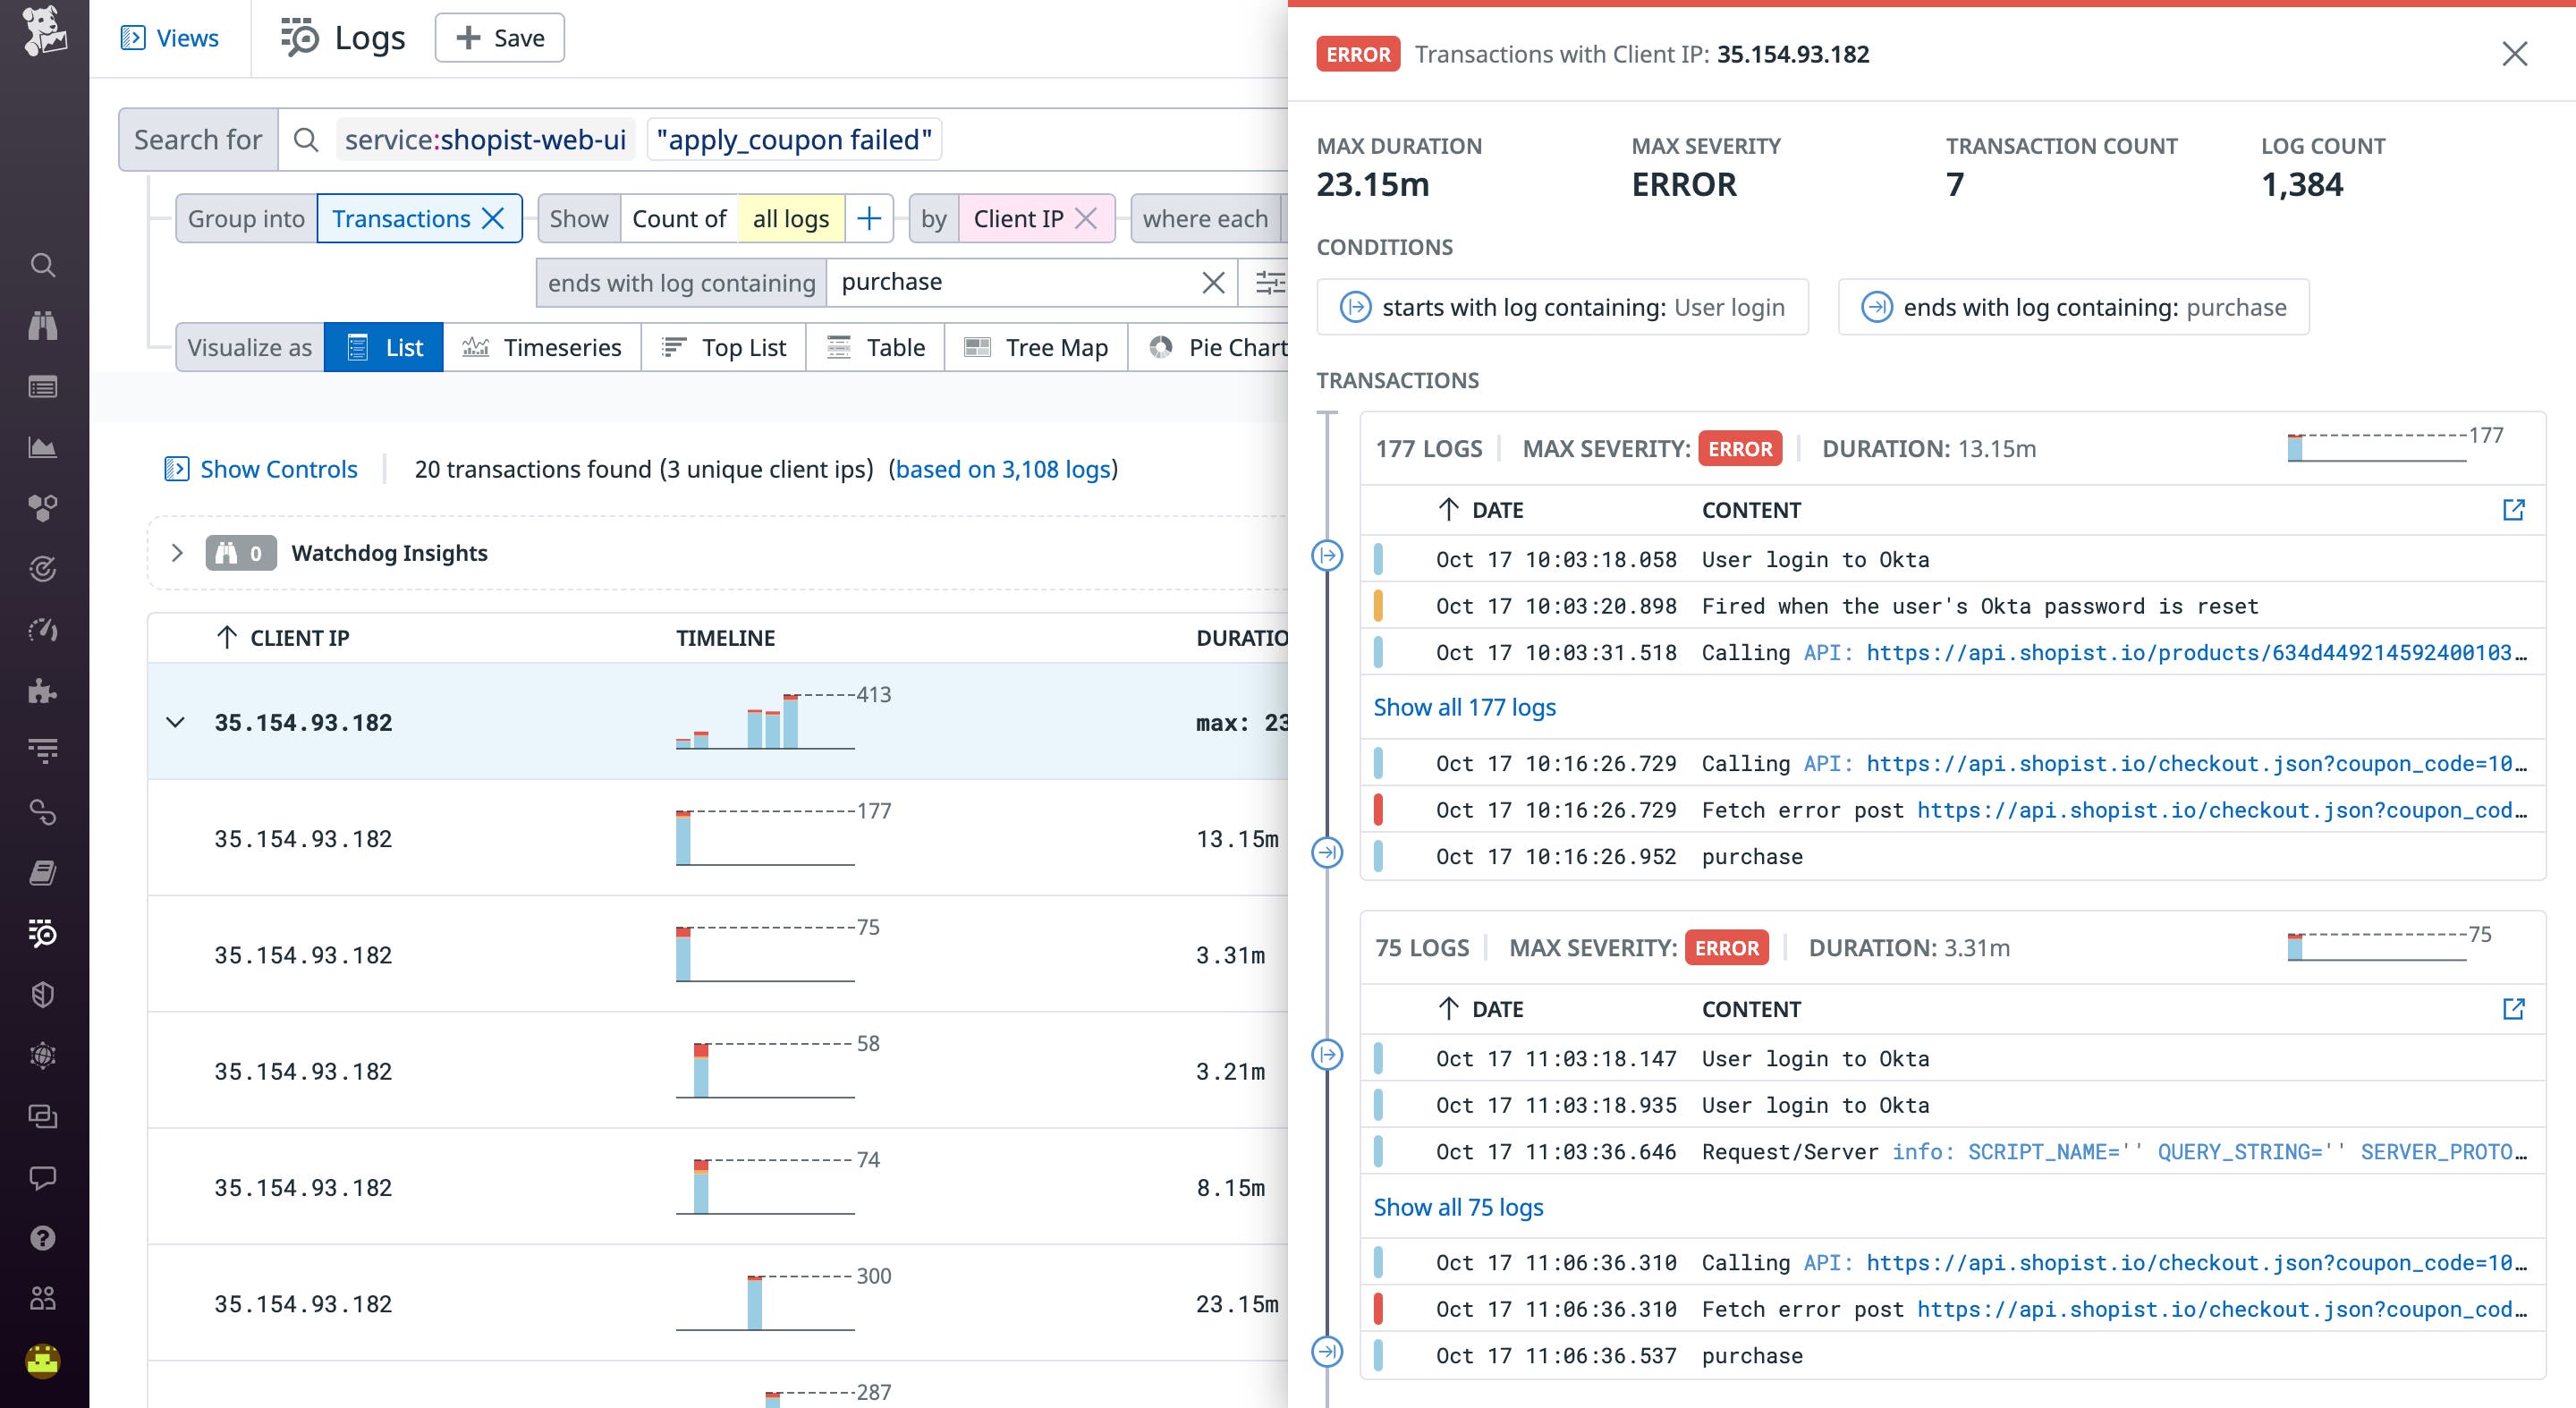
Build multi-step queries with Log Transactions
Logs give you important visibility into business activity, as they can capture user behavior and details of your application requests and sessions. Log Transactions help you aggregate your logs into sequences of events based on a unique identifier, making it easier to analyze your business activity and troubleshoot errors. For example, grouping logs into transactions can give you end-to-end context around requests as they propagate across your entire tech stack. However, in practice, transactions often comprise smaller journeys, such as steps in a checkout or jobs in a CI/CD pipeline. Now, Datadog allows you to build multi-step queries by defining the start and end condition of the sub-transactions you want to monitor. Splitting transactions into meaningful steps like this gives you more granular visibility into your systems or your users’ behavior, such as calculating important metrics for each step and facilitating deeper business analysis. Learn more from our documentation.
