
Addie Beach

Priyanshi Gupta
Flutter is a popular open source framework that allows you to build, test, and deploy high-performance, multi-platform applications with a single codebase. Developed by Google, Flutter is backed by a robust developer community and is compatible with the latest native functionalities, including iOS Metal.
Flutter's native debugging tools can be useful for investigating ad hoc issues, but these tools won’t give you the full context you need to understand user sessions and troubleshoot past errors. To provide deep visibility into your user experience (UX) across iOS and Android devices, Datadog Mobile Real User Monitoring (RUM) offers support for Flutter. And because RUM also gives you full visibility into hybrid apps, you can access all your session events in a single view, no matter their source. In this post, we’ll show how Datadog can help you:
Gain insights into user journeys
Flutter apps adapt their layout to each operating system, so you can deliver a consistent, optimized interface for all your users, no matter which device they use. This flexibility makes it crucial to analyze data from across your iOS and Android apps—otherwise, you risk having an incomplete picture.
Additionally, Flutter's cross-platform functionality enables you to develop seamless hybrid apps. However, this can make monitoring a challenge, as you need to consolidate session information from multiple sources for each session. To effectively analyze Flutter app performance, you'll want to combine related data from your web and native mobile views for a complete picture of your user journeys and frustration points.
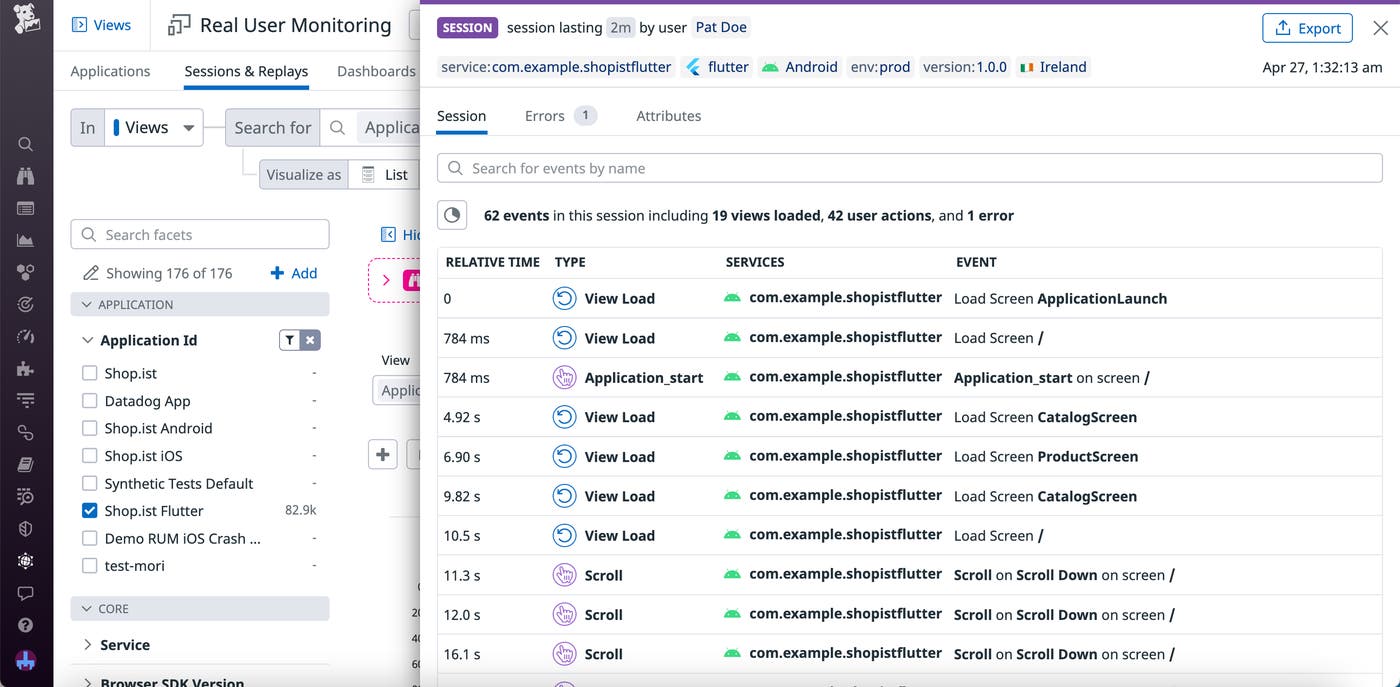
Datadog RUM automatically tags session information by OS and web or native component, making it easy to compare design efficacy across platforms and views. If you notice different conversion rates for iOS and Android users, you can drill down into sessions to figure out why. Or, if you receive complaints from users after deploying a new version of your app, you can use session information to assess where they’re running into difficulties.
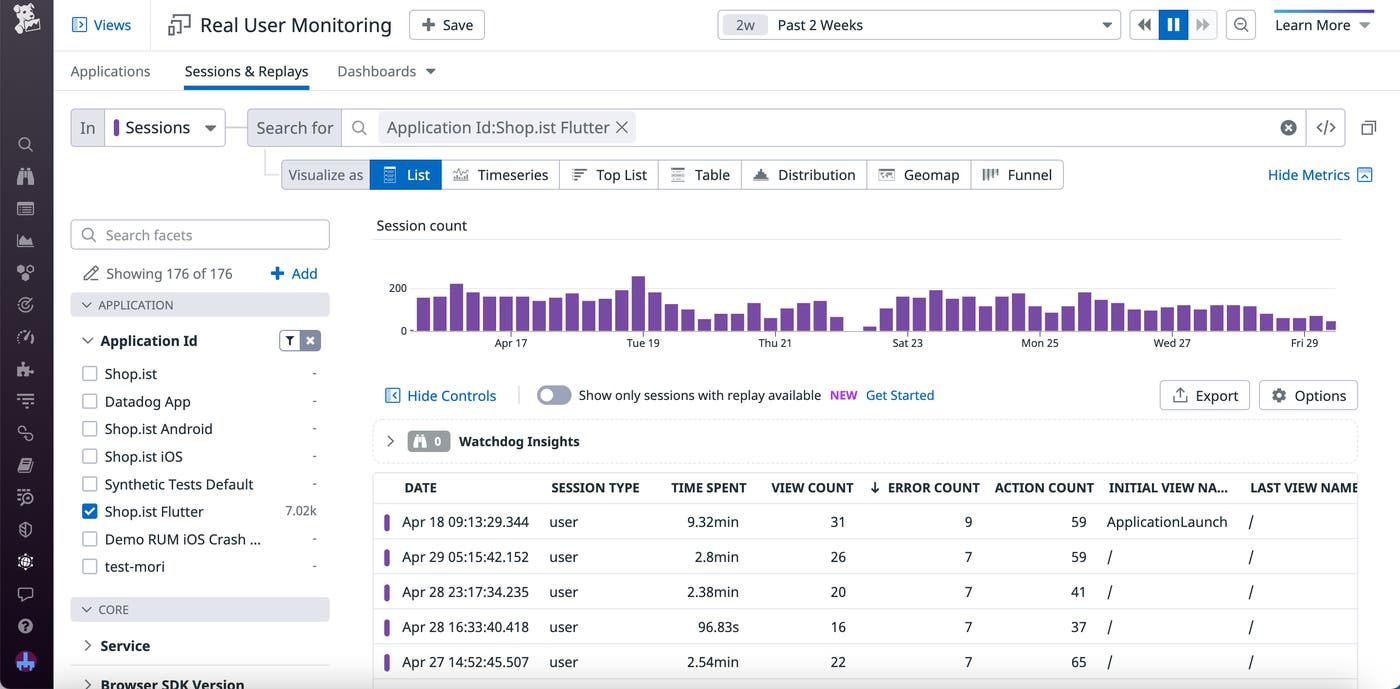
You can also pivot to Product Analytics to gather further insights for streamlining your UX. For example, if you recently added a newsletter call to action (CTA) on your app, you can use the User Journeys features within Product Analytics to evaluate your CTA's conversion rate. The funnel analysis feature in particular helps you visualize the percentage of users that complete a specific workflow, allowing you to pinpoint where you tend to lose customers. Looking at the funnel graph below shows you that customers are leaving your app without signing up for your newsletter. By pivoting to an individual session, you can then see that slow rendering times on certain views may be preventing users from being able to access your CTA. As a result, you decide to strategize ways to improve the rendering performance of those views.
Troubleshoot errors and performance issues with RUM and APM
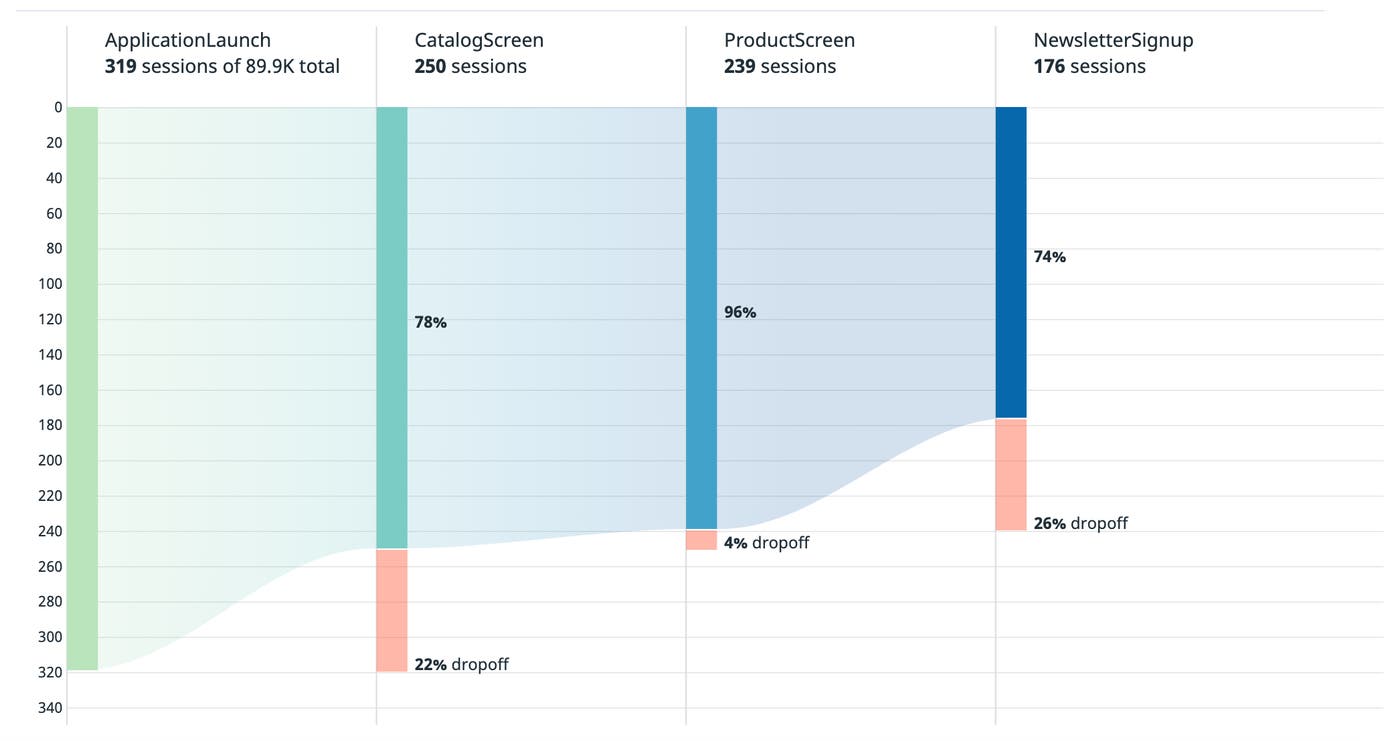
If your Flutter app runs into issues, you can quickly troubleshoot in RUM. RUM offers visibility into Mobile Vitals—including widget build and raster times, frozen frames, and poor resource usage—alongside associated events, making it easy to get insights into the causes of performance issues. For example, if you receive complaints of slow render times, Mobile Vitals can help you determine if widgets or raster threads could be the culprit.
Let’s say you receive an alert that customers are experiencing errors when attempting to make a purchase. To investigate, you can view an associated session. On the performance timeline for the session, you notice that customers are running into latency on the cart screen, so you click to inspect that view. You see that two Mobile Vitals fall outside the recommended ranges (below), which may have affected this user's experience.
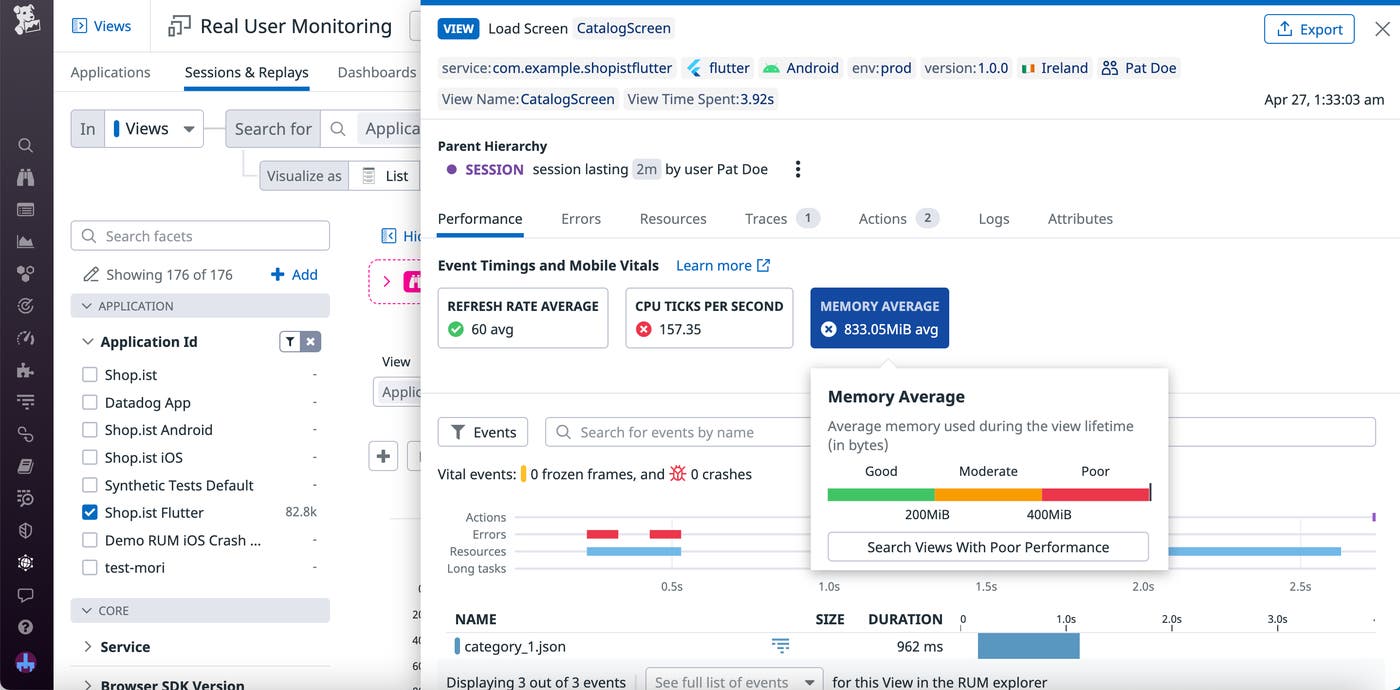
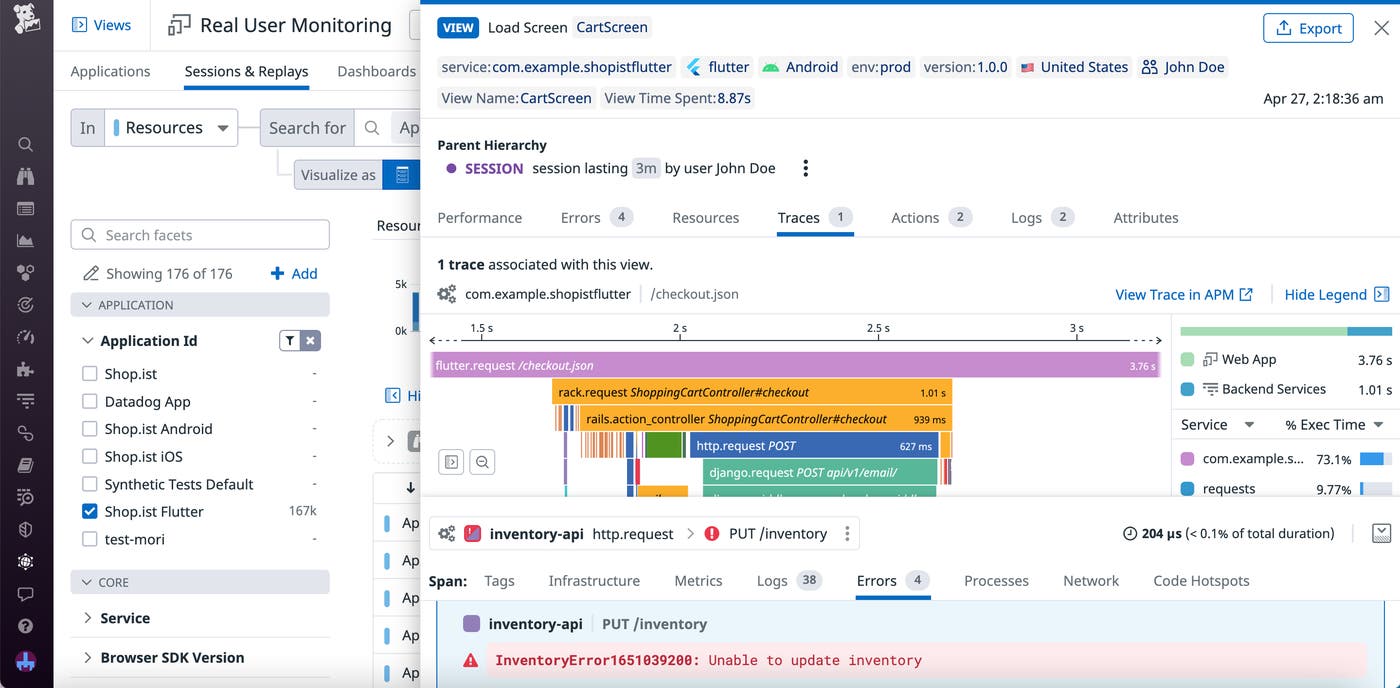
If you've configured RUM to link with APM, Datadog will automatically connect frontend requests to your app with their associated backend traces. This allows you to debug the source of user performance issues regardless of where they originate in your stack. By viewing the correlated trace from this RUM view, you’re able to pinpoint that a third-party API was having trouble connecting to your iOS app. In this instance, you may want to contact the API service's support team to see whether they’re aware of any issues involving iOS devices.
Get multi-platform visibility into Flutter apps with Mobile RUM
Datadog Mobile RUM gives you session and performance data for your Flutter iOS and Android apps, helping you resolve issues and optimize your end-user experience. With our Flutter integration, you can analyze sessions and funnels to better understand user behavior as well as leverage APM traces to ensure your users are receiving the smoothest possible experience.
If you’re an existing Datadog customer, you can install our Flutter plugin to get started. Or, if you’re new to Datadog and want to get deep visibility into your Flutter apps, sign up for a 14-day free trial.

