Thomas Sobolik
Technical Content Writer
Vercel is a deployment and collaboration platform that enables frontend developers to build high-performance hybrid websites and applications. Vercel is also the creator of Next.js, a React framework developed in collaboration with engineers at Google and Facebook in 2016. Vercel users can leverage a built-in deployment tool that manages the build and rendering process, as well as a proprietary Edge Network that caches their sites for fast retrieval. Additionally, Vercel offers Serverless Functions, which allow users to deploy serverless code to accomplish essential backend processes like user authentication, form submission, and database queries.
We’re proud to partner with Vercel to offer a comprehensive monitoring solution for your Vercel Serverless Functions and your sites’ performance. In this post, we'll look at how Datadog’s Vercel integration enables you to ingest all your function logs for analysis and long-term storage. We'll also cover how to use Datadog Synthetics to create browser tests to track the frontend performance of your Vercel-powered applications.
Send your function logs to Datadog
Vercel Serverless Functions emit two types of logs. Request logs provide HTTP request data for calls to your functions, including the HTTP response code, region, request duration, function name, memory used, and the URL path invoked. This enables you to track things like which functions are invoked most often and how well they perform. Application logs (e.g., output to console.log) let you collect additional custom log data to help test and debug your functions, as well as business data such as transaction amounts or customer info.
Monitor your function performance with request logs
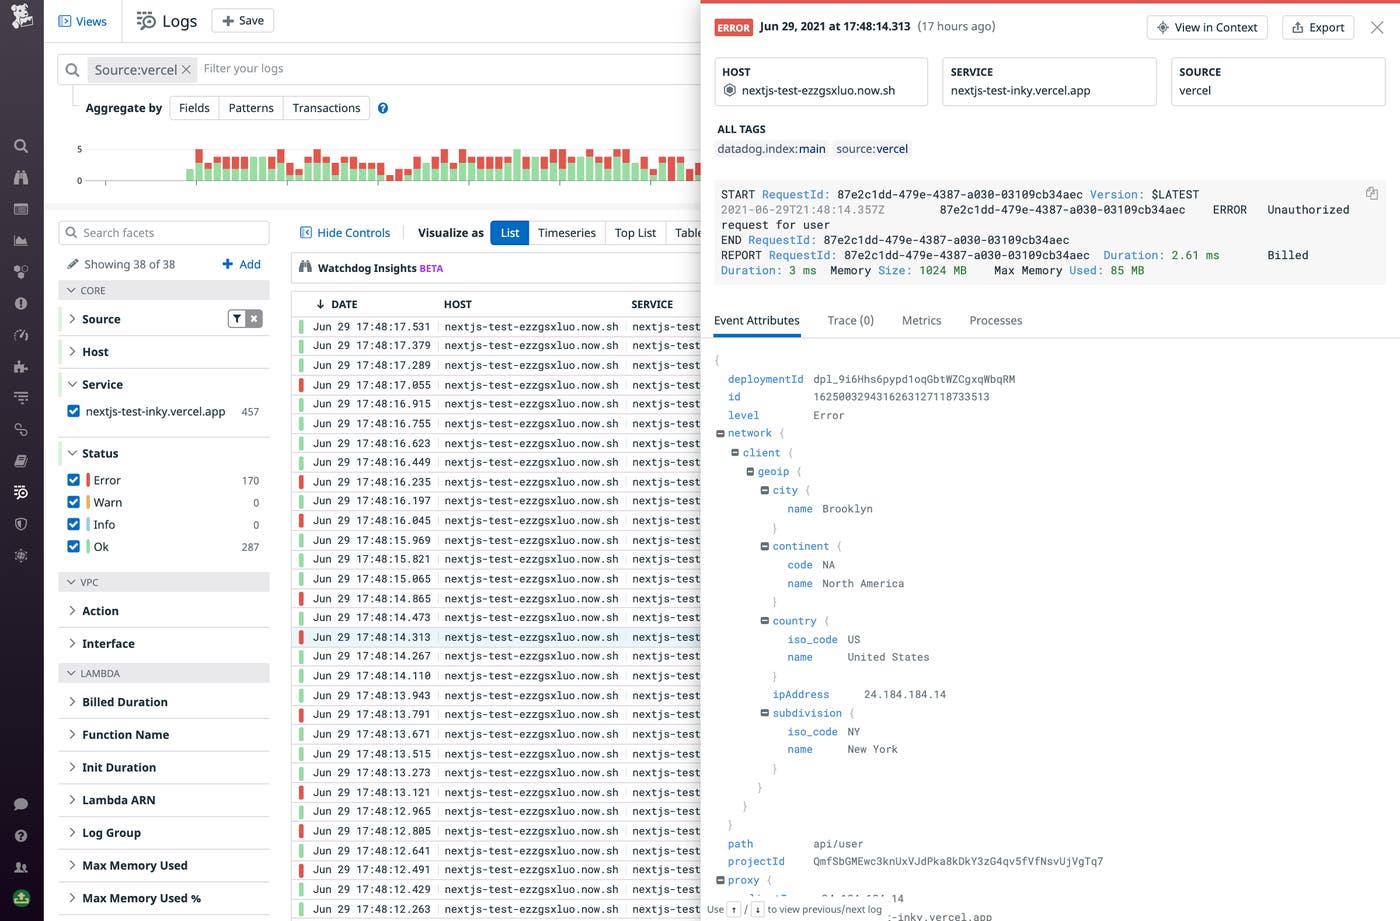
Once you set up the integration, logs from your functions will begin to stream into Datadog, where you can archive and analyze them alongside logs from across your infrastructure. Using the Log Explorer, you can quickly home in on errors by filtering to logs tagged with a particular error code, for example, and then looking for correlations with a specific region or deployment. Or, you can group error logs by endpoint URL to surface which specific function endpoints are experiencing the most errors. By selecting a log event, you can dive into the full details, such as the user’s location and browser, and the memory used by the function, for more context to understand the error. For example, you might find that your functions are using too much memory and exceeding their established limits.

Visualize key application data
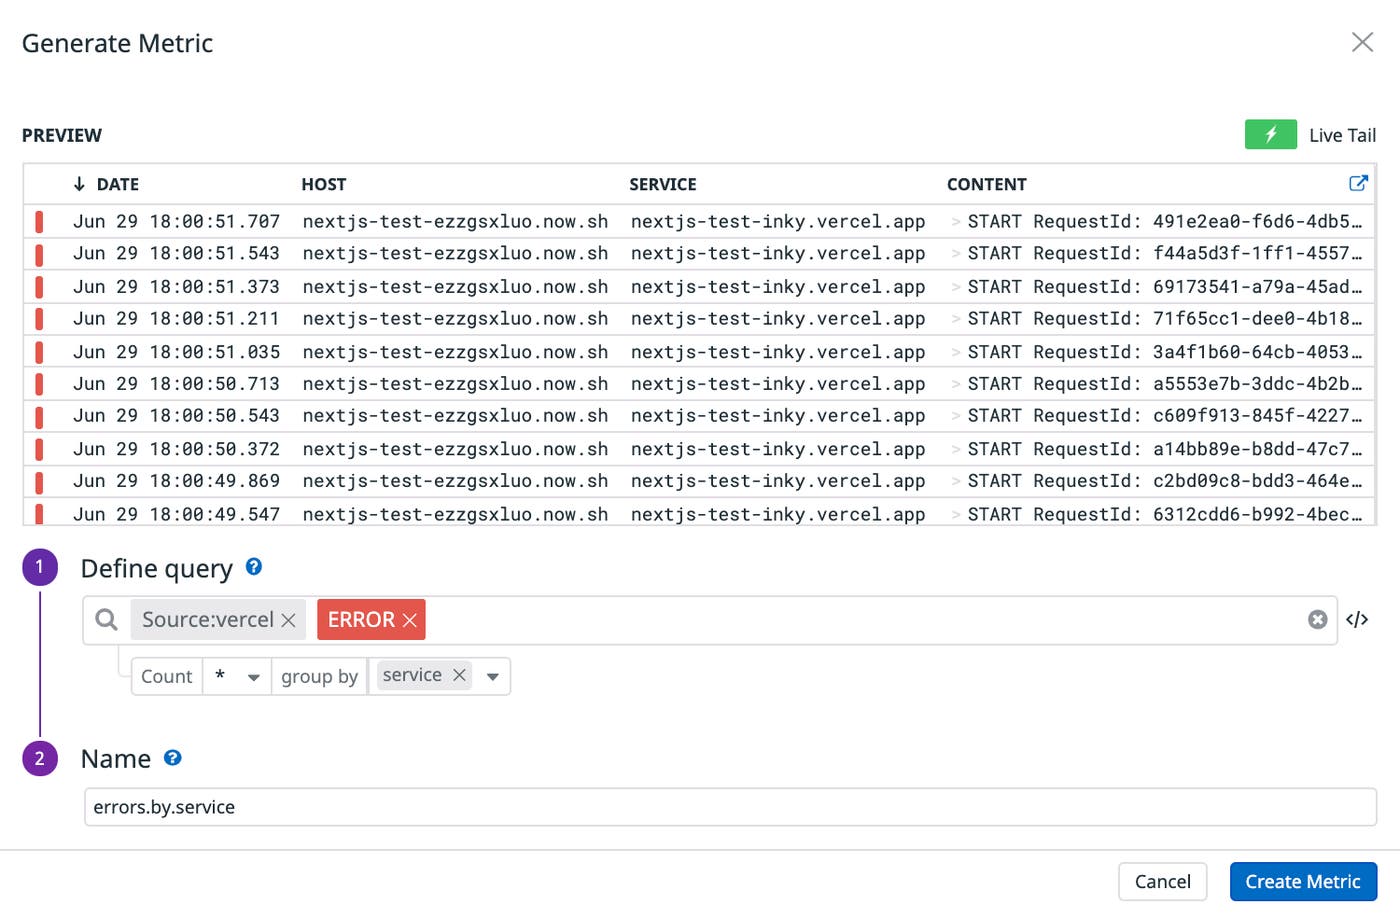
Using custom function logs, you can record additional information to generate further insights into your application and business. For example, if you manage an ecommerce app, you might want to emit a log for every successful checkout, or record the dollar amount of each transaction. You can turn these quantitative insights from your logs into log-based metrics that you can store, visualize in dashboards, and alert on.

Monitor your Vercel-powered frontend with browser tests
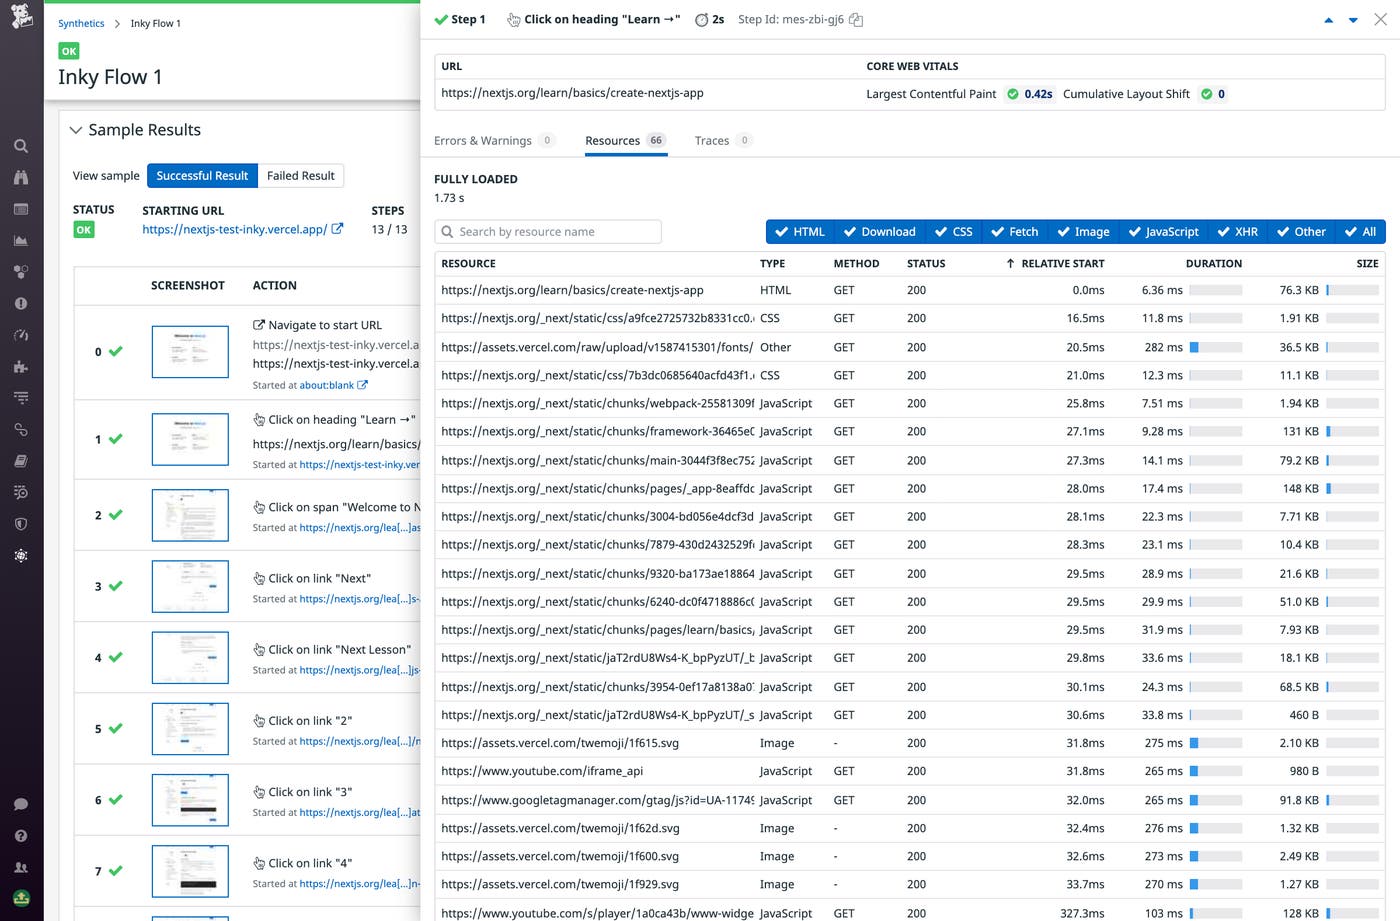
In addition to collecting function logs to monitor the health of your serverless backend, you can integrate Datadog Synthetic tests into your deployment pipeline to monitor the performance of your application's frontend whenever you initiate a deployment. For example, you can use browser tests to ensure that important user journeys work as expected by timing and collecting request data for each asset load in multi-step UX flows.

Browser tests measure key frontend performance metrics for each step in a user journey, including the Largest Contentful Paint and Cumulative Layout Shift of the page load. Datadog also tracks the duration of each asset retrieval required to render the page (e.g., style sheets, JavaScript files, images) and surfaces any errors thrown. This helps you verify that Vercel’s Edge Network is serving your content efficiently enough to meet your SLAs.
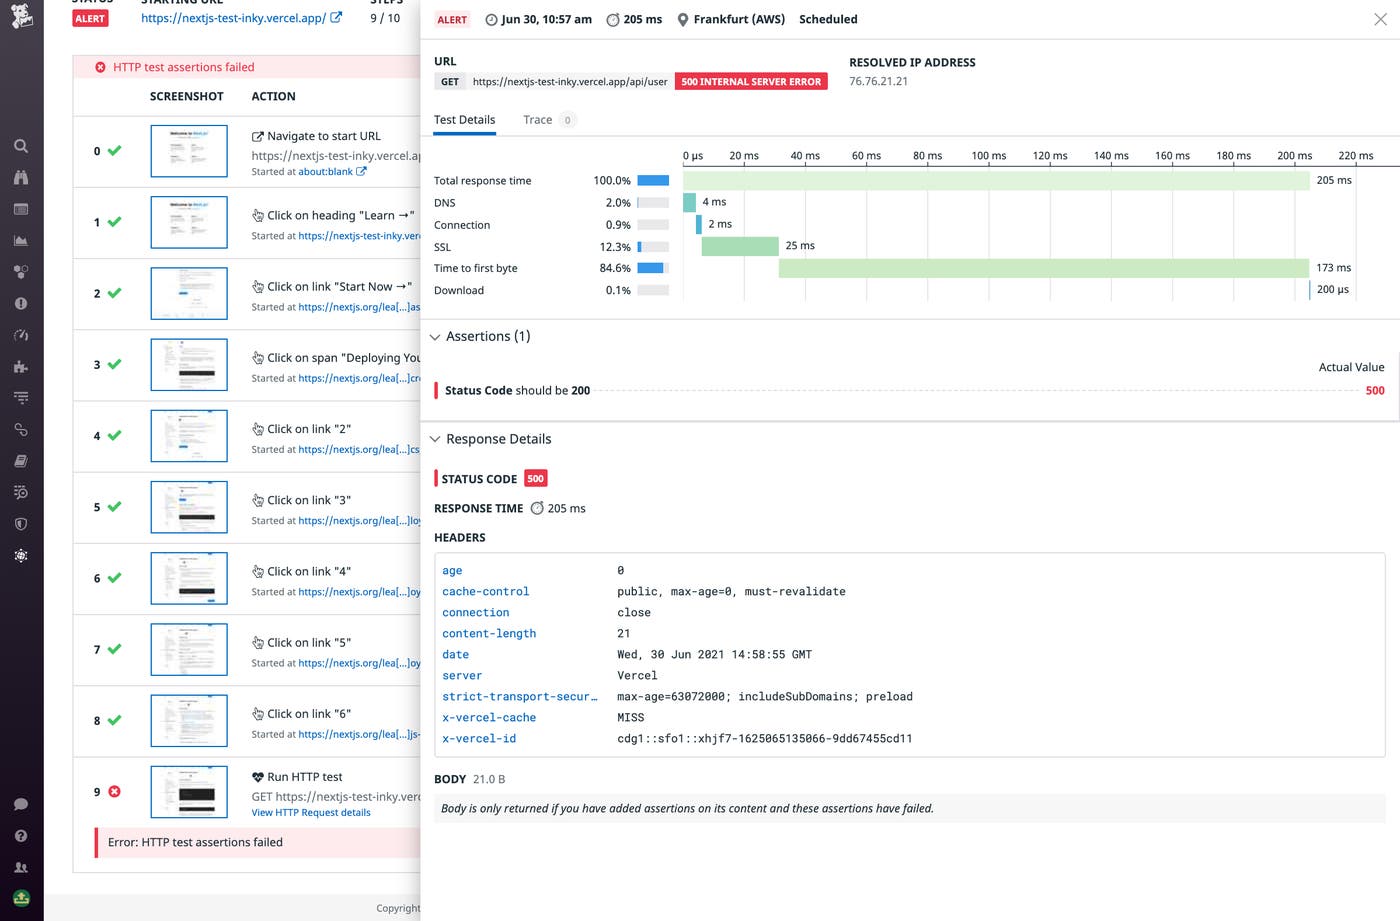
By adding HTTP request steps to your browser tests, you can also see this data for calls to your serverless backend, including the URL path, HTTP method and status code, duration, and request size. With all of this data available in one place, you can understand how your Vercel Serverless Functions’ behavior fits into the end-to-end performance of common user flows.

Monitor your Vercel-powered sites
With Datadog, you can easily ingest Vercel logs for full visibility into the health and performance of your Vercel Serverless Functions. And, by using Datadog Synthetic Monitoring to track frontend performance, you get a comprehensive solution for monitoring your Vercel-powered applications. Sign up for a 14-day free trial to get started with Datadog.

