Candace Shamieh

Tanja Garcia

Mary Jac Heuman
When your team experiences an incident, the tools you use to respond can make all the difference in how quickly you resolve the problem. An effective incident management plan depends on accessible, integrated tools as well as direct channels of communication. Even after the incident has been resolved, documentation and analysis are vital steps that prevent similar issues from occurring in the future.
With Datadog Incident Management, your teams can easily manage an entire incident end to end directly in the Datadog platform, even if you are using other tools or monitoring platforms. Incident Management offers a diverse set of integrations, like Slack, Zoom, Opsgenie, PagerDuty, and Microsoft Teams, so you can effectively collaborate and communicate with the right stakeholders as you troubleshoot to reduce mean time to resolution (MTTR). In addition, the Datadog platform enriches Incident Management by allowing you to use built-in or customized automated workflows, to build a response team with designated roles and defined responsibilities, or to leverage dashboards to discover and analyze the root causes of issues more efficiently. The ability to declare an incident from different places across the Datadog platform also lets you quickly triage issues, and enhanced features like the Datadog mobile app, collaborative Notebooks, and our cross-platform Clipboard allow you to resolve and document problems seamlessly. While these advantages provided by the larger Datadog platform are significant, using it is not a requirement; you can use Datadog Incident Management as a standalone product, even if Datadog is not your primary monitoring platform.
Sounding the alarms
Optimal incident management requires you to work in parallel with other systems, including your on-call management system, response teams, notification tools, services, and more. Whether you receive an alert, a customer brings an issue to your attention, or a member of your team notices a problem, you need to be able to call for an incident and notify the right stakeholders at the right time.
You can declare an incident from multiple places within the Datadog platform, such as a graph widget on a dashboard, our Incidents UI, or any alert reporting into Datadog. You can also initiate an incident response directly from Slack when you enable the Datadog Slack App. You can choose to mark incidents as private during the declaration process, ensuring sensitive information remains confidential and accessible to authorized responders only. Adding custom fields that describe the attributes of the incident provides helpful information while the investigation is open and allows for easy filtering after you resolve.
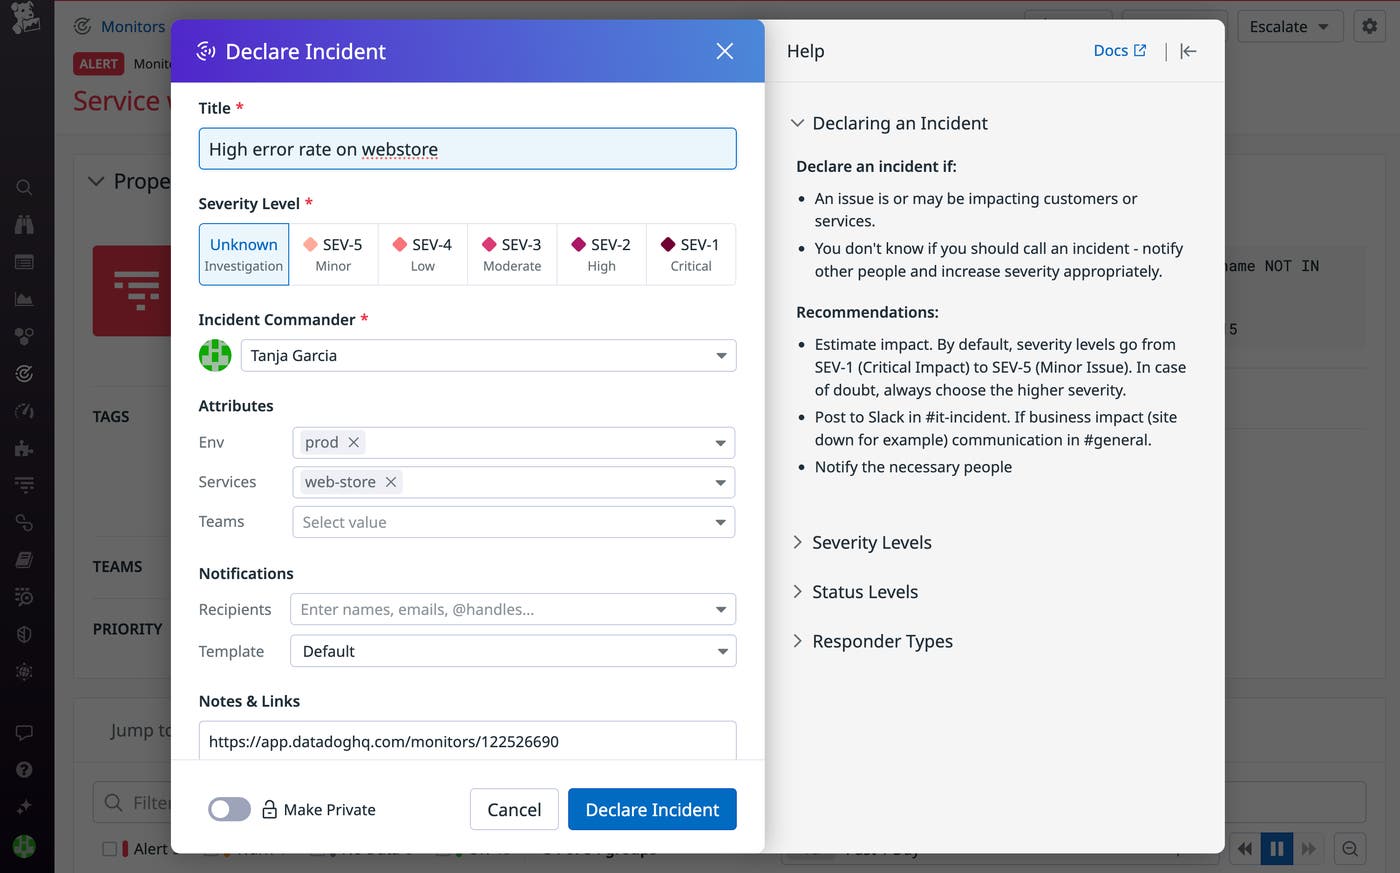
Datadog Incident Management provides you with multiple avenues for looping people in quickly. You can send ad-hoc notifications to stakeholders via email, Slack, PagerDuty, or Opsgenie anytime during the incident, from declaration to resolution. If your organization has pre-defined who will respond to specific incidents, you have the flexibility to automate the notification process with customizable rules. Rules allow you to notify stakeholders automatically based on the matching criteria of the incident. Matching criteria include incident severity, affected services, status, root cause category, a specific resource name, and more. For example, you can set up a rule that ensures your leadership team is automatically notified via email every time there is a SEV-1 incident, so the individual declaring the incident does not have to worry about knowing whom to involve in every scenario.
Using customized message templates for ad-hoc or automated notifications eliminates the need to spend time crafting messages during an incident. These templates can automatically populate the notification with relevant context from the particular incident.
When you enable the Datadog Slack App, a dedicated Slack channel will be automatically created for you when you declare an incident. If you add a Datadog Team to the incident, the Datadog Slack App will add all members of that team to the Slack channel. The Slack channel ensures that all responders receive timely updates if there are any changes to the status or properties of the incident. When you set up our Renotify feature in your notification rules, your recipients will receive a new notification whenever your selected incident properties are updated.
Accelerate mean time to resolution
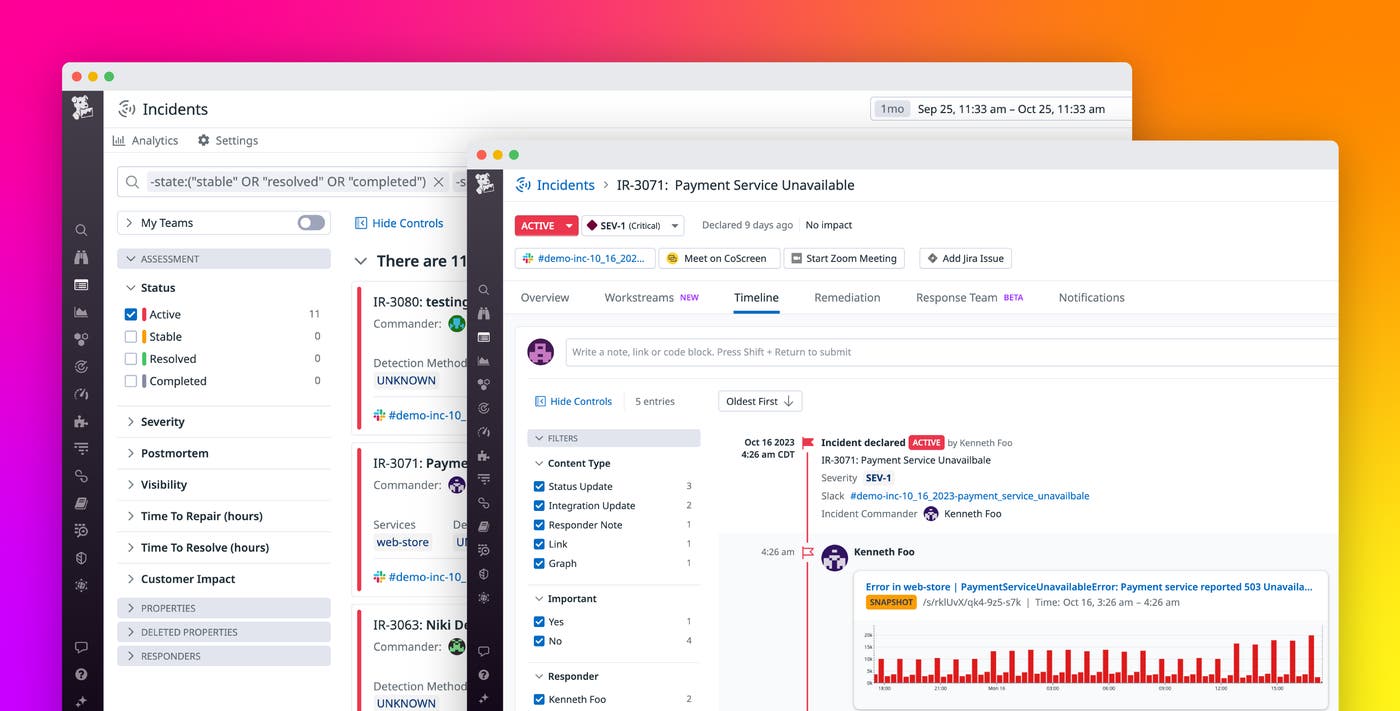
Once you’ve looped in the right people and started working on the incident, the Incident Overview page and Timeline tab ensure you don’t lose any important context during the investigation. You can pin important messages to the timeline or enable Slack mirroring to import and retain the details of your Slack conversations inside your incident timeline. The details and activity that populate in the overview and timeline serve as a convenient system of record that you and your team can reference at all times to quickly resolve incidents.
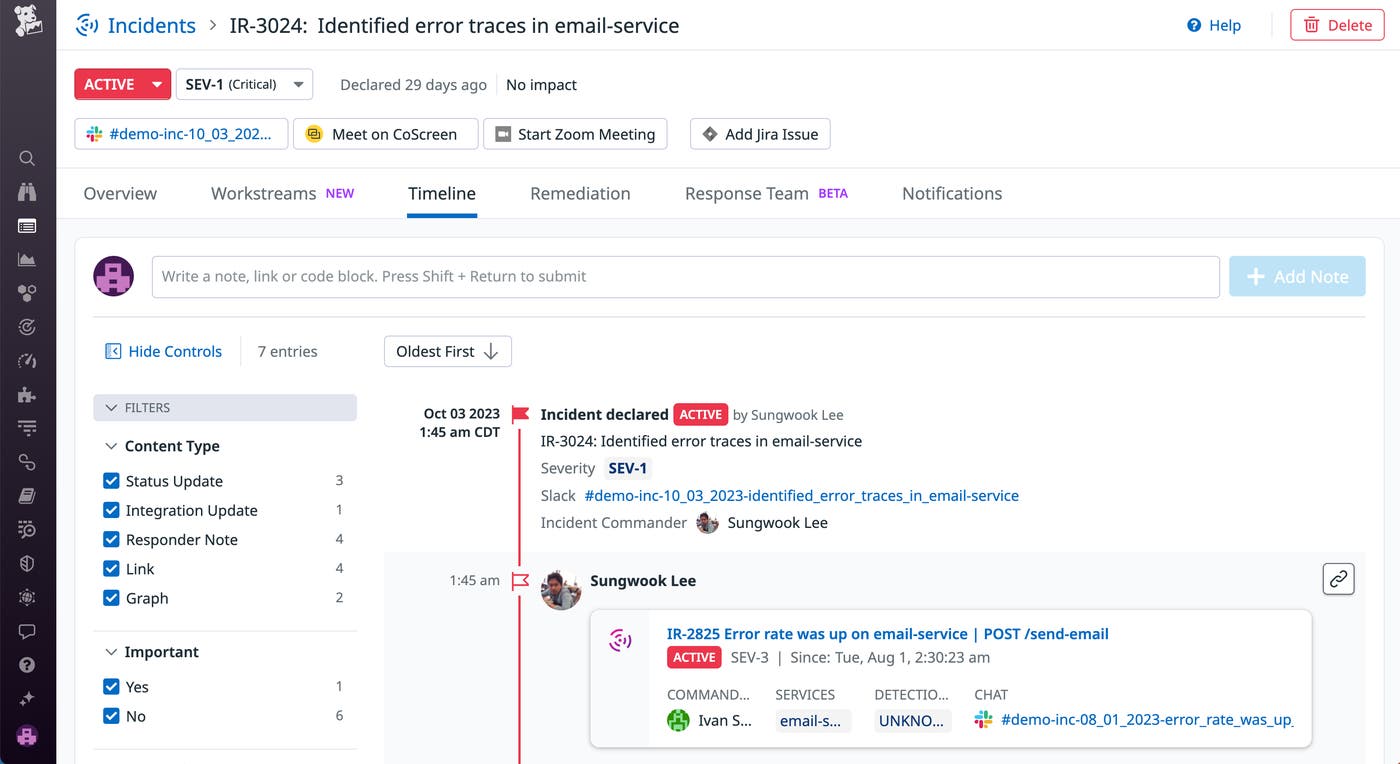
The Timeline tab shows all actions that were done in relation to the incident, including status or description updates, comments, related tickets (including Jira tickets), and Slack messages. You can also add interactive graphs from dashboards, metrics, or other relevant telemetry.
Filling out the Overview tab for the incident with relevant details—including incident description, customer impact, affected services, incident responders, root cause, and severity—gives your teams the information they need to get up to speed. The Incidents page also allows you to filter and search for specific incidents later on, providing a solid foundation for your future postmortem documentation.
Accelerate incident response with Incident AI
When alerts escalate into incidents, timely coordination is critical. Along with alert investigation, Bits helps teams stay on top of these high-stakes incidents.
Deliver clarity in chaos with real-time incident summaries and stakeholder updates
Responders who join mid-incident often have to parse through Slack channels with hundreds of messages to piece together what’s happened, what’s been attempted, and where things stand. This information overload creates delays, miscommunication, and longer time to resolution. Bits automatically generates real-time incident summaries with key details like nature, impact, contributing factors, and actions taken. You can also request an on-demand update at any time by messaging “@Datadog, summarize this incident.”
Within Datadog, teams can define custom message templates with dynamic AI-generated fields and then pair them with notification rules to automatically send updates via Slack, Microsoft Teams, email, Datadog On-Call, and other platforms. This ensures that key stakeholders like executives receive timely and relevant updates throughout the incident life cycle without adding manual work to already busy teams. Additionally, you can also ask Bits to draft a Datadog Status Page update to keep customers informed on the progress of the incident.
Proactive detection of related incidents
Recognizing related incidents is often the key to faster resolution. Bits automatically detects when new incidents are declared within 20 minutes of one another and proactively flags potential connections. This helps teams identify whether they’re dealing with a local issue or symptoms of a broader outage and avoid duplicate investigations.

Capture follow-up tasks and generate a postmortem
Once an incident is resolved, Bits will automatically post a final summary visible to everyone in the channel, ensuring a shared understanding of how the issue was addressed. It also identifies any follow-up tasks mentioned during the incident and prompts users to review and formalize them. These tasks are saved directly in the incident’s Remediation tab in Datadog.
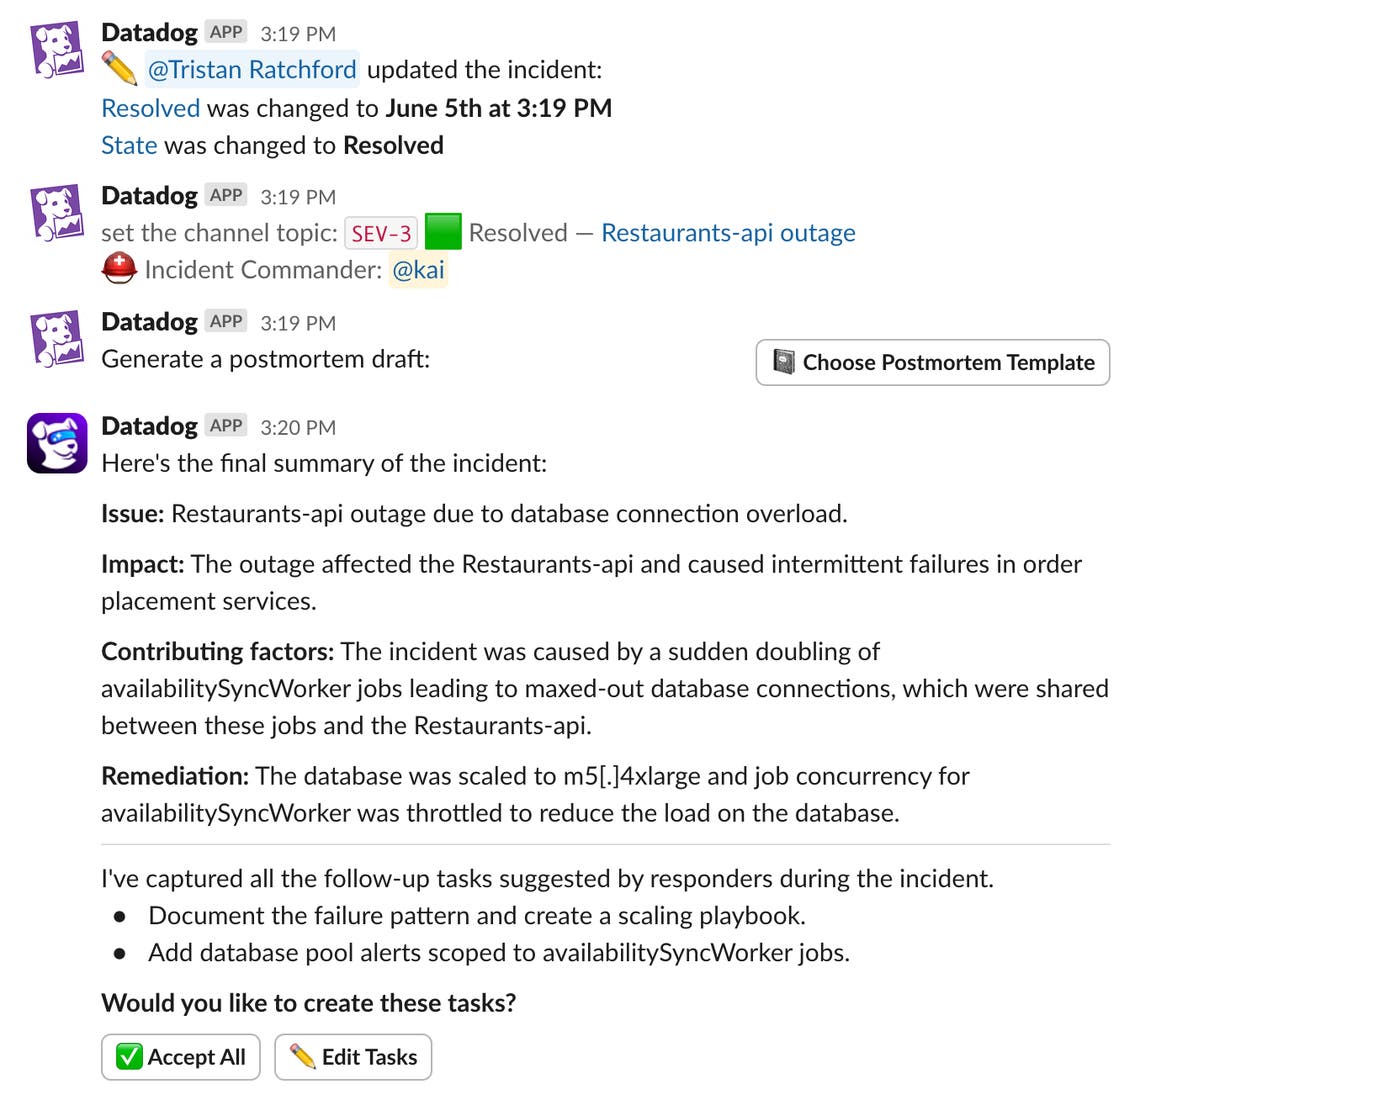
When it’s time to document the incident, Bits can help kick things off with a first draft of the incident postmortem that responders can refine and share for review. For organizations with custom reporting requirements, postmortem templates can be configured to include AI variables, such as customer impact, system context, and lessons learned. This reduces time spent compiling information so teams can focus on the deeper analysis that drives improvement. Lastly, as you’re reviewing your operational burden as part of your weekly incident review, you can use Bits to analyze trends by asking questions such as “@Datadog, how many incidents involved checkout failures in the last month?”
With coordination simplified and key information captured automatically, teams can now shift focus to extracting insights that improve resilience.
Derive lessons learned from postmortem reviews
As important as it is to resolve an incident, it’s just as important to analyze the root cause and take steps to help ensure the problem doesn’t happen again. Datadog Incident Management has built-in tools for collaborative documentation so you can learn from resolved incidents.
On the Remediation tab, you can create and track incident follow-up tasks, as well as add links to Datadog Notebooks, Google Docs, Confluence pages, and other relevant documents. Datadog Notebooks will generate an automated postmortem document for you, once you resolve an incident, that includes the entire incident timeline and all related messages, tickets, comments, and graphs. You can also create custom postmortem templates with dynamic variables that will automatically populate to reflect the incident’s context.
Datadog Notebooks supports real-time collaborative editing, so your team can work together to document the incident response process or write and share postmortems. You can add interactive graphs from any Datadog data source and easily scope them to the exact time frame of the incident. Full support for Markdown also enables you to add rich context, like code snippets detailing how to resolve an issue. If the issue occurs again, you’ll have a full record of the steps you previously took to resolve it.
From the Incidents landing page, you can select the Analytics option to view the Incident Management Overview dashboard.
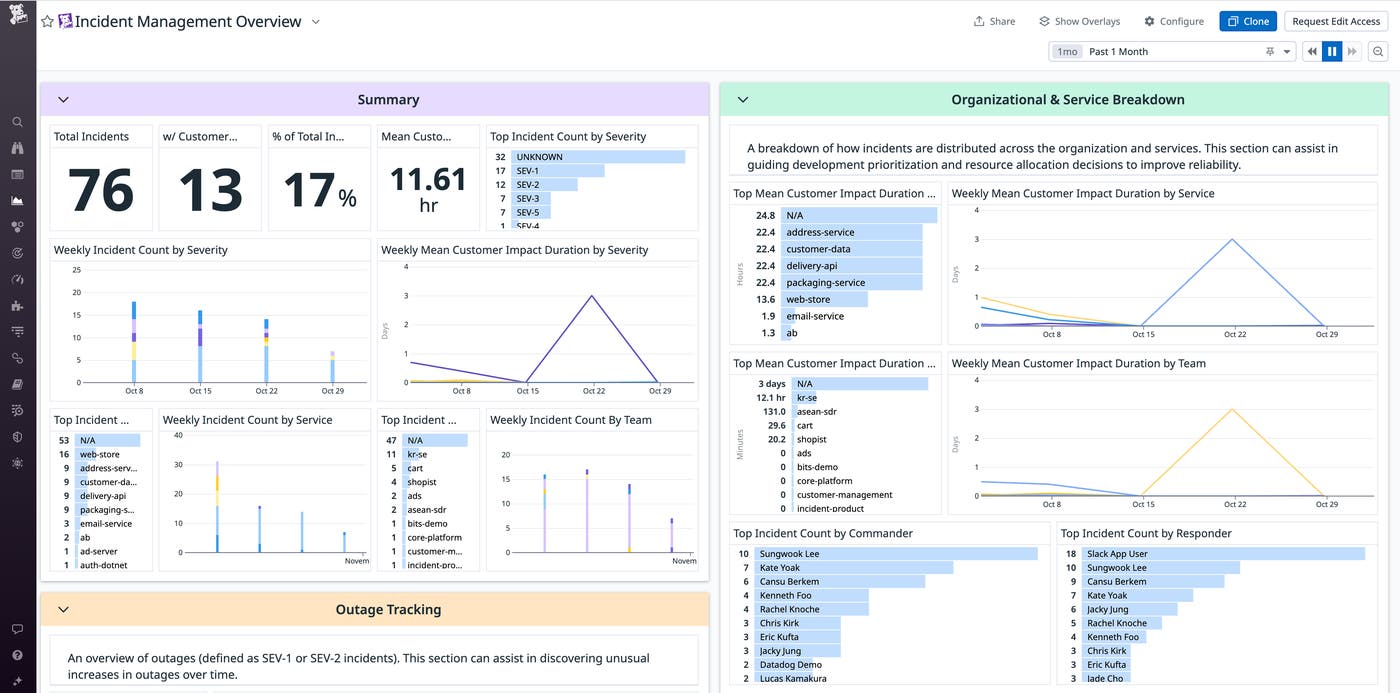
This dashboard can provide you with the context you need to justify resource allocation, prioritize post-incident follow-up tasks, plan a larger project, or other steps required to help you prevent a similar incident in the future.
Optimize your incident management with customized settings and automation
While Datadog Incident Management provides a highly structured incident response plan that is readily available, incident response isn’t one-size-fits-all. If you have processes in place already, Datadog also offers flexible customization options so that you can make it work for your organization. You may decide that customized settings are a better fit for your use cases based on the lessons you’ve identified in a postmortem review. Integrations with Slack, Microsoft Teams, Zoom, CoScreen, and Jira enable you to leverage tools that your teams already use to make your incident response more efficient and effective.
You can define incidents differently to reflect specific scenarios, like optimizing severity settings for security versus non-security incidents. Assigning individual team members to customized roles, such as Incident Commander and Communications Lead, enables you to send notifications directly to the response team as soon as you declare an incident.
Take advantage of custom property fields to describe attributes that are specific to your organization, and then run analytics that will give you insight on incidents that have involved or impacted them. For example, if you’re in the automotive industry and add the models of each of the vehicles you manufacture, then you can run analytics and view historical trends with our Incident Management Overview dashboard to reveal any correlations between particular incidents and the various models.
Get started today
Datadog Incident Management provides a set of features for responding to incidents that’s fully integrated into the monitoring platform you already use, letting you seamlessly pivot from your alerts and data to your incident response workflow and back again.
If you’re a Datadog customer, you can try out the Incidents UI today, as well as the Datadog Slack App. If you’re new to Datadog, sign up for a 14-day free trial.
