Addie Beach

Natalie Altman
Monitoring your on-premise or hybrid infrastructure means keeping track of potentially thousands of devices, any one of which could be a point of failure. Additionally, silos between application and network teams can create visibility gaps that complicate troubleshooting. For network engineers investigating bottlenecks, being able to view real-time infrastructure health and performance data alongside application metrics is essential for ensuring their organizations meet key SLOs.
To help with this, Datadog Network Device Monitoring (NDM) collects telemetry data from your on-premise equipment by polling devices with Simple Network Management Protocol (SNMP). This provides valuable insights into your entire fleet of devices, including routers, switches, and firewalls. However, polling by itself can miss network issues that occur outside of polling periods, and some information about your devices—such as hardware failures—may not be available via SNMP polling at all.
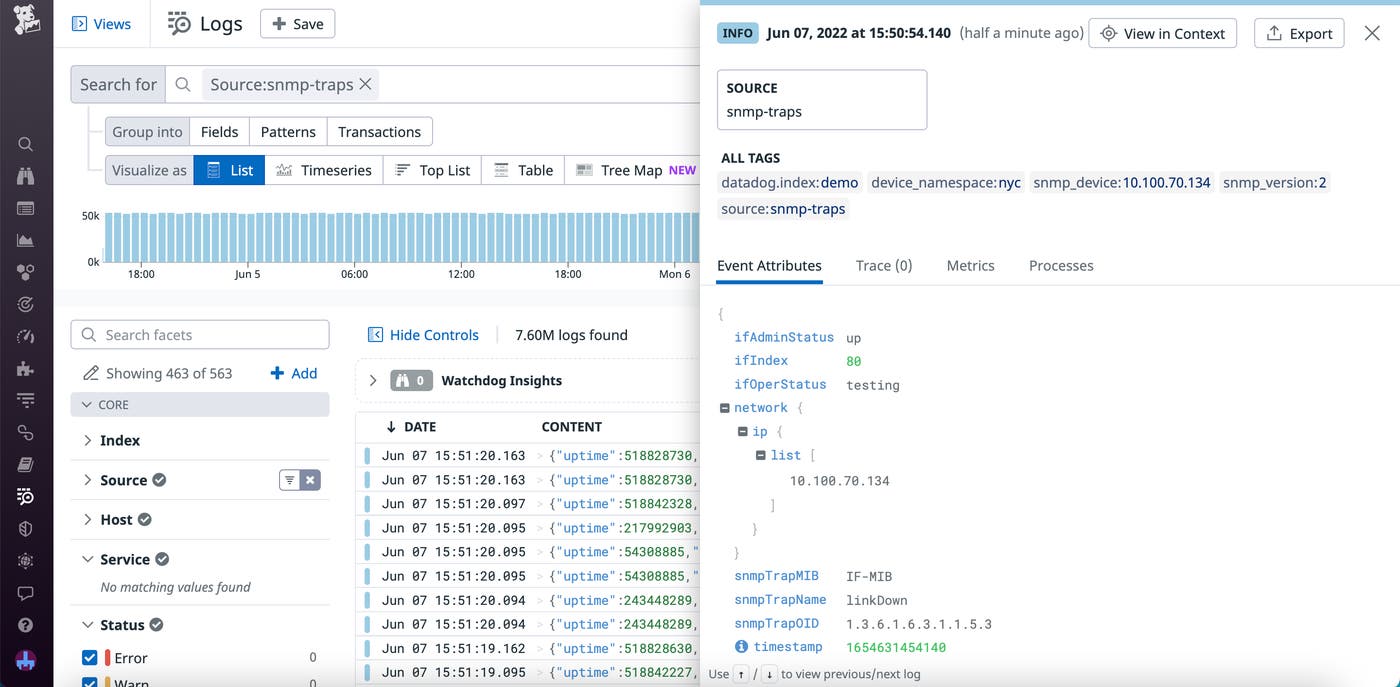
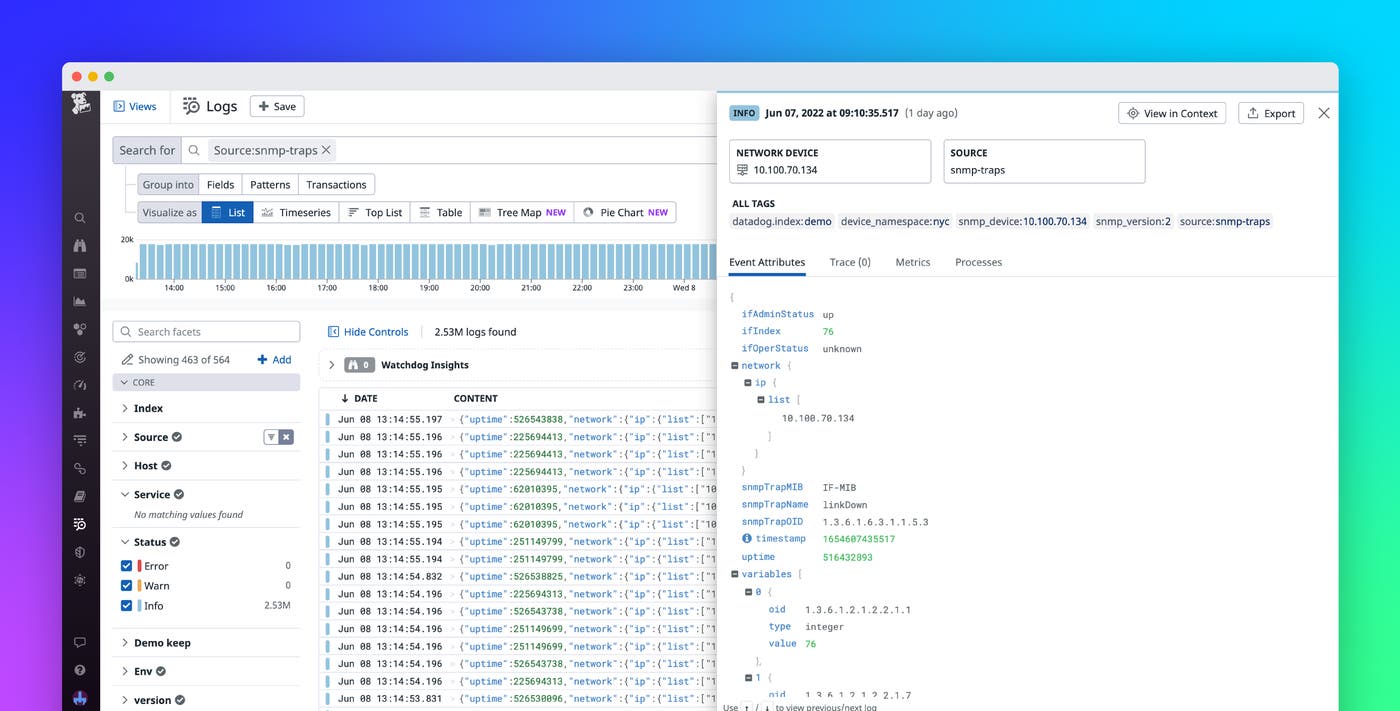
For complete visibility into your network equipment, Datadog NDM now collects SNMP Traps, enabling you to catch critical network issues right when they happen. Support for SNMP Traps expands on our existing NDM suite, helping you consolidate troubleshooting efforts within a single pane of glass. You can easily view, sort, and filter SNMP Traps side-by-side with your other network infrastructure metrics. You can also set up monitors for SNMP Traps, allowing you to receive notifications for issues before they impact the rest of the network.

Identify device issues as soon as they occur
SNMP Trap events are triggered by network devices when they encounter unusual activity, such as a sudden state change on a piece of equipment. Because of this, you can use Traps to capture issues that might otherwise go unnoticed due to device instability. For example, if an interface is flapping between an available and a broken state every 15 seconds, relying on polls that run every 60 seconds could lead you to misjudge the degree of network instability. Traps can also fill visibility gaps for certain hardware components, such as device battery or chassis health.
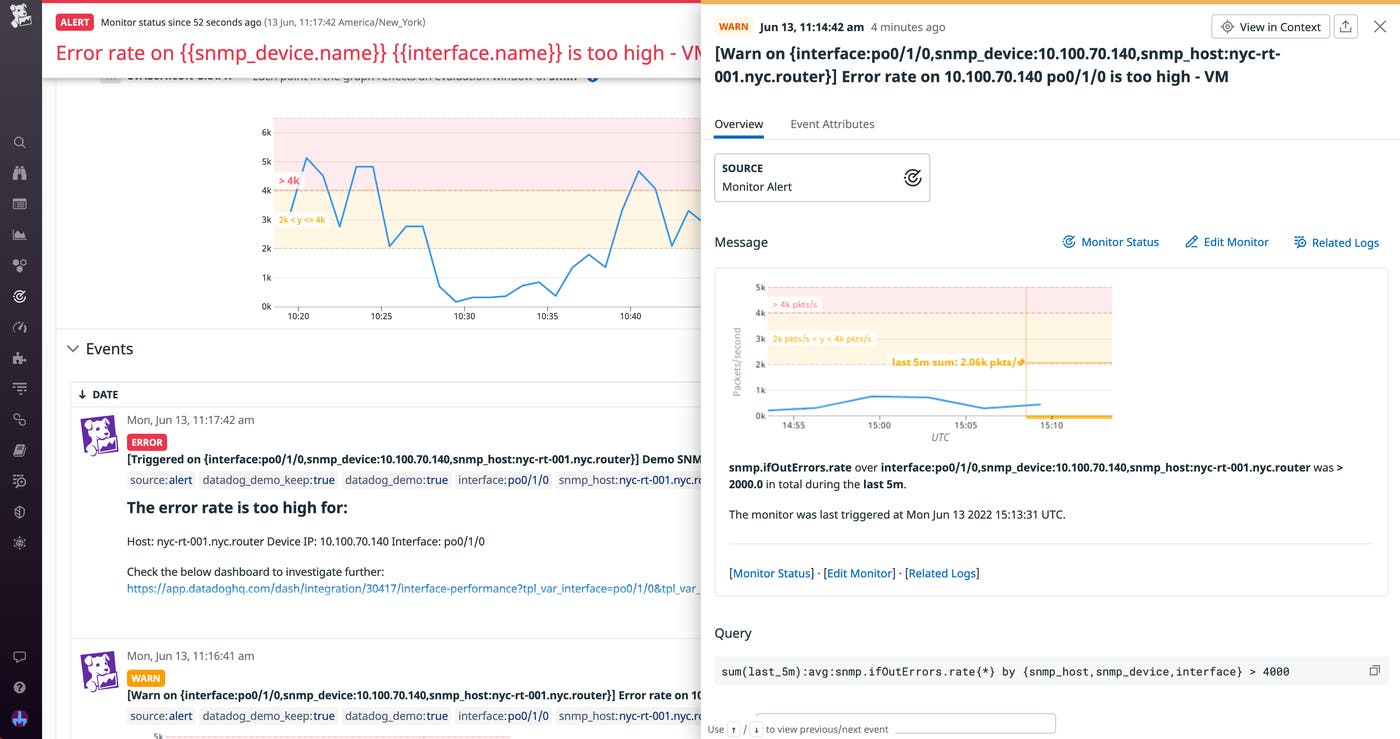
To make sure you receive alerts every time a critical SNMP Trap triggers, you can set up Datadog monitors on specific Trap events. This enables you to receive alerts via email, ticketing tools like ServiceNow, or mobile device notifications. You can use these monitors to quickly identify and troubleshoot network latency, as well as spot hardware health problems that could indicate larger performance issues such as packet loss and latency.

Let’s say a fan on one of your network devices breaks, causing the equipment to overheat. The event triggers an SNMP Trap, which Datadog catches and sends you a notification about. Looking at the Trap details helps you judge the severity of the issue and determine the appropriate next steps. In this case, you notice that a critical router is affected and decide to investigate further.
Troubleshoot network equipment incidents with detailed device metrics
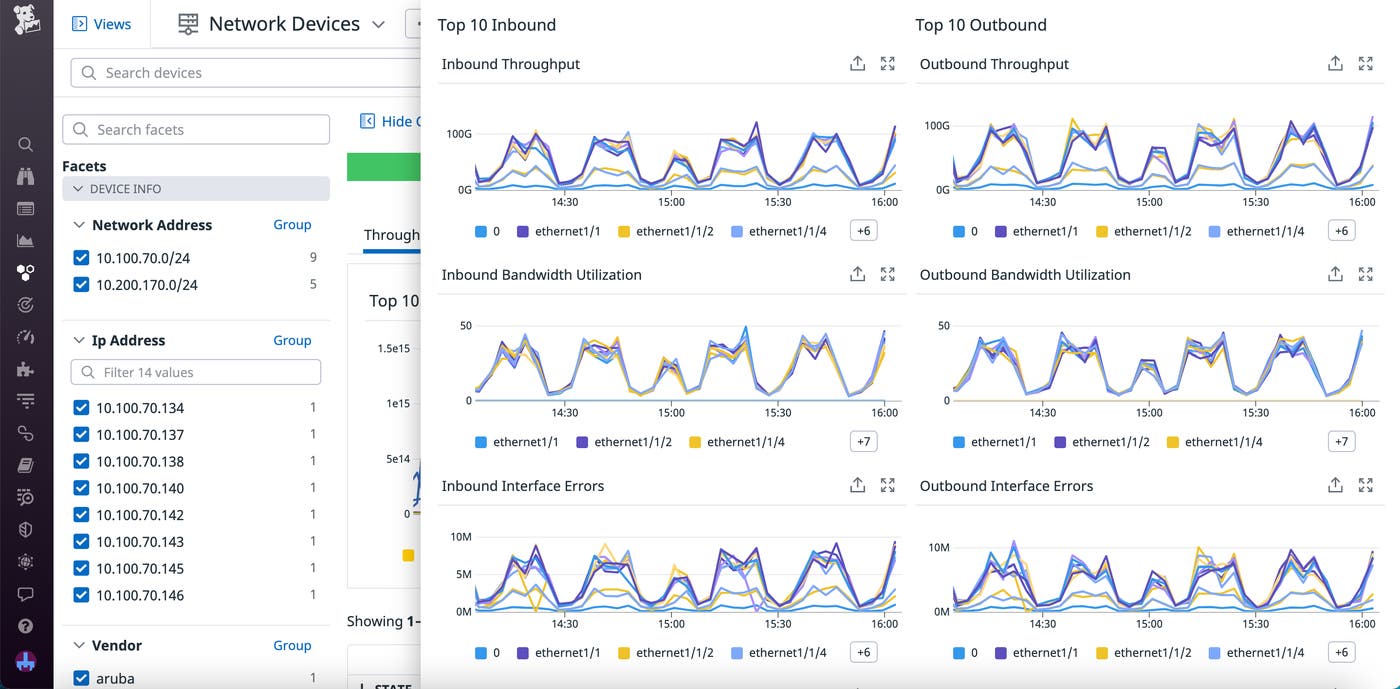
As soon as you’re alerted about a device issue via SNMP Traps, you can use Datadog to begin troubleshooting. For instance, you can use Log Patterns to spot related Traps coming from other devices, or you can analyze the health of your entire network using the Network Devices page. This allows you to visualize key metrics from every device in your network, across every layer.
In the scenario of the overheating device described earlier, you could pivot to the Network Devices page to investigate the impact on your overall network health. There, you can visualize detailed network metrics—such as the number of packet drops—in order to determine whether the issue is affecting other devices. For example, you might discover that the rest of your network is experiencing an increased workload to compensate for the unavailable host.

You can also drill down into a list of interfaces on each device for fine-grained analysis. If you have a device with an overly saturated network interface, it could be hogging the available bandwidth and causing latency on the rest of the network. You can go straight from a Trap notifying you about high bandwidth on a device to pinpointing the problematic interface and evaluating the overall effect on network performance. You can also view additional metrics via dashboards to correlate network issues with the rest of your stack. Here, you could look at frontend performance data to determine the impact on user experience.
Streamline device monitoring with SNMP Traps
With SNMP Trap support from NDM, you receive full visibility into potential device issues—no matter where or when they happen in your network. You can leverage alerts on SNMP Trap data alongside a variety of network metrics to diagnose issues, assess their severity, and immediately start troubleshooting.
SNMP Traps is available in Datadog Agent versions 7.37 and up. If you’re an existing customer, you can get started with Network Device Monitoring using our documentation. Or, if you’re new to Datadog, you can sign up for a 14-day free trial.

