Nicholas Thomson

Samir Brizini
Modern DevOps teams that run dynamic, ephemeral environments (e.g., serverless) often struggle to keep up with the ever-increasing volume of logs, making it even more difficult to ensure that engineers can effectively troubleshoot incidents. During an incident, the trial-and-error process of finding and confirming which logs are relevant to your investigation can be time consuming and laborious. This results in employee frustration, degraded performance for customers, and lost revenue. A new way of troubleshooting is needed—one that leverages augmented insights to help distributed teams navigate growing volumes of complex data.
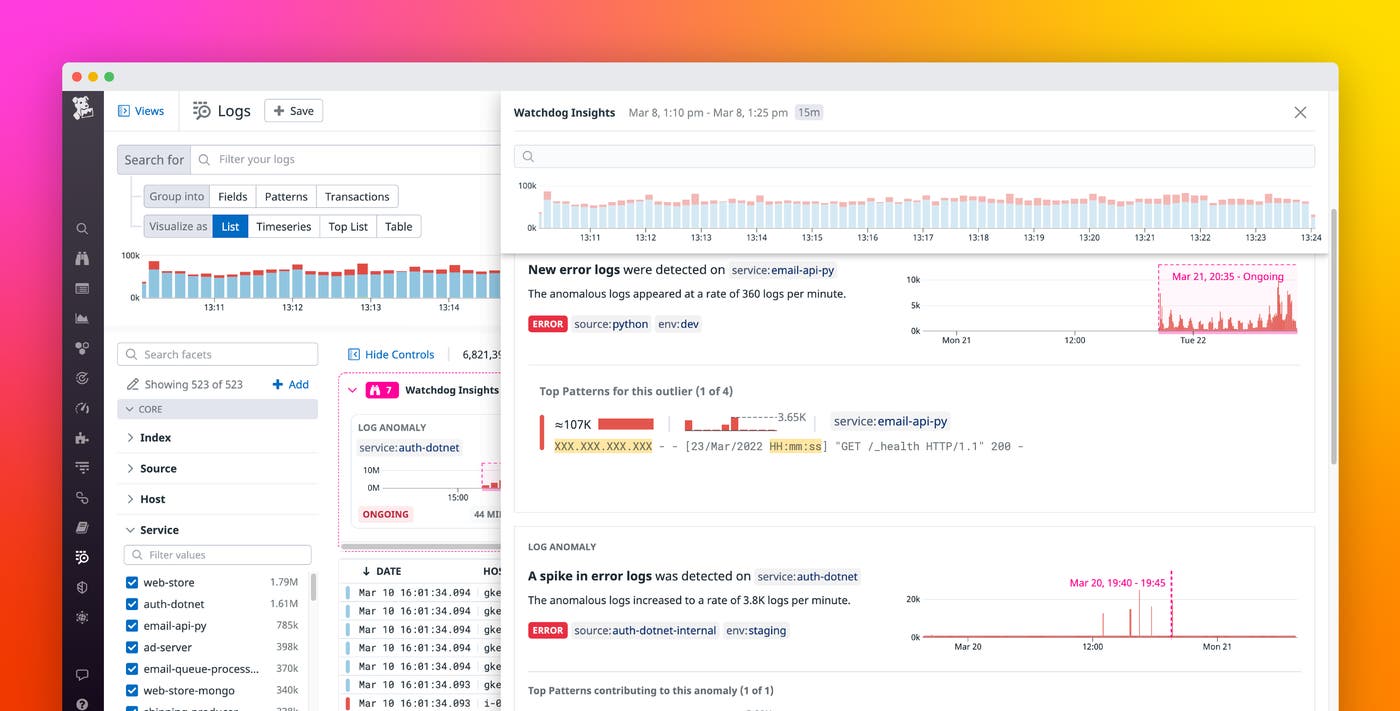
To automate the process of finding relevant logs during an incident investigation, Datadog created Log Anomaly Detection, an out-of-the-box Watchdog Insights feature. Log Anomaly Detection surfaces anomalous patterns at the top of the Log Explorer, reducing MTTR and saving you time and effort. Log Anomaly Detection fits seamlessly into the broader constellation of Log Management and breaks down silos between DevOps teams by allowing anyone in your organization—regardless of their prior knowledge of the impacted applications—to efficiently investigate incidents without any need for a complex query language or additional configuration.
Streamline incident investigations
Say you are a part of a small SRE team at an e-commerce company that has just released a new product from a big name vendor. On the morning of the release, you receive a flood of notifications from angry customers who were unable to finalize their purchases. Every second of downtime is costing you money and damaging your company’s reputation. Your site integrates with third-party service providers to handle tax calculation, the payment gateway, personalization, ad tech, loyalty rewards, and more, which means that your team has a lot of ground to cover in order to find the root cause of the issue.
To start investigating, you navigate to the Log Explorer and see some interesting anomalies presented in the carousel above the live feed. These anomalies are analyzed in real time based on your current search context (service, env, source, status) and selected time window—in this case, the past two days. You can easily adjust the scope of your search to the service that triggered an alert and filter out any anomalies that aren’t relevant to your investigation (e.g., anything detected in your staging environment).
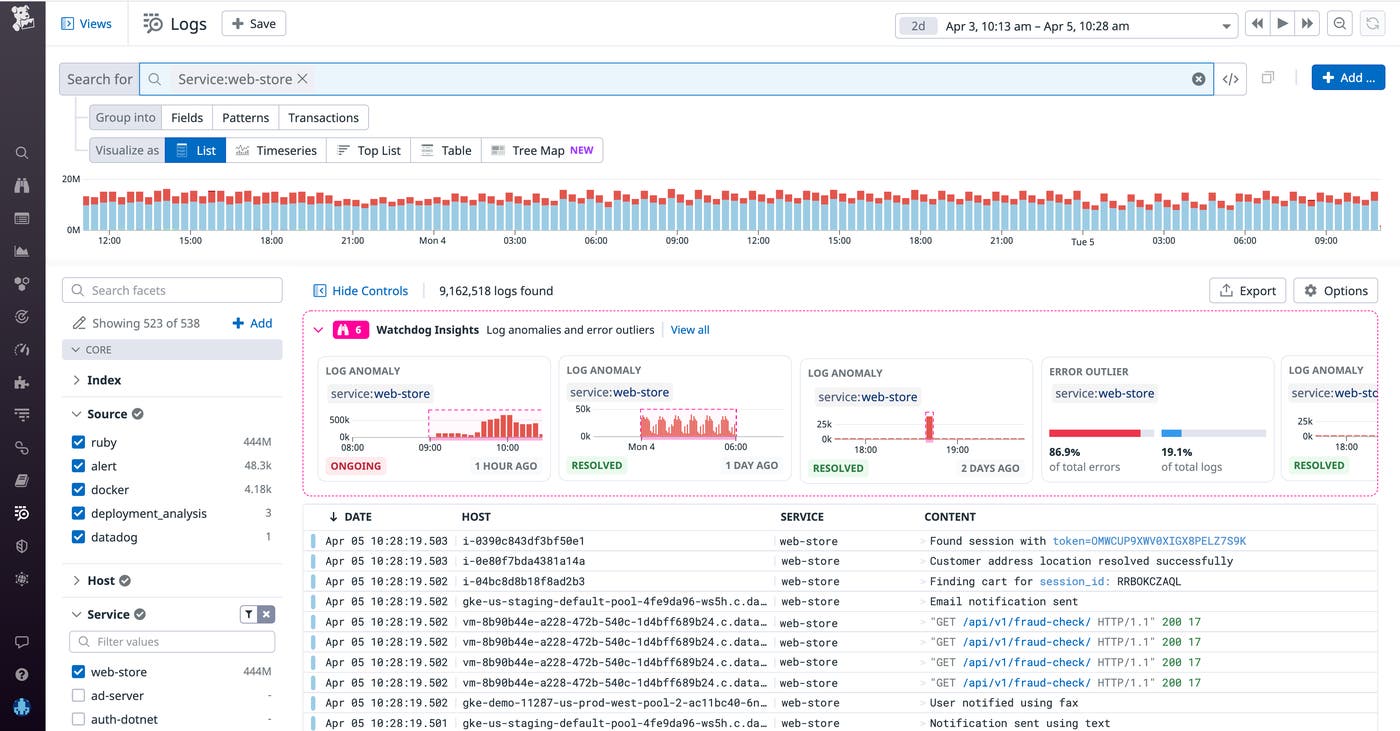
Watchdog finds anomalies in near real-time across all of your ingested logs by detecting when the number of logs with a status level of warning, error, or above sees a substantial increase relative to its historical baseline. Watchdog continuously analyzes your data so it can understand when log behavior changed significantly enough to be considered anomalous.
Watchdog Insights also prioritizes anomalies based on a number of factors—such as the current state of the anomaly (ongoing or resolved), its status (warning or error), and its history (i.e., whether it is a new pattern or a spike in an existing pattern)—to further guide you in what you should look at first (highest priority on the left).
On the left-hand side of the Insights carousel, you see an ongoing log anomaly affecting service:web-store. This is your likely culprit. When you click on the anomaly, you can immediately see a summary of what Watchdog detected (e.g., a spike in the number of error logs), aggregated by pattern, as well as samples of the anomalous logs.
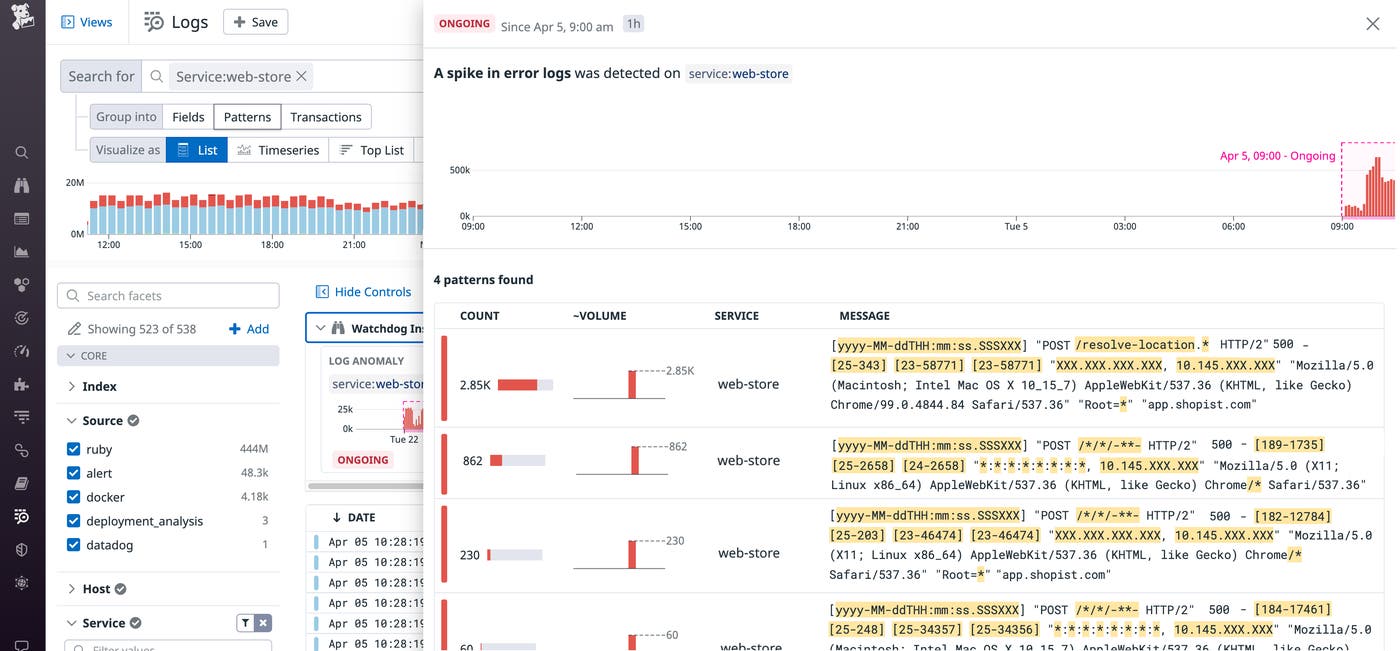
You can inspect a log that follows this error pattern, then click on the Trace tab to view the correlated trace. The trace shows you which other services in your application may have been involved in the issue.
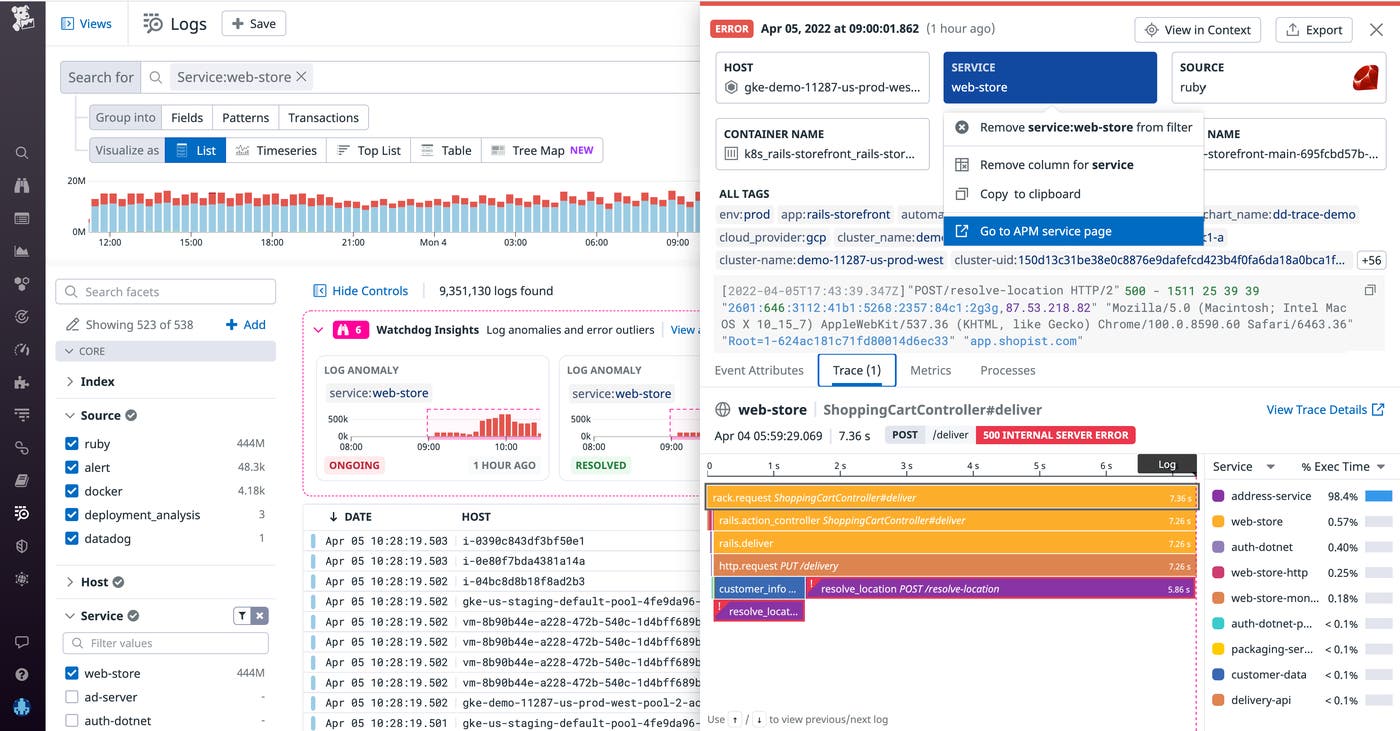
In this case, the flame graph reveals that this 500 error log was generated during a call to an API downstream of the web-store service. From here, you can pivot to the APM Service Page (as shown above) to gather more context about what may be causing these API calls to fail.
Because the APM Service Page includes Deployment Tracking, you are able to see that the log anomaly coincided with a recent faulty deployment that included an update to the code that calls the API.

Now that you have identified a suspected root cause of the disruption, you can take swift action to remediate the issue by rolling back the deployment to its previous version.
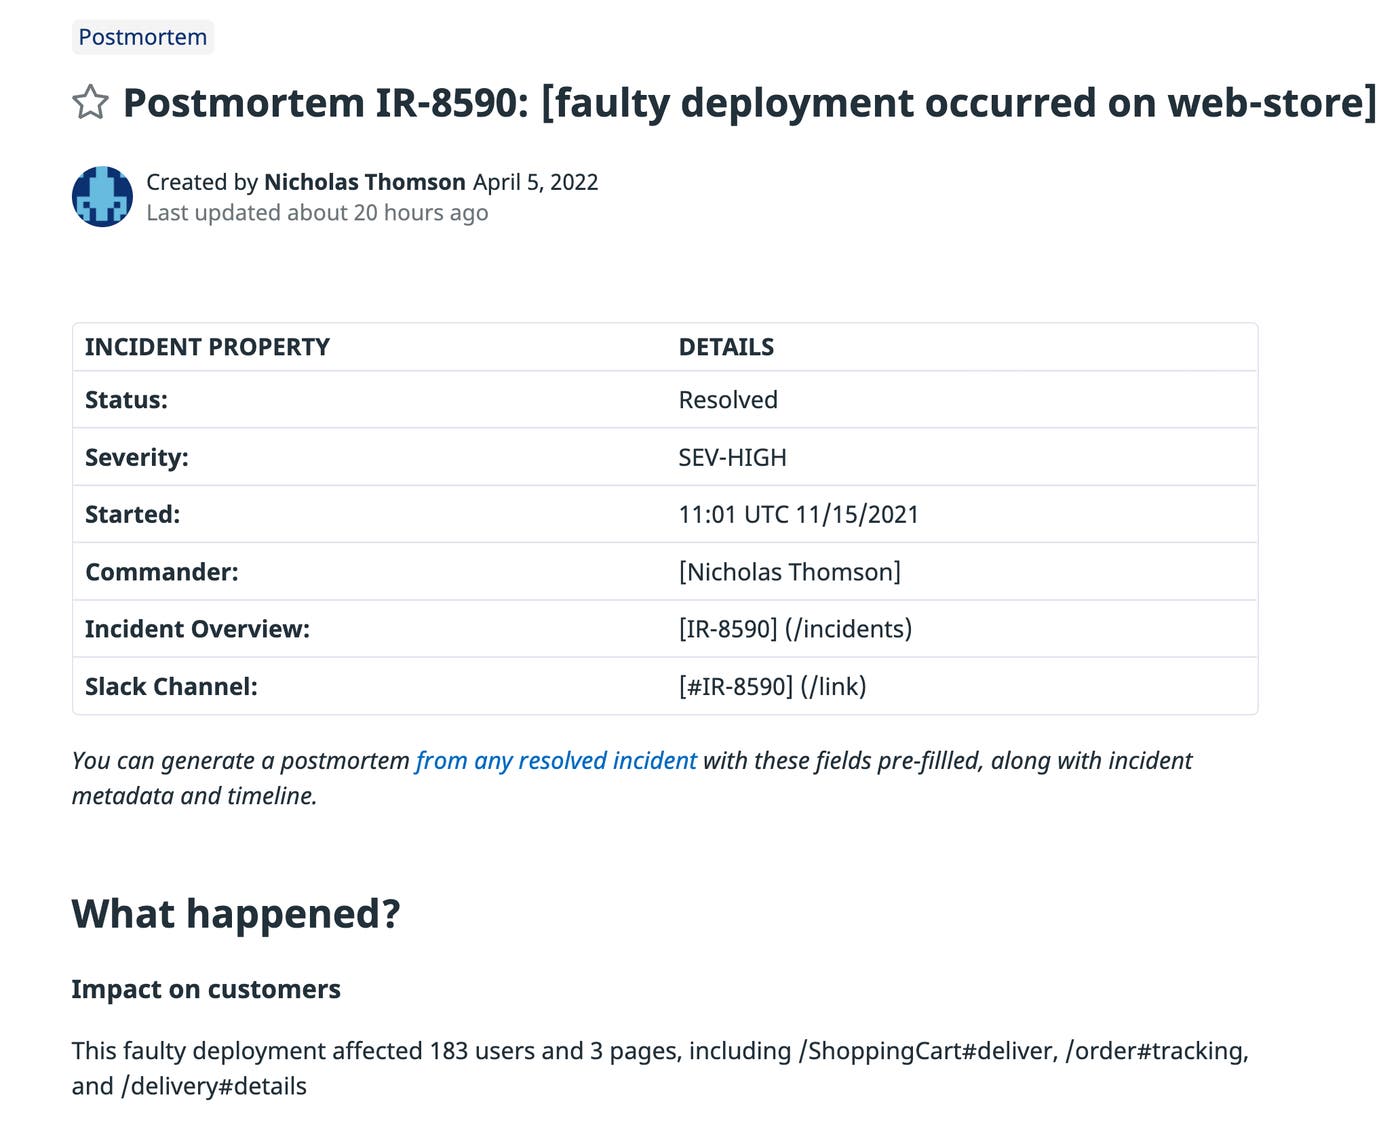
In addition to helping you investigate incidents more quickly, log anomalies can also help you document lessons learned by enriching your postmortems. Log Anomalies are stored for one week, so after the deployment issue, you can search for service:web-store to quickly surface the historical anomaly and add the anomalous logs to a Notebook when you write your postmortem.
Get started with Log Anomaly Detection
Log Anomaly Detection enhances Log Management by helping you find anomalies easily, expediting your troubleshooting and reducing MTTR. Now, engineers can effectively remediate issues in far less time, regardless of their prior knowledge of the infrastructure and services that were involved.
Log Anomaly Detection is now available as part of Watchdog and complements other features like Root Cause Analysis, Watchdog Insights, and Watchdog for Infra.
If you’re new to Datadog, sign up for a 14-day free trial, and start detecting anomalies across all your services automatically.
