Get started with Datadog Synthetic Monitoring
Explore and register for Foundation Enablement sessions. Learn how Datadog Synthetic Monitoring is a proactive monitoring solution that enables you to create code-free...
Catch broken journeys before your customers do
Automatically discover, verify, and debug the user journeys that drive your business, all in one platform.


End-to-end testing across every layer
Protect the experiences your revenue depends on. Generate coverage automatically, verify outcomes rather than endpoints, and go from alert to root cause in minutes.
Automate your test coverage
Close coverage gaps, including the ones you didn’t know you had. Automatically cover the workflows that matter across browser, API, and network, so coverage expands with every release.
Jump from alert to root cause
Trust your alerts again. Know whether a failure is real, flaky, or a misconfiguration the moment a test completes, then get an evidence-backed root cause in minutes.
Prove business impact
Connect what you test to what the business measures. Get uptime SLOs on the workflows your business runs on, with no setup and historical trends from day one, so reliability reporting stops being something you assemble by hand.
Datadog automatically brings frontend, API, and network testing into one view for each user workflow. Every result connects to the traces, logs, and infrastructure metrics behind it, so a failing test points straight at what caused it.

From test creation to resolution
Build coverage
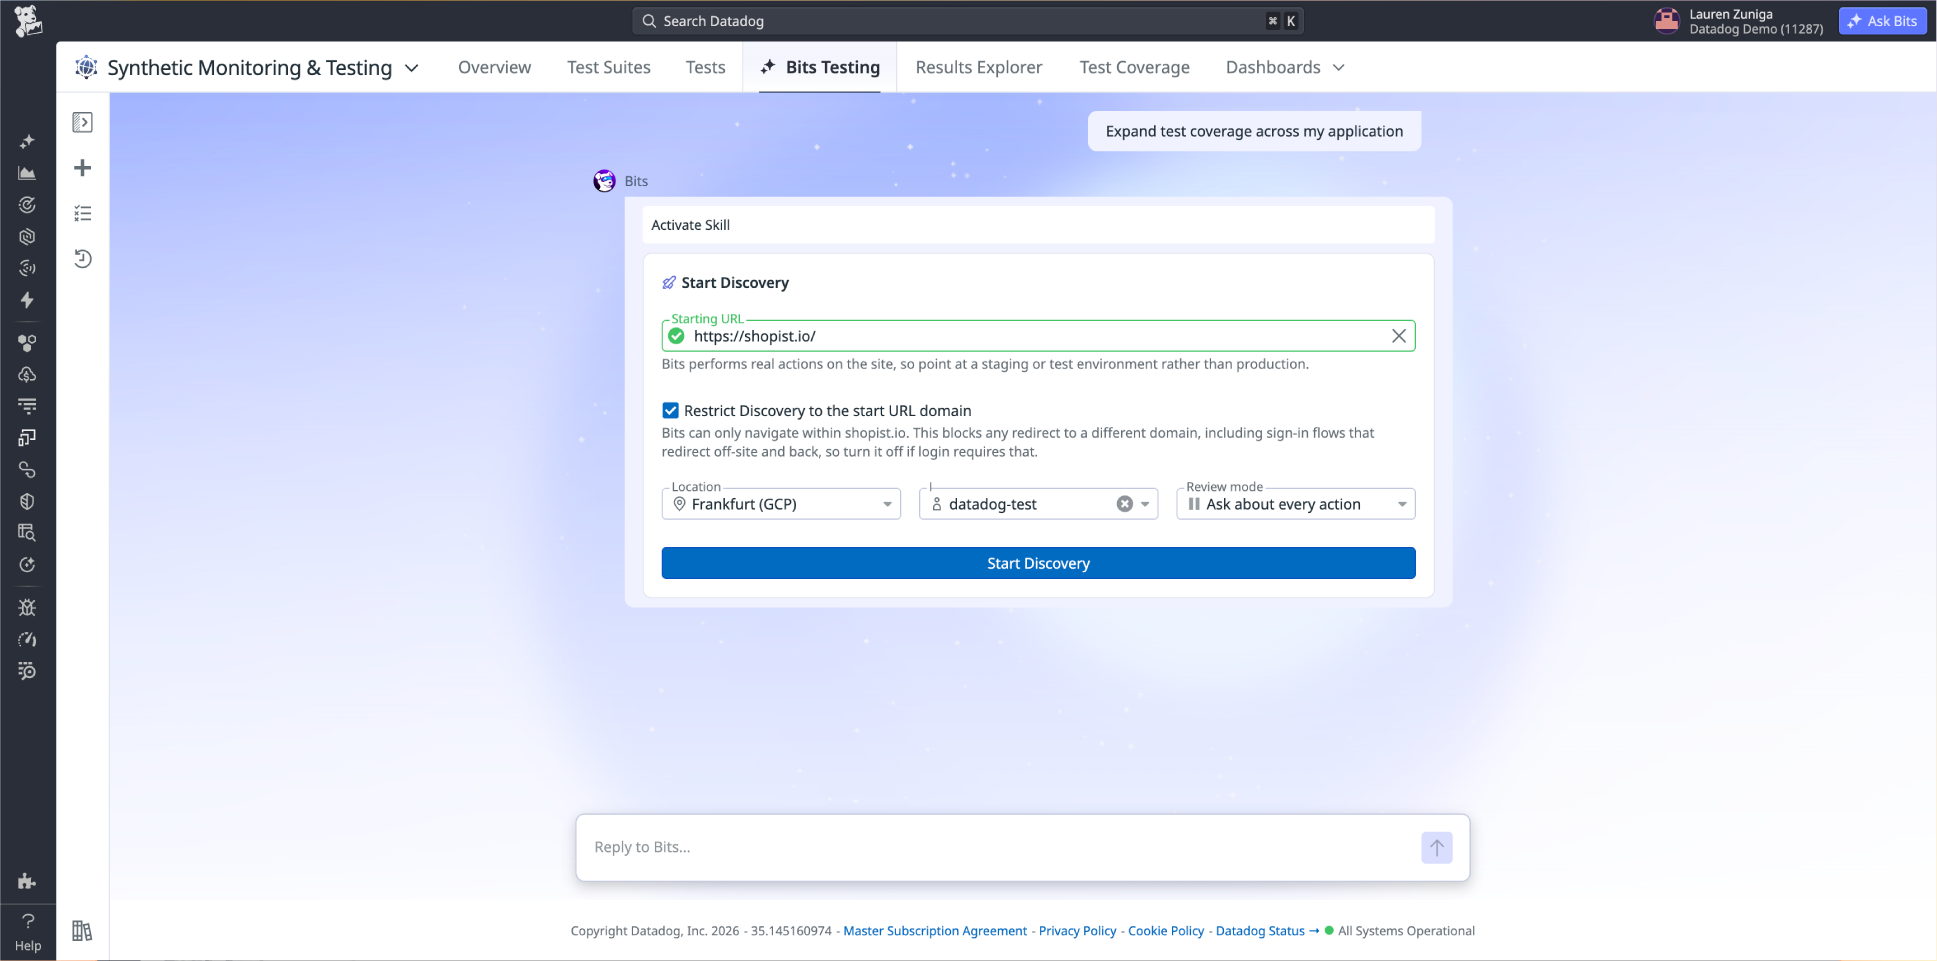
Discover and generate tests automatically
Bits Testing uses AI to dynamically explore your application, map its critical user workflows, and generates the browser, API, and network path tests to cover them.
Build tests without code
Bits Testing and the no-code recorder makes it possible for every member of your team to create and maintain tests across any user journey.
Test from anywhere your users are
Run tests at the frequency you choose, across a range of browsers and devices, in Datadog-managed locations worldwide or in private locations you deploy behind firewalls, on your LAN, and in other environments your business depends on.
Test every layer
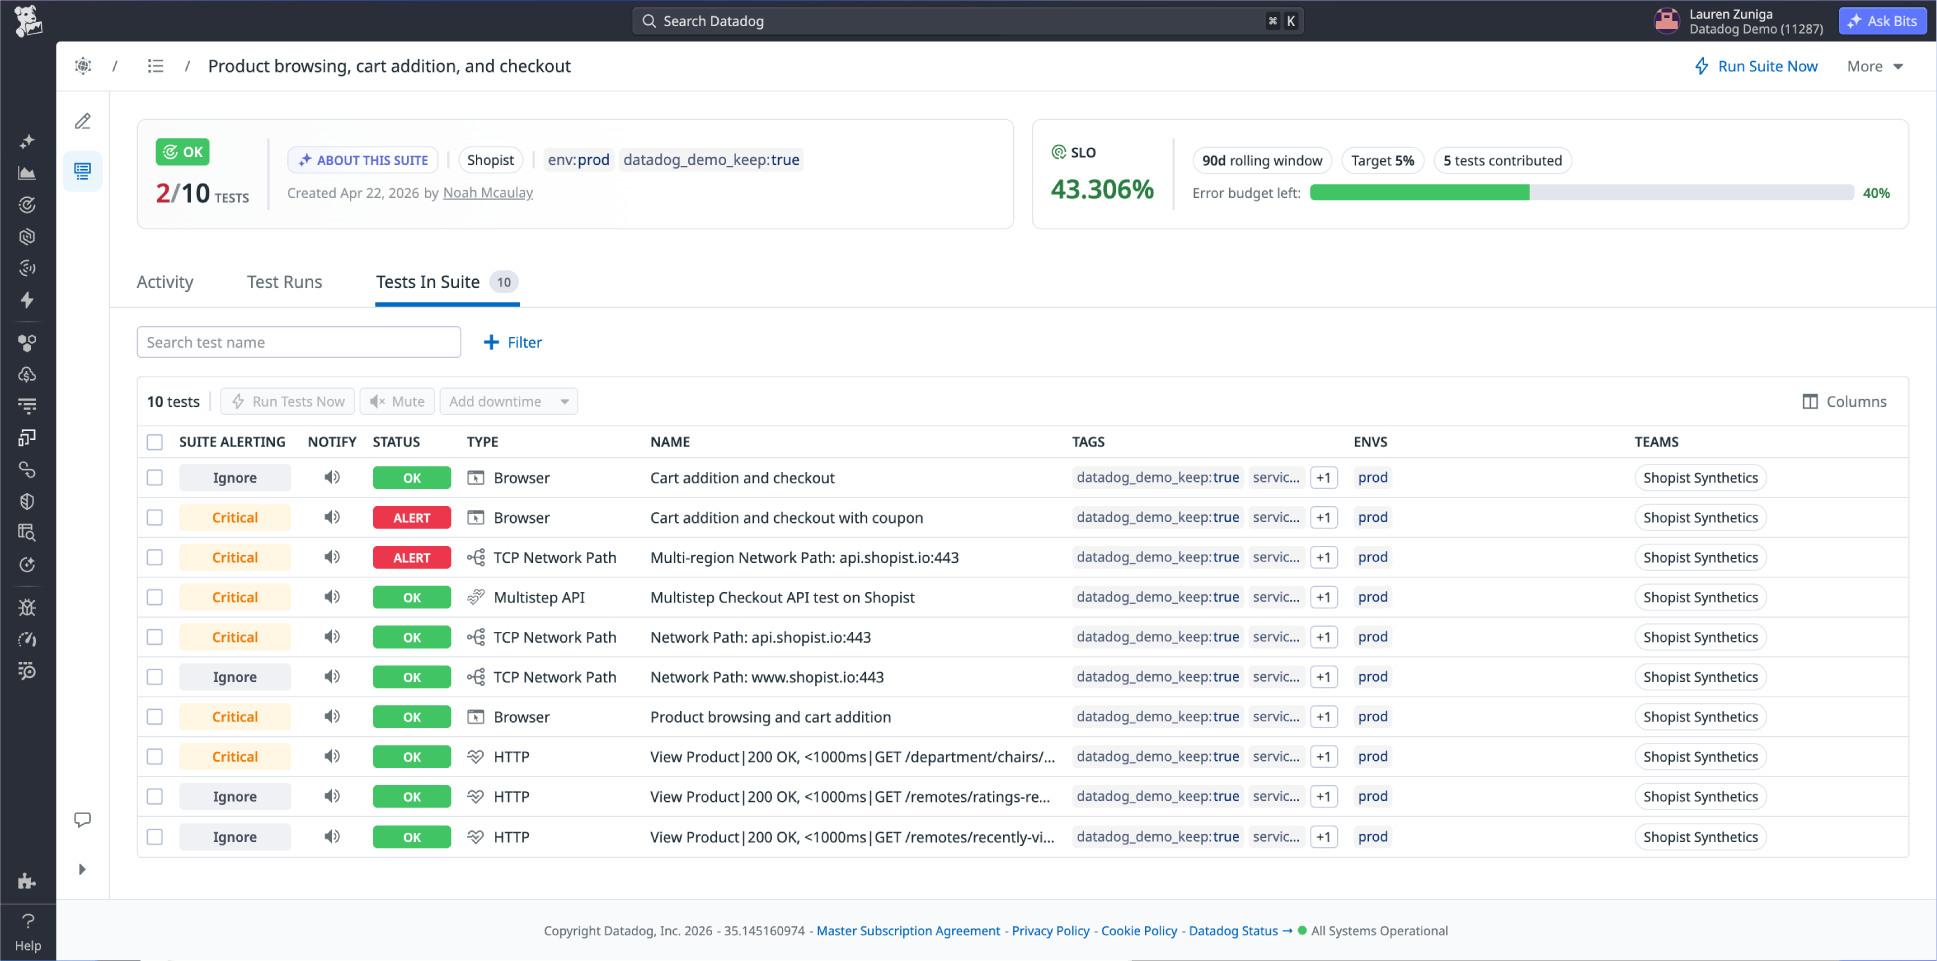
Catch failures that hide across layers
Test Suites aggregate browser, API, and network tests into a single unit per workflow, so failures get caught before customers feel them.
Validate what users need to accomplish
Define the outcome you need users to achieve, like completing a checkout or finishing onboarding and Bits Testing discovers the relevant paths to test.
Catch breaking changes in pre-production
CI/CD integration runs workflow-level tests at every stage of development, automatically blocking deployments that would break key user flows.
Diagnose failures
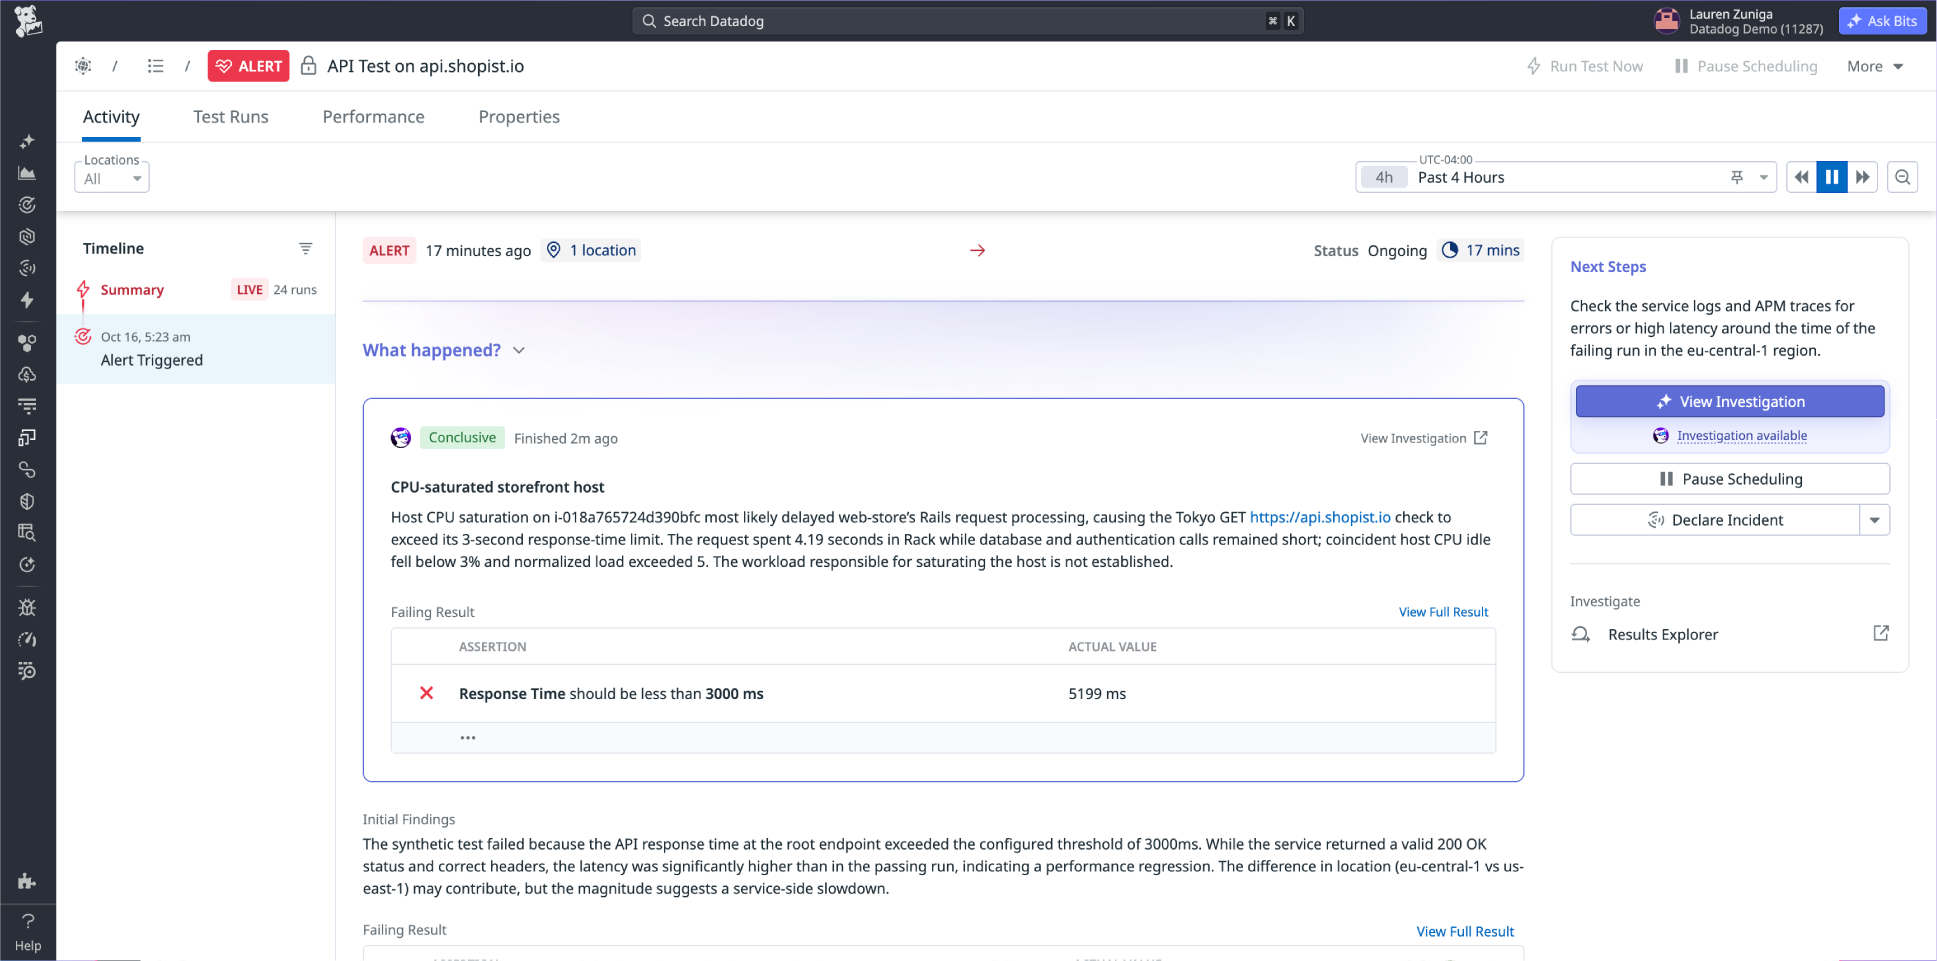
Know immediately whether a failure is real
AI-powered rich test results classify every failure the moment a test completes as a real regression, a flaky test, or a misconfiguration, so your team only investigates what matters.
Drill into test failures
Open a failed test to see the APM trace, RUM session, error logs, and infrastructure metrics for the exact request it fired, alongside step-level screenshots and video replay.
Get to root cause in minutes
Bits Investigation autonomously correlates test results, APM traces, logs, and infrastructure data, surfacing a root cause with tested hypotheses and recommended next steps.
Measure availability
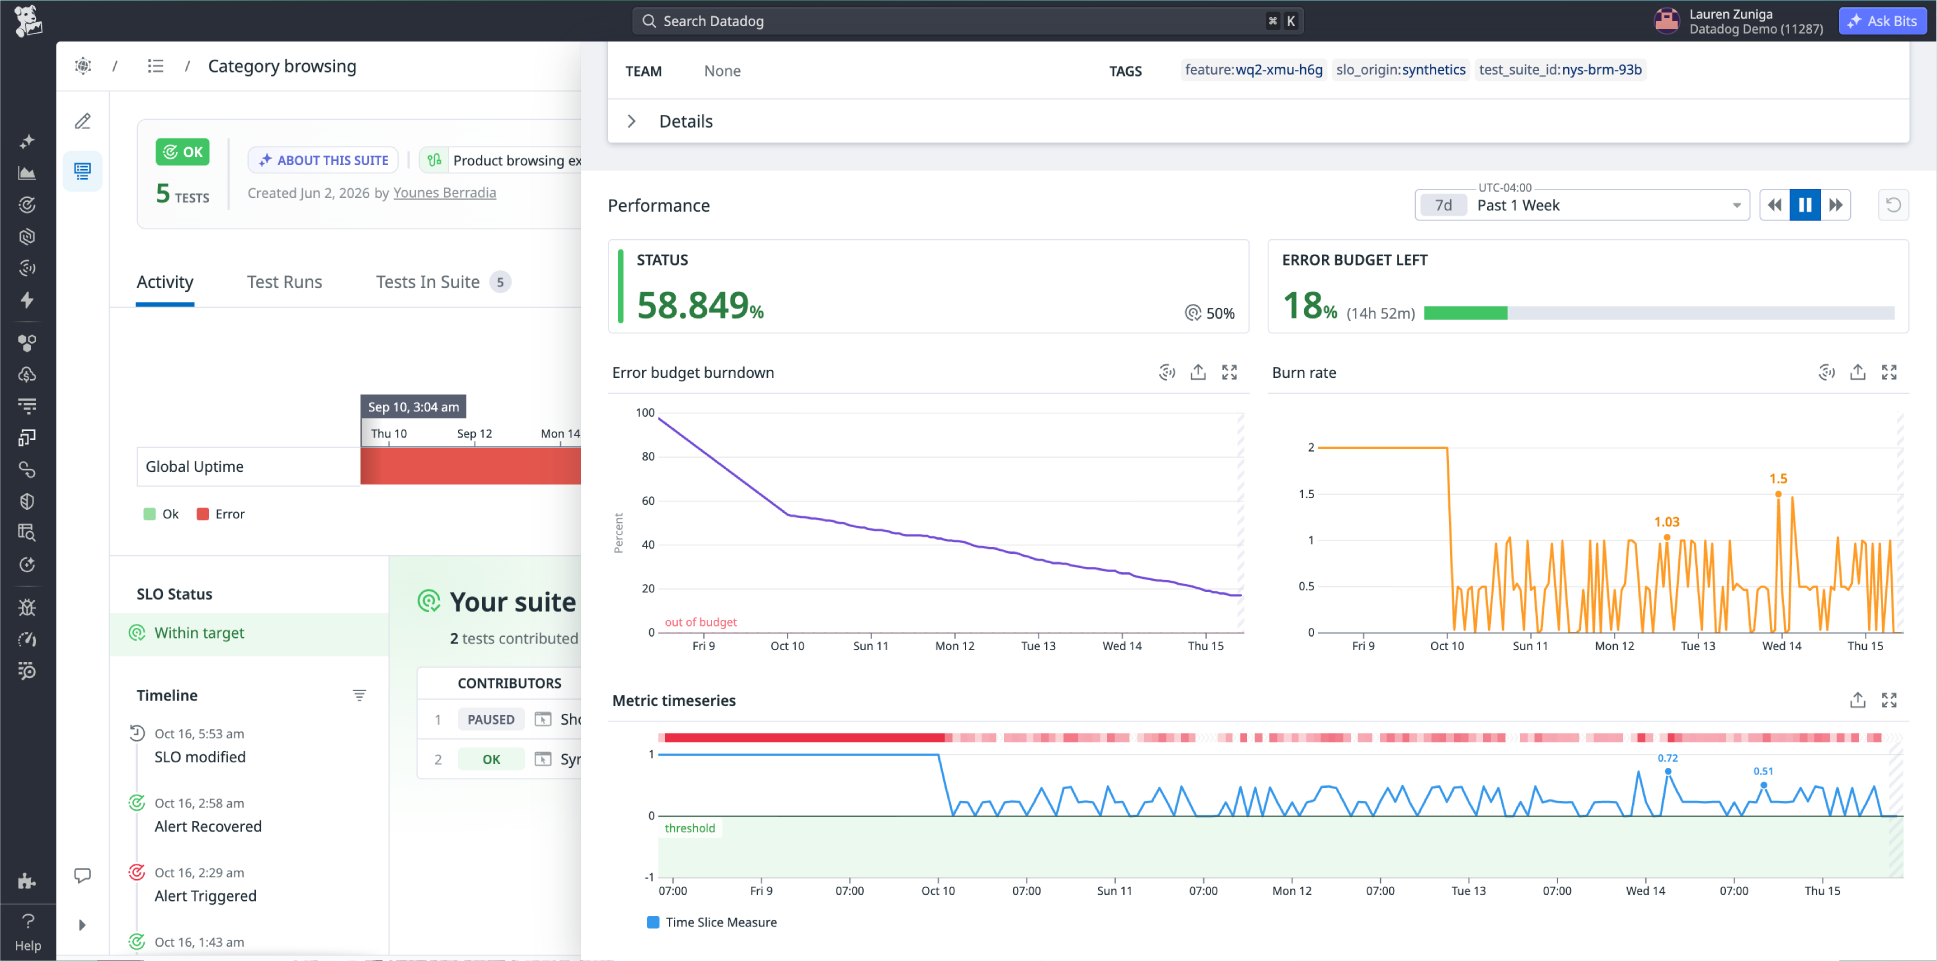
Measure uptime against the workflows that drive revenue
SLOs generated automatically against your critical user workflows, with no manual setup, no custom queries, and no ongoing maintenance. Reliability is measured the way customers experience it.
Move from pass/fail to error budgets
When your error budget tracks workflow availability, teams prioritize what actually affects customers instead of chasing system-level metrics that don't reflect real user experience.
Give stakeholders a clear view of reliability over time
A unified report tracks SLO performance over time across test health and workflow availability, filtered by team, service, environment, or workflow.
Step-by-step guides and complete reference material
Built for every team behind the user experience
Give every team the context they need to expand coverage, resolve failures faster, and prove that the workflows your business runs on are working.


Usage-based pricing per test run, with no per-user fees
Synthetic monitoring runs automated tests that simulate user actions and API calls on a schedule, from locations you choose. It tells you whether critical flows work and how fast they respond, without waiting for real traffic to find out. Datadog runs these tests from managed locations worldwide or from private locations inside your own network.
Uptime monitoring answers "is it up?" Synthetic monitoring answers "does it work?" An uptime check confirms that a URL or port responds. A synthetic test clicks through the flow, fills the form, calls the API with a real payload, and asserts the result. A checkout page can return a 200 while the Pay button throws a JavaScript error.
Most teams use both, because they answer different questions. Synthetic tests run on a schedule under controlled conditions, so they catch problems at 3am, in a region with no traffic, or on a path no real user has taken yet. RUM shows what actual visitors experienced across their own devices and networks. Synthetic tells you something broke; RUM tells you who it affected.
Browser tests for user flows, API tests (single and multistep), and network-level checks such as DNS, SSL, TCP, and ICMP.
Three steps. Point Bits Testing at your application URL and let it generate a suite for a critical workflow, review and accept the tests it proposes, then add alerting and a CI/CD trigger. Each generated test includes a free sample run, so you can see results before anything goes on a schedule.
No. Bits Testing generates tests from a plain-language description of what you need covered, and browser tests can also be recorded with the Datadog Chrome extension or built step by step in the UI. Code is optional: add JavaScript assertions when you need custom logic, or manage tests as code through the Synthetics API or Terraform.
Use API tests, which assert on status code, response time, headers, and body content. They cover HTTP, SSL, DNS, WebSocket, TCP, UDP, ICMP, and gRPC. Multistep API tests chain requests together, so you can authenticate, create a record, and verify it within a single test, and reuse multistep tests as subtests inside larger ones.
Yes. Bits Testing is an AI agent that explores your application, maps the workflows users take, and generates the browser, API, and network path to cover them, grouped into suites by workflow. You review everything before it runs, and you choose whether the agent pauses for approval before any action that would change real data. Each generated test includes a free sample run.
Browser and mobile tests identify elements using several points of reference rather than a single XPath or CSS selector. After a successful run, the test recomputes any broken locators with updated values, so minor frontend changes do not require manual repair.
Intervals range from every 30 seconds to once per week, depending on test type. Network path tests can run as frequently as every 30 seconds, API and browser tests every minute, and mobile app tests every 5 minutes. Tests run from Datadog-managed locations across AWS, GCP, and Azure in the Americas, EMEA, and Asia Pacific, or from private locations you deploy inside your own network.
Yes, using private locations. These run as Docker containers or Windows services inside your network, pull test configurations from Datadog over HTTPS, and send results back, so no inbound traffic is required. They support API, multistep API, and browser tests, scale horizontally and vertically, and can authenticate using Kerberos SSO.
You get a classification and the evidence behind it. Datadog generates an AI failure summary that labels the failure as a real application problem or a test misconfiguration, and every step captures a screenshot, console and network detail, and links to the APM traces, logs, and RUM session for that run. For browser and API test monitors, you can launch a Bits Investigation to correlate those signals into an evidence-backed root cause, or turn on Auto-Investigate so it starts the moment the monitor alerts.
Yes. The datadog-ci CLI runs tests from any pipeline, with documented integrations for GitHub Actions, GitLab, Jenkins, CircleCI, Azure DevOps, and Bitrise. You can block a branch from deploying when a critical test fails, and trigger a rollback automatically.
Every Test Suite automatically generates an SLO with no configuration, defaulting to a 99.9% target over a rolling seven-day window. You can adjust the target and window, track error budget burn rate, and see which tests consumed the most budget. Because your tests also exercise third-party dependencies, the same measurements give you independent evidence when a CDN or payment provider misses its SLA.
Through global variables, which can be obfuscated so their values never appear in test results and restricted by role, team, or user. Datadog supports MFA through TOTP tokens and passkeys through a virtual authenticator, along with mTLS client certificates, HTTP Basic, Digest, NTLM, AWS Signature v4, OAuth 2.0, and JWT. Browser tests running from private locations can also authenticate with Kerberos SSO.
Check out our pricing page.
Yes. Mobile Application Testing runs on real Android and iOS devices, including phones and tablets across a range of OS versions, hosted in US and EU regions. You can target a specific device and OS version, or a device family such as the latest iPhone on the latest iOS, so tests stay current as devices change.
Synthetic Monitoring proactively tests applications from controlled locations to detect failures and regressions before users encounter them. Journey Monitoring brings Synthetic test results together with RUM performance data and Product Analytics insights to assess the end-to-end health of critical user journeys.
Resources
Start testing the flows your customers depend on