
Zara Boddula
Senior Product Manager
Managing a telemetry pipeline often involves recurring investigation and verification tasks. When you onboard a new log source, you look up which components exist and which fields each one requires. When logs stop arriving, you trace where events drop. Before you change a pipeline, you validate the new configuration. After you add a filter to cut costs, you measure the volume it removed and check for unintended drops. An AI agent can help with each task if it can access your pipeline configurations and metrics.
Datadog Observability Pipelines tools are now generally available in the Datadog MCP Server. Observability Pipelines lets you collect, transform, and route logs and metrics in your own environment before they reach their destinations. With the new observability-pipelines toolset, AI agents in clients such as Claude Code, Cursor, Codex, and VS Code can inspect your existing pipelines and help you draft, validate, and create new ones.
This post covers four workflows:
We’ll also explain the guardrails that help your team stay in control of what gets deployed.
Create a pipeline from a prompt
Onboarding a new log source usually means knowing which source, processor, and destination types exist, which fields each one requires, and how they connect to form a valid pipeline. With the Observability Pipelines MCP tools, you describe the outcome, and your agent can assemble the configuration.
Describe the pipeline you need
For example, when a new source sends Splunk HTTP Event Collector (HEC) logs that contain payment data, you might ask your agent:
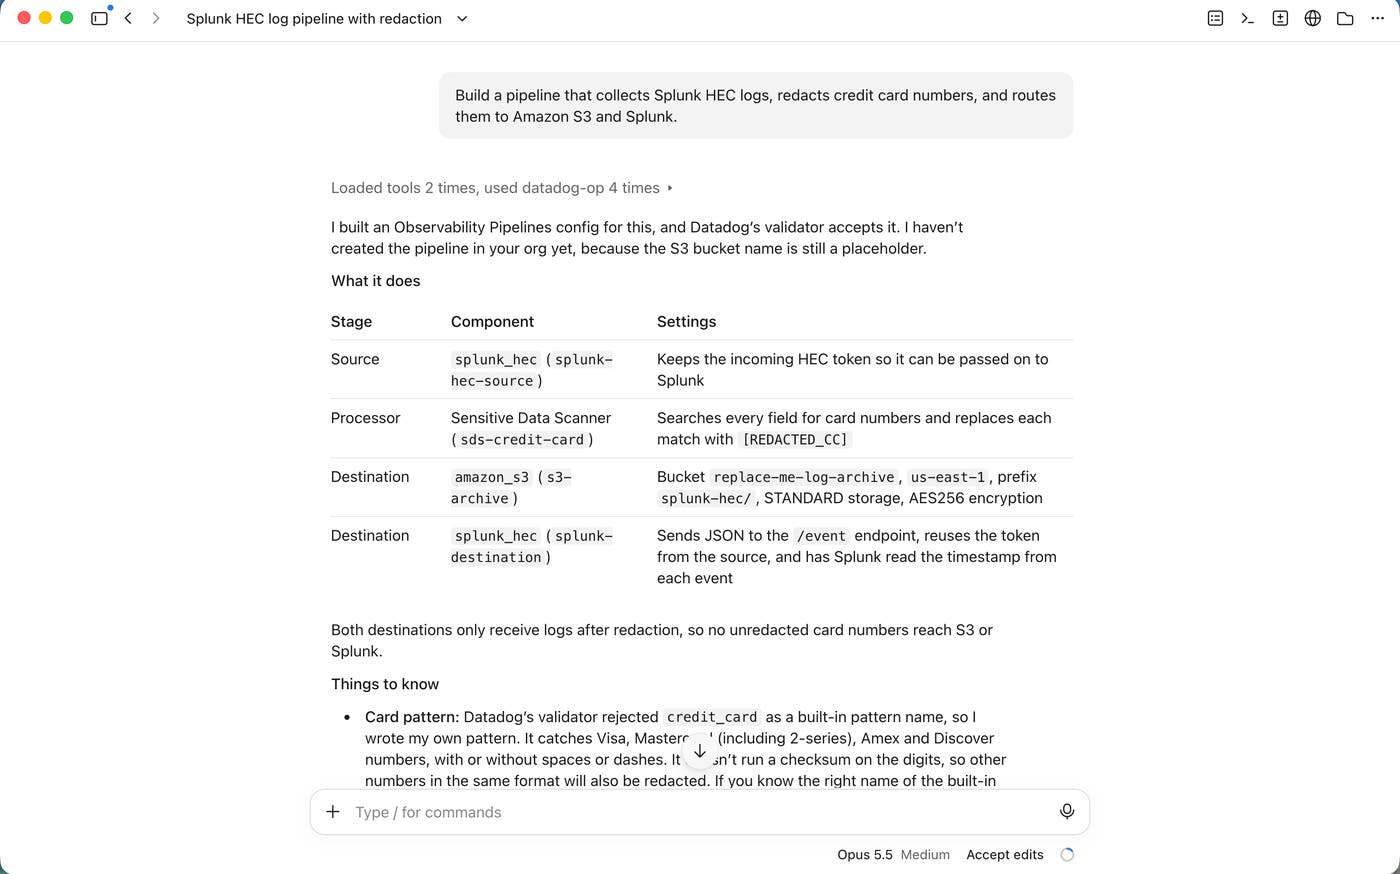
Build a pipeline that collects Splunk HEC logs, redacts credit card numbers, and routes them to Amazon S3 and Splunk.Your agent works through three steps:
Discover components: Without arguments,
get_observability_pipeline_component_schemareturns the available source, processor, and destination types. When your agent requests specific components, such as the splunk_hec source and theamazon_s3destination, the tool returns their fields, including which are required, their types, and allowed values.Validate the draft:
validate_observability_pipelinechecks the configuration without creating or deploying anything. It returns all validation errors at once, so your agent can fix the configuration and validate it again.Create the pipeline:
create_observability_pipelinereturns the new pipeline’s ID and a link to open it in Datadog. Creating a pipeline doesn’t affect your existing pipelines. The new pipeline doesn’t process data until you install the Observability Pipelines Worker for it.
Review the new pipeline
In the following example, the agent drafts and validates the configuration and summarizes each component.
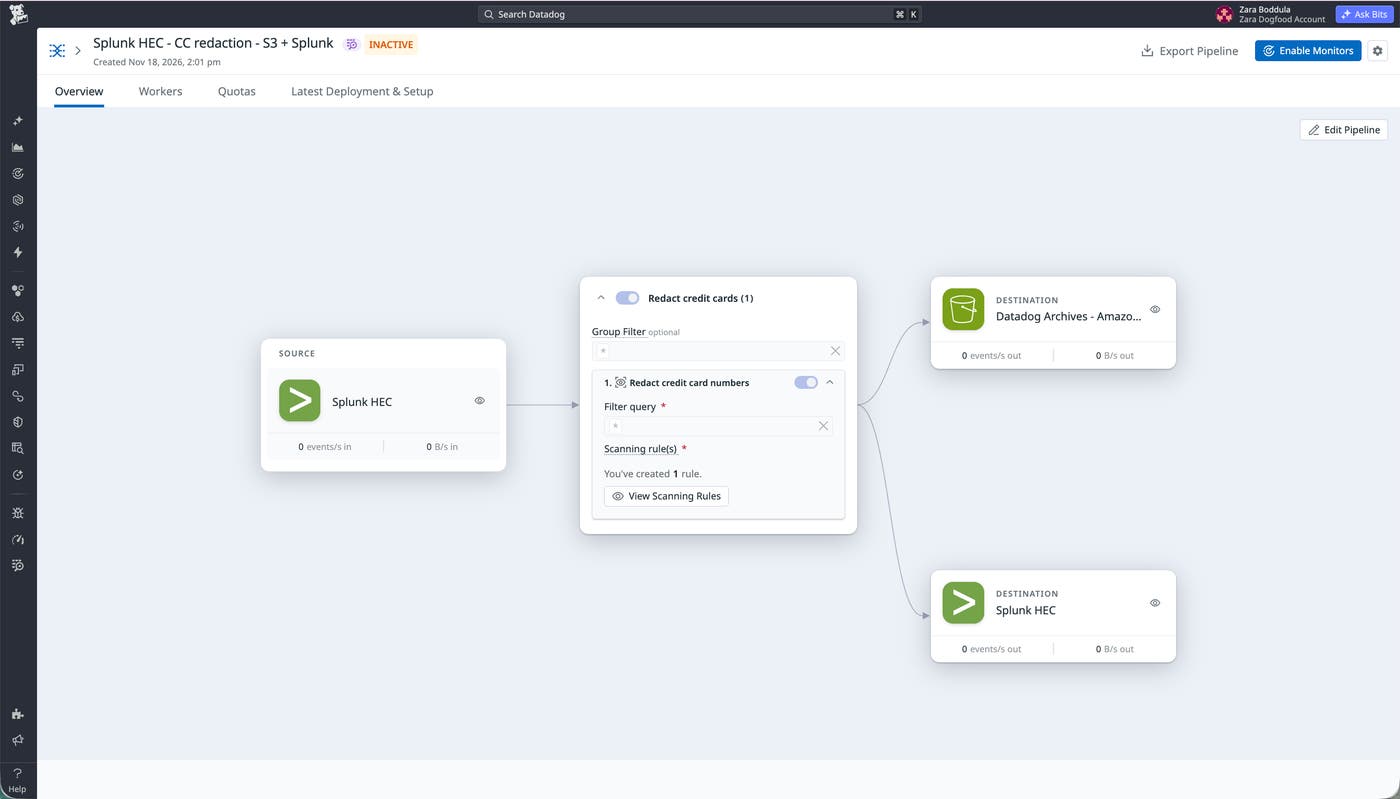
After the agent creates the pipeline, you can review its source, processor, and destinations in the pipeline builder.
Build pipelines for other use cases
You can use the same approach for other common use cases. For example, you can ask your agent to dual ship logs to Datadog and a SIEM or archive raw logs to cloud storage. You can also have it send security logs and application logs to different destinations. Supported destinations include Datadog, Splunk, Amazon S3, Google Security Operations, and Microsoft Sentinel.
Check the health of a pipeline
When a dashboard goes flat or an alert stops firing, a common first question is whether the logs are still arriving. Your agent can use the observability-pipelines and core toolsets together. With both toolsets, it can pair a pipeline’s configuration with the metrics that its Observability Pipelines Workers send to Datadog.
When you’re on call, you might ask your agent:
Is the Prod Agent Logs pipeline healthy? Are any events being dropped before they reach their destinations?Your agent first finds the pipeline with list_observability_pipelines. It then maps the pipeline’s sources, processors, and destinations with describe_observability_pipeline. Finally, it queries the pipeline usage metrics tagged with the pipeline’s pipeline_id and each component_id. These metrics give your agent the same signals you’d find on the pipeline’s Health and Workers tabs:
Events received and sent by each component
Events discarded intentionally and unintentionally
Errors for each destination, and requests for HTTP-based destinations
Destination buffer size
Worker CPU and memory usage
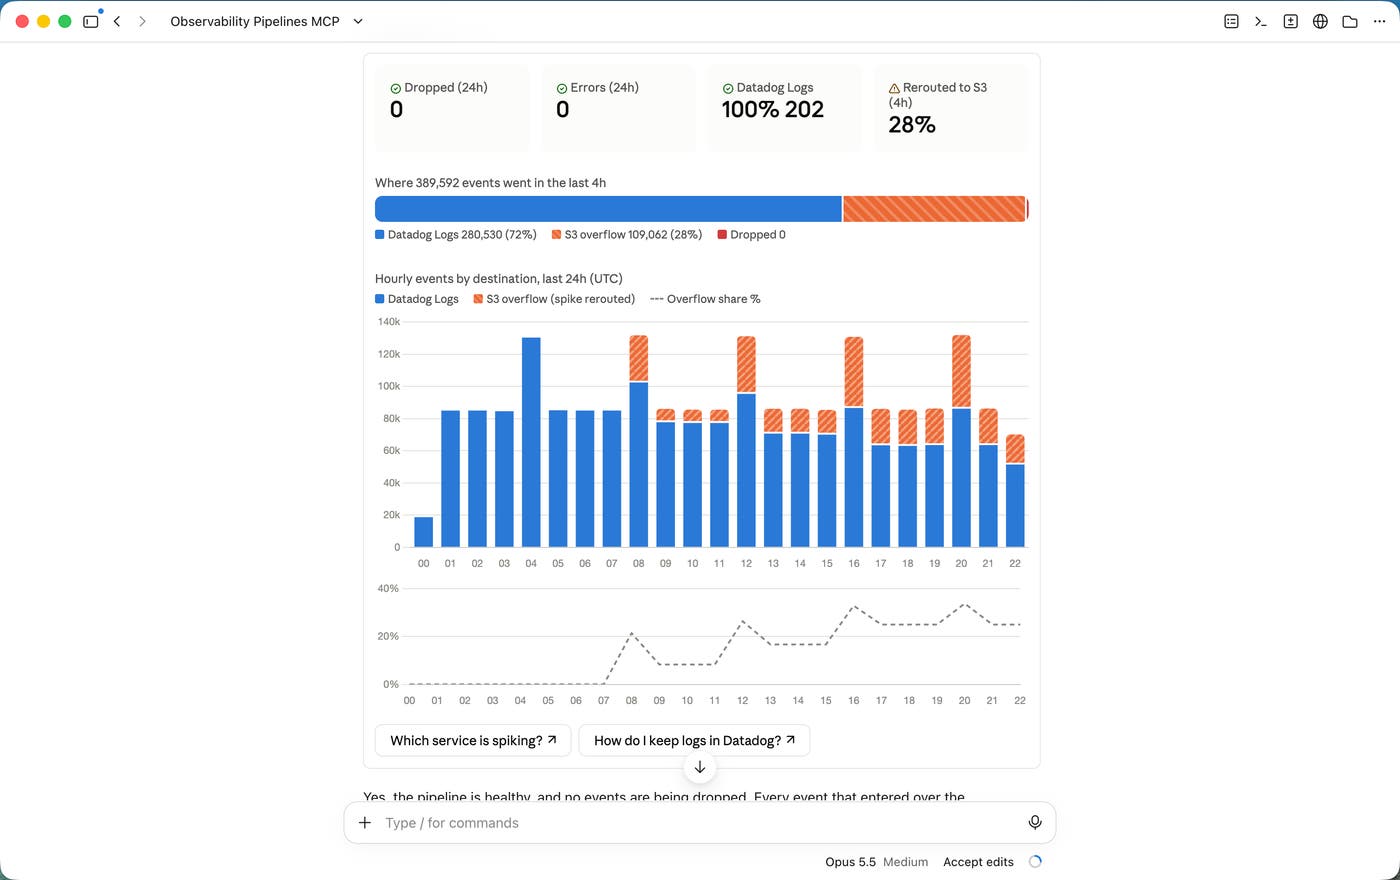
Your agent can summarize these findings in plain language. It can explain which destinations are returning errors, whether buffers are filling up, and whether event drops began after a configuration change. In the following example, the agent reports no dropped events and no errors over 24 hours, and notes that 28 percent of events in the last four hours were rerouted to an S3 overflow bucket.
Validate pipeline changes before you apply them
Pipelines often need updates. For example, a new compliance rule might require you to redact another field, or a noisy service might need a filter. A misconfigured change can break the dashboards, alerts, and detections that depend on the pipeline. Your agent can draft and validate each change before you review and apply it.
Describe the change
To filter a noisy service and redact a new field in the Splunk HEC pipeline from the previous example, you might ask your agent:
Add a step to the Splunk HEC pipeline that drops debug logs from the checkout service, and redact email addresses before the S3 archive. Show me what would change.Your agent retrieves the current configuration with describe_observability_pipeline, explains the current flow, and drafts the updated configuration with the new filter and redaction processors. It then checks the draft with validate_observability_pipeline and returns a before-and-after summary.
From there, you decide how to apply it. You can review and deploy the change in the pipeline builder, apply it through your existing Terraform or API workflow, or have your agent create it as a new pipeline with create_observability_pipeline and test it side by side before cutting over.
Review the proposed change
In the following example, the agent shows a configuration diff and the pipeline before and after the change. The agent adds a filter that drops debug logs from the checkout service before they reach either destination. It also adds a separate S3 route with a Sensitive Data Scanner rule that redacts credit card numbers.
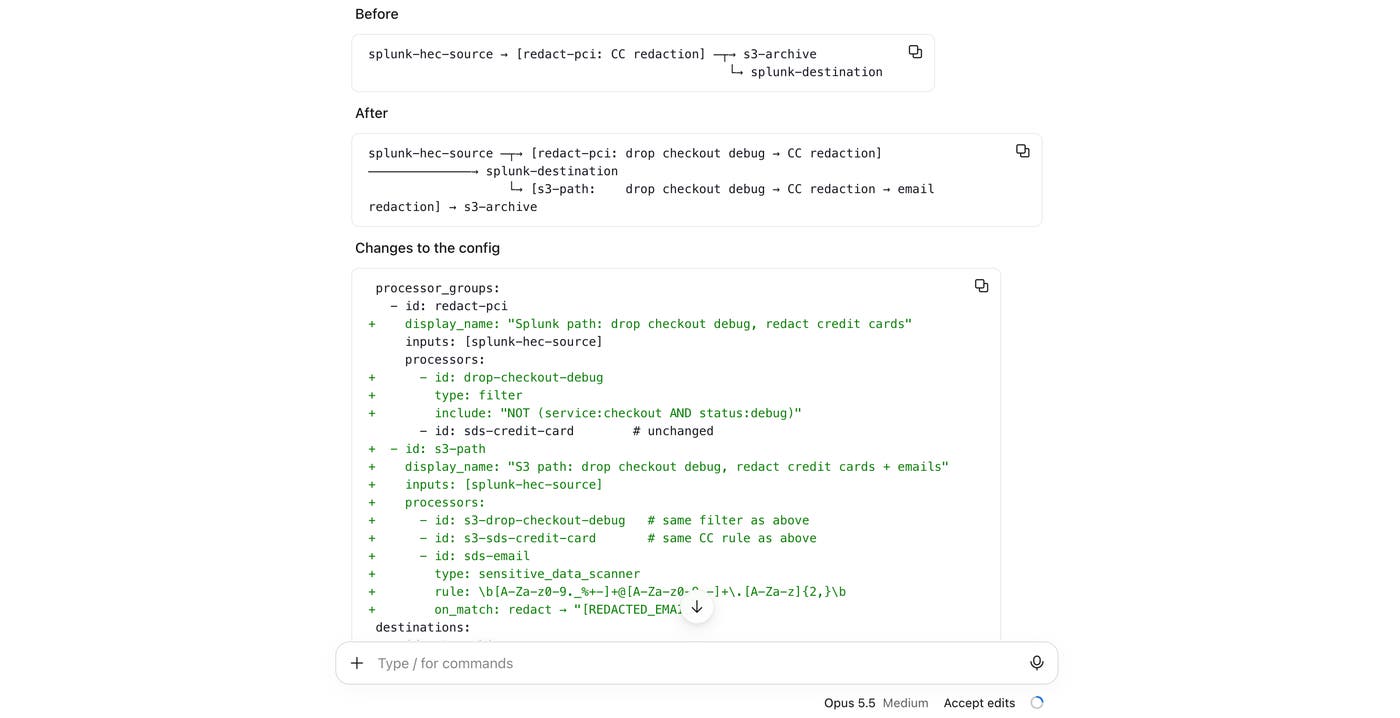
The agent then confirms that the proposed edit passes validation and that nothing in the deployed pipeline has changed. It asks whether to apply the edit as shown.

Apply the change
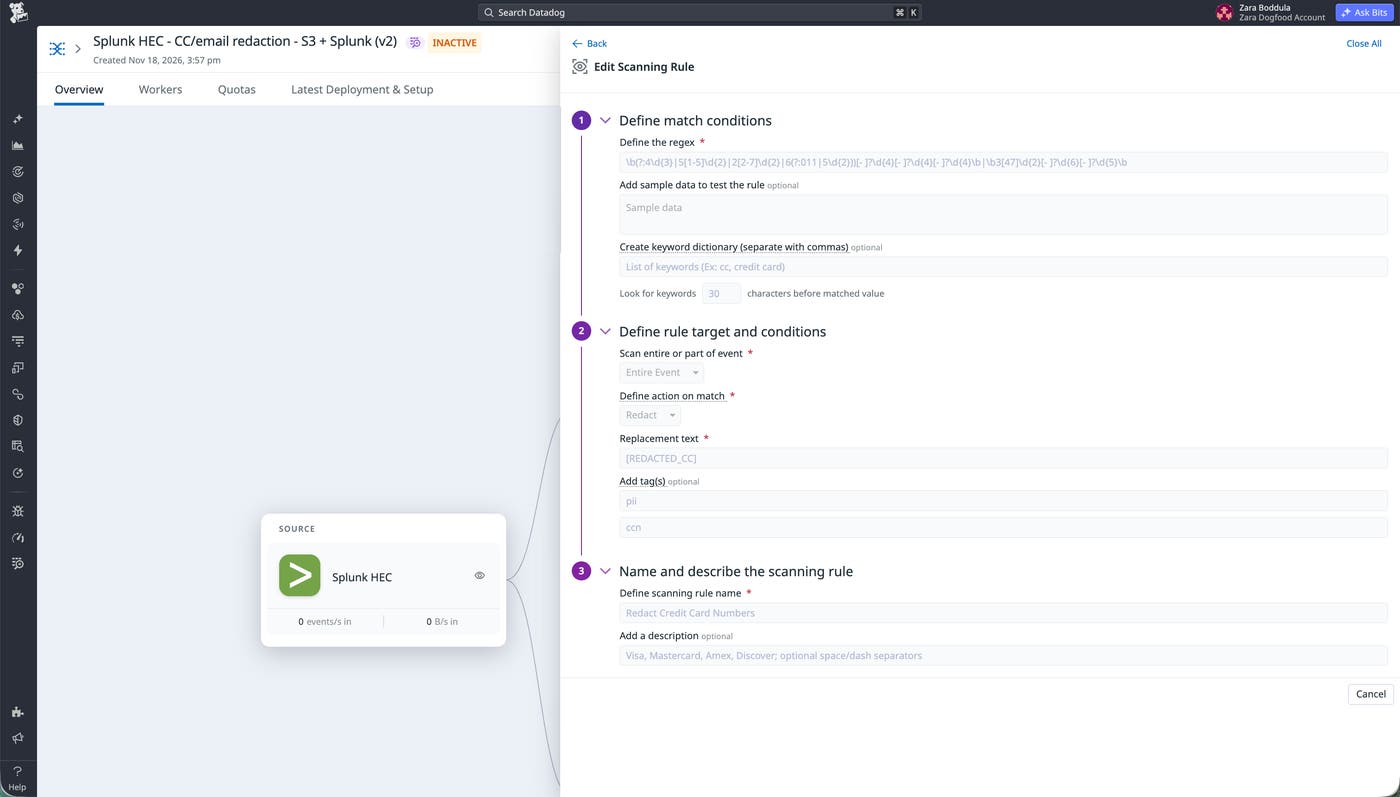
After you approve the edit, the agent creates the updated configuration as a new pipeline. In the pipeline builder, you can review what each Sensitive Data Scanner rule looks for, which part of the event it scans, and how it redacts what it finds.
Verify volume reduction
A telemetry pipeline helps you control the volume that reaches your most expensive destinations. Common strategies for reducing log volume include dropping low-value events, sampling noisy sources, and converting high-volume logs into metrics. Measuring the result is harder. You need to show how much each change reduced volume and check that the pipeline isn’t dropping events unintentionally.
Add a pack to reduce log volume
Observability Pipelines Packs are predefined configurations for specific log sources, such as AWS CloudTrail, Palo Alto Firewall, Zscaler, Cloudflare, Akamai, and Fastly. Each pack applies Datadog-recommended processing that defines which logs to drop, which to keep or parse, and which fields to remove. To reduce the log volume you send to your SIEM or data lake, add a pack to a new or existing pipeline. Then ask your agent to measure how much volume the pack removed.
Measure what the pack removed
After you add the Fortinet Firewall pack to a pipeline, you might ask your agent:
Compare how many events the Fortinet pipeline sent to Splunk today versus yesterday. How much did the pack remove, and were any unintended events discarded?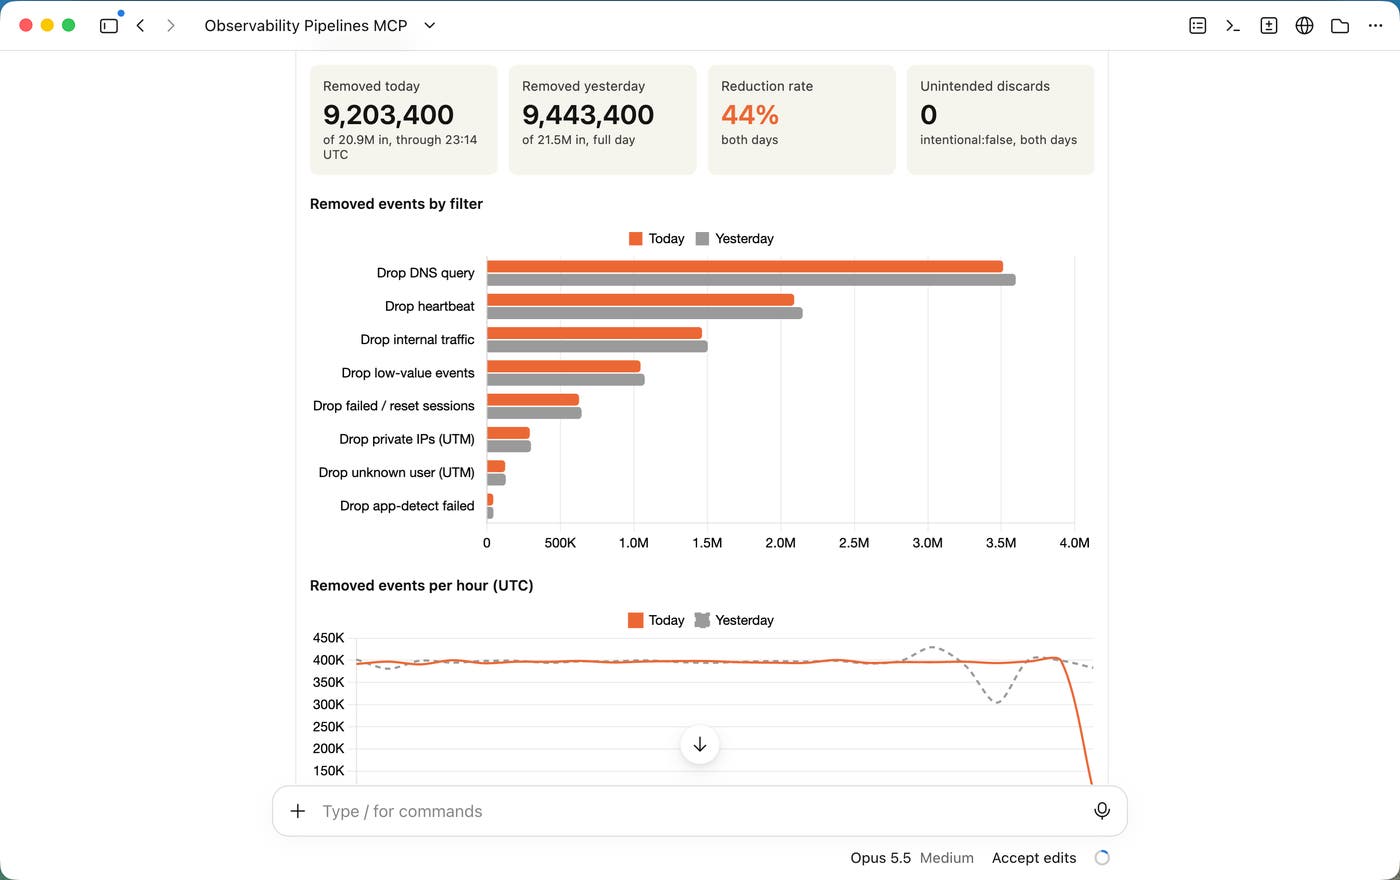
Your agent queries events received and sent for each component_id, then compares the two periods. Each pipeline usage metric also carries a rc_version tag, which increments each time the pipeline is updated. With this tag, your agent can trace the reduction to the configuration version that introduced it.
The agent then reports how many events each of the pack’s filters removed and whether any unintended discards occurred. In the example above, the pack’s filters removed 44 percent of events today, with no unintended discards. You can check the numbers in a Datadog dashboard or notebook by graphing the same pipeline usage metrics that the agent queried.
Stay in control of what gets deployed
The Observability Pipelines toolset lets your agent explain, draft, validate, and create pipelines. Your team decides when a new pipeline starts processing data. The toolset works within these limits:
The toolset doesn’t change existing pipelines: It can read existing pipelines, but it can’t update or delete them.
New pipelines process no data until you install the Worker:
create_observability_pipelinereturns a link to the new pipeline in Datadog, so you can review it before you install the Observability Pipelines Worker to run it.Your agent can validate before it creates: Your agent can check a configuration with
validate_observability_pipelinewithout creating anything. If a configuration fails validation,create_observability_pipelinereturns the errors.Your permissions apply: Your agent has the same access controls as the user who connects it. Creating a pipeline requires the Observability Pipelines Deploy permission, and the other tools require Observability Pipelines Read. Your role also needs the MCP Read permission for the read tools and the MCP Write permission to create pipelines.
Get started with Observability Pipelines in the Datadog MCP Server
The Observability Pipelines MCP tools give your AI agent access to the configurations and metrics behind your telemetry pipelines. Your agent can draft new pipelines and changes, check pipeline health, and measure volume reduction. To try the tools:
Connect the Datadog MCP Server to your AI client by following the setup instructions for that client.
Enable the
coreandobservability-pipelinestoolsets. For most clients, add?toolsets=core,observability-pipelinesto your MCP Server endpoint URL.Try a prompt such as “List our pipelines modified in the last week” or “Create a logs pipeline that receives logs from the Datadog Agent, drops debug logs, and sends the rest to Datadog.”
See the Datadog MCP Server tools documentation for the full list of Observability Pipelines MCP tools and example prompts.
If you’re not already a Datadog customer, sign up for a free 14-day trial.
