Kafka seldom runs in isolation. It is typically deployed within varied data pipelines and application stacks, integrating with components such as Kafka Connect, stream-processing services, data stores, schema registries, and—for legacy deployments—Apache ZooKeeper. To monitor Kafka comprehensively, visibility into these broader systems is essential.
Previously in this series, we examined the key metrics for monitoring Kafka and how to collect them. In this post, we’ll examine the importance of monitoring Kafka in its full-stack context, whether you manage your deployment yourself or use a managed service such as Amazon MSK or Confluent Cloud. We’ll show you how, with Data Streams Monitoring and more, Datadog can help you quickly gain end-to-end visibility into your data pipelines and seamlessly correlate telemetry from throughout your distributed infrastructure, providing comprehensive insight into your Kafka-driven systems.
Integrating Datadog and Kafka
In this section, we’ll describe how to install the Datadog Agent to collect metrics, logs, and traces from your Kafka deployment. First you’ll need to ensure that Kafka is sending JMX data, then install and configure the Datadog Agent on each of your producers, consumers, and brokers.
Verify Kafka
Before you begin, you must verify that Kafka is configured to report metrics via JMX. Confirm that Kafka is sending JMX data to your chosen JMX port, and then connect to that port with JConsole.
Verify ZooKeeper
If you’re using ZooKeeper, check that it is sending JMX data to its designated port by connecting with JConsole. You should see data from the MBeans described in Part 1.
Install the Datadog Agent
The Datadog Agent is open source software that collects metrics, logs, and distributed request traces from your hosts so that you can view and monitor them in Datadog. Installing the Agent usually takes just a single command.
Install the Agent on each host in your deployment—your Kafka brokers, producers, and consumers. If you use ZooKeeper, do the same for each host in your ZooKeeper ensemble.
If your Kafka cluster is running in containers, you can deploy the Datadog Agent as a container or Kubernetes DaemonSet instead of installing it directly on each host. You can learn more in our container monitoring documentation.
Once the Agent is up and running, you should see each host reporting metrics in your Datadog account.

Alternatively, you can send Kafka metrics and traces to Datadog via OpenTelemetry using the Datadog Distribution of the OTel Collector or the OpenTelemetry Collector.
Configure the Agent
Next, you will need to create Agent configuration files for Kafka (and ZooKeeper, where applicable). You can find the location of the Agent configuration directory for your OS here. In that directory, you will find sample configuration files for Kafka and ZooKeeper. To monitor Kafka with Datadog, you will need to edit both the Kafka and Kafka consumer Agent integration files. (See the documentation for more information on how these two integrations work together.) The configuration file for the Kafka integration is in the kafka.d/ subdirectory, and the Kafka consumer integration’s configuration file is in the kafka_consumer.d/ subdirectory. The ZooKeeper integration has its own configuration file, located in the zk.d/ subdirectory.
On each host, copy the sample YAML files in the relevant directories (the kafka.d/ and kafka_consumer.d/ directories on your brokers, and the zk.d/ directory on ZooKeeper hosts) and save them as conf.yaml.
The kafka.d/conf.yaml file includes a list of Kafka metrics to be collected by the Agent. You can use this file to configure the Agent to monitor your brokers, producers, and consumers. Change the host and port values (and user and password, if necessary) to match your setup.
You can add tags to the YAML file to apply custom dimensions to your metrics. This allows you to search and filter your Kafka monitoring data in Datadog. Because a Kafka deployment is made up of multiple components—brokers, producers, and consumers—it can be helpful to use some tags to identify the deployment as a whole and other tags to distinguish the role of each host. The sample code below uses a role tag to indicate that these metrics are coming from a Kafka broker, and a service tag to place the broker in a broader context. The service value here—signup_processor—could be shared by this deployment’s producers and consumers.
tags: - role:broker - service:signup_processorNext, in order to get broker and consumer offset information into Datadog, modify the kafka_consumer/conf.yaml file to match your setup. If your Kafka endpoint differs from the default (localhost:9092), you’ll need to update the kafka_connect_str value in this file. If you want to monitor specific consumer groups within your cluster, you can specify them in the consumer_groups value; otherwise, you can set monitor_unlisted_consumer_groups to true to tell the Agent to fetch offset values from all consumer groups.
Collect Kafka logs
You can also configure the Datadog Agent to collect logs from Kafka (and ZooKeeper, where applicable). The Agent’s log collection is disabled by default, so first you’ll need to modify the Agent’s configuration file to set logs_enabled: true.
Next, in Kafka’s conf.yaml file, uncomment the logs section and modify it if necessary to match your broker’s configuration. ZooKeeper users should do the same in ZooKeeper’s conf.yaml file, updating the tags section and the logs section to direct the Agent to collect and tag your ZooKeeper logs and send them to Datadog.
In both of the conf.yaml files, you should modify the service tag to use a common value so that Datadog aggregates logs from all the components in your Kafka deployment. Here is an example of how this looks in a Kafka configuration file that uses the same service tag we applied to Kafka metrics in the previous section:
logs: - type: file path: /var/log/kafka/server.log source: kafka service: signup_processorNote that the default source value in the Kafka configuration file is kafka. Similarly, ZooKeeper’s configuration file contains source: zookeeper. These tags allow Datadog to apply the appropriate integration pipeline to parse the logs and extract key attributes.
You can then filter your logs to display only those from the signup_processor service, making it easy to correlate logs from different components in your deployment so you can troubleshoot quickly.
Collect distributed traces
Datadog APM and distributed tracing give you expanded visibility into the performance of your services by measuring request volume and latency. You create graphs and alerts to monitor your APM data, and you can visualize the activity of a single request in a flame graph like the one shown below to better understand the sources of latency and errors.

Datadog APM can trace requests to and from Kafka clients, and will automatically instrument popular languages and web frameworks. This means you can collect traces without modifying the source code of your producers and consumers. See our documentation for guidance on getting started with APM and distributed tracing—with Single Step Instrumentation, you can jump-start APM and Data Streams Monitoring (DSM) and quickly gain expanded visibility into your Kafka clusters and pipelines (more on DSM below).
Verify configuration settings
To check that Datadog and Kafka (and ZooKeeper, where applicable) are properly integrated, first restart the Agent, and then run the status command. If the configuration is correct, the output will contain a section resembling the one below:
Running Checks ======
[...]
kafka_consumer (2.3.0) ---------------------- Instance ID: kafka_consumer:55722fe61fb7f11a [OK] Configuration Source: file:/etc/datadog-agent/conf.d/kafka_consumer.d/conf.yaml Total Runs: 1 Metric Samples: Last Run: 0, Total: 0 Events: Last Run: 0, Total: 0 Service Checks: Last Run: 0, Total: 0 Average Execution Time : 13ms
[...]
zk (2.4.0) ---------- Instance ID: zk:8cd6317982d82def [OK] Configuration Source: file:/etc/datadog-agent/conf.d/zk.d/conf.yaml Total Runs: 1,104 Metric Samples: Last Run: 29, Total: 31,860 Events: Last Run: 0, Total: 0 Service Checks: Last Run: 1, Total: 1,104 Average Execution Time : 6ms metadata: version.major: 3 version.minor: 5 version.patch: 7 version.raw: 3.5.7-f0fdd52973d373ffd9c86b81d99842dc2c7f660e version.release: f0fdd52973d373ffd9c86b81d99842dc2c7f660e version.scheme: semver
========JMXFetch========
Initialized checks ================== kafka instance_name : kafka-localhost-9999 message : metric_count : 61 service_check_count : 0 status : OKEnable the integration
Next, click the Kafka (and ZooKeeper) Install Integration buttons inside your Datadog account, under the Configuration tab in the Kafka integration settings (and ZooKeeper integration settings).
Monitoring your Kafka deployment in Datadog
Datadog provides a range of tools that enable comprehensive monitoring of your Kafka stack. In this section, we’ll examine using Data Streams Monitoring to get granular, end-to-end visibility into your streaming data pipelines, as well as monitoring cluster-level metrics and host health.
End-to-end visibility into Kafka pipelines with Data Streams Monitoring
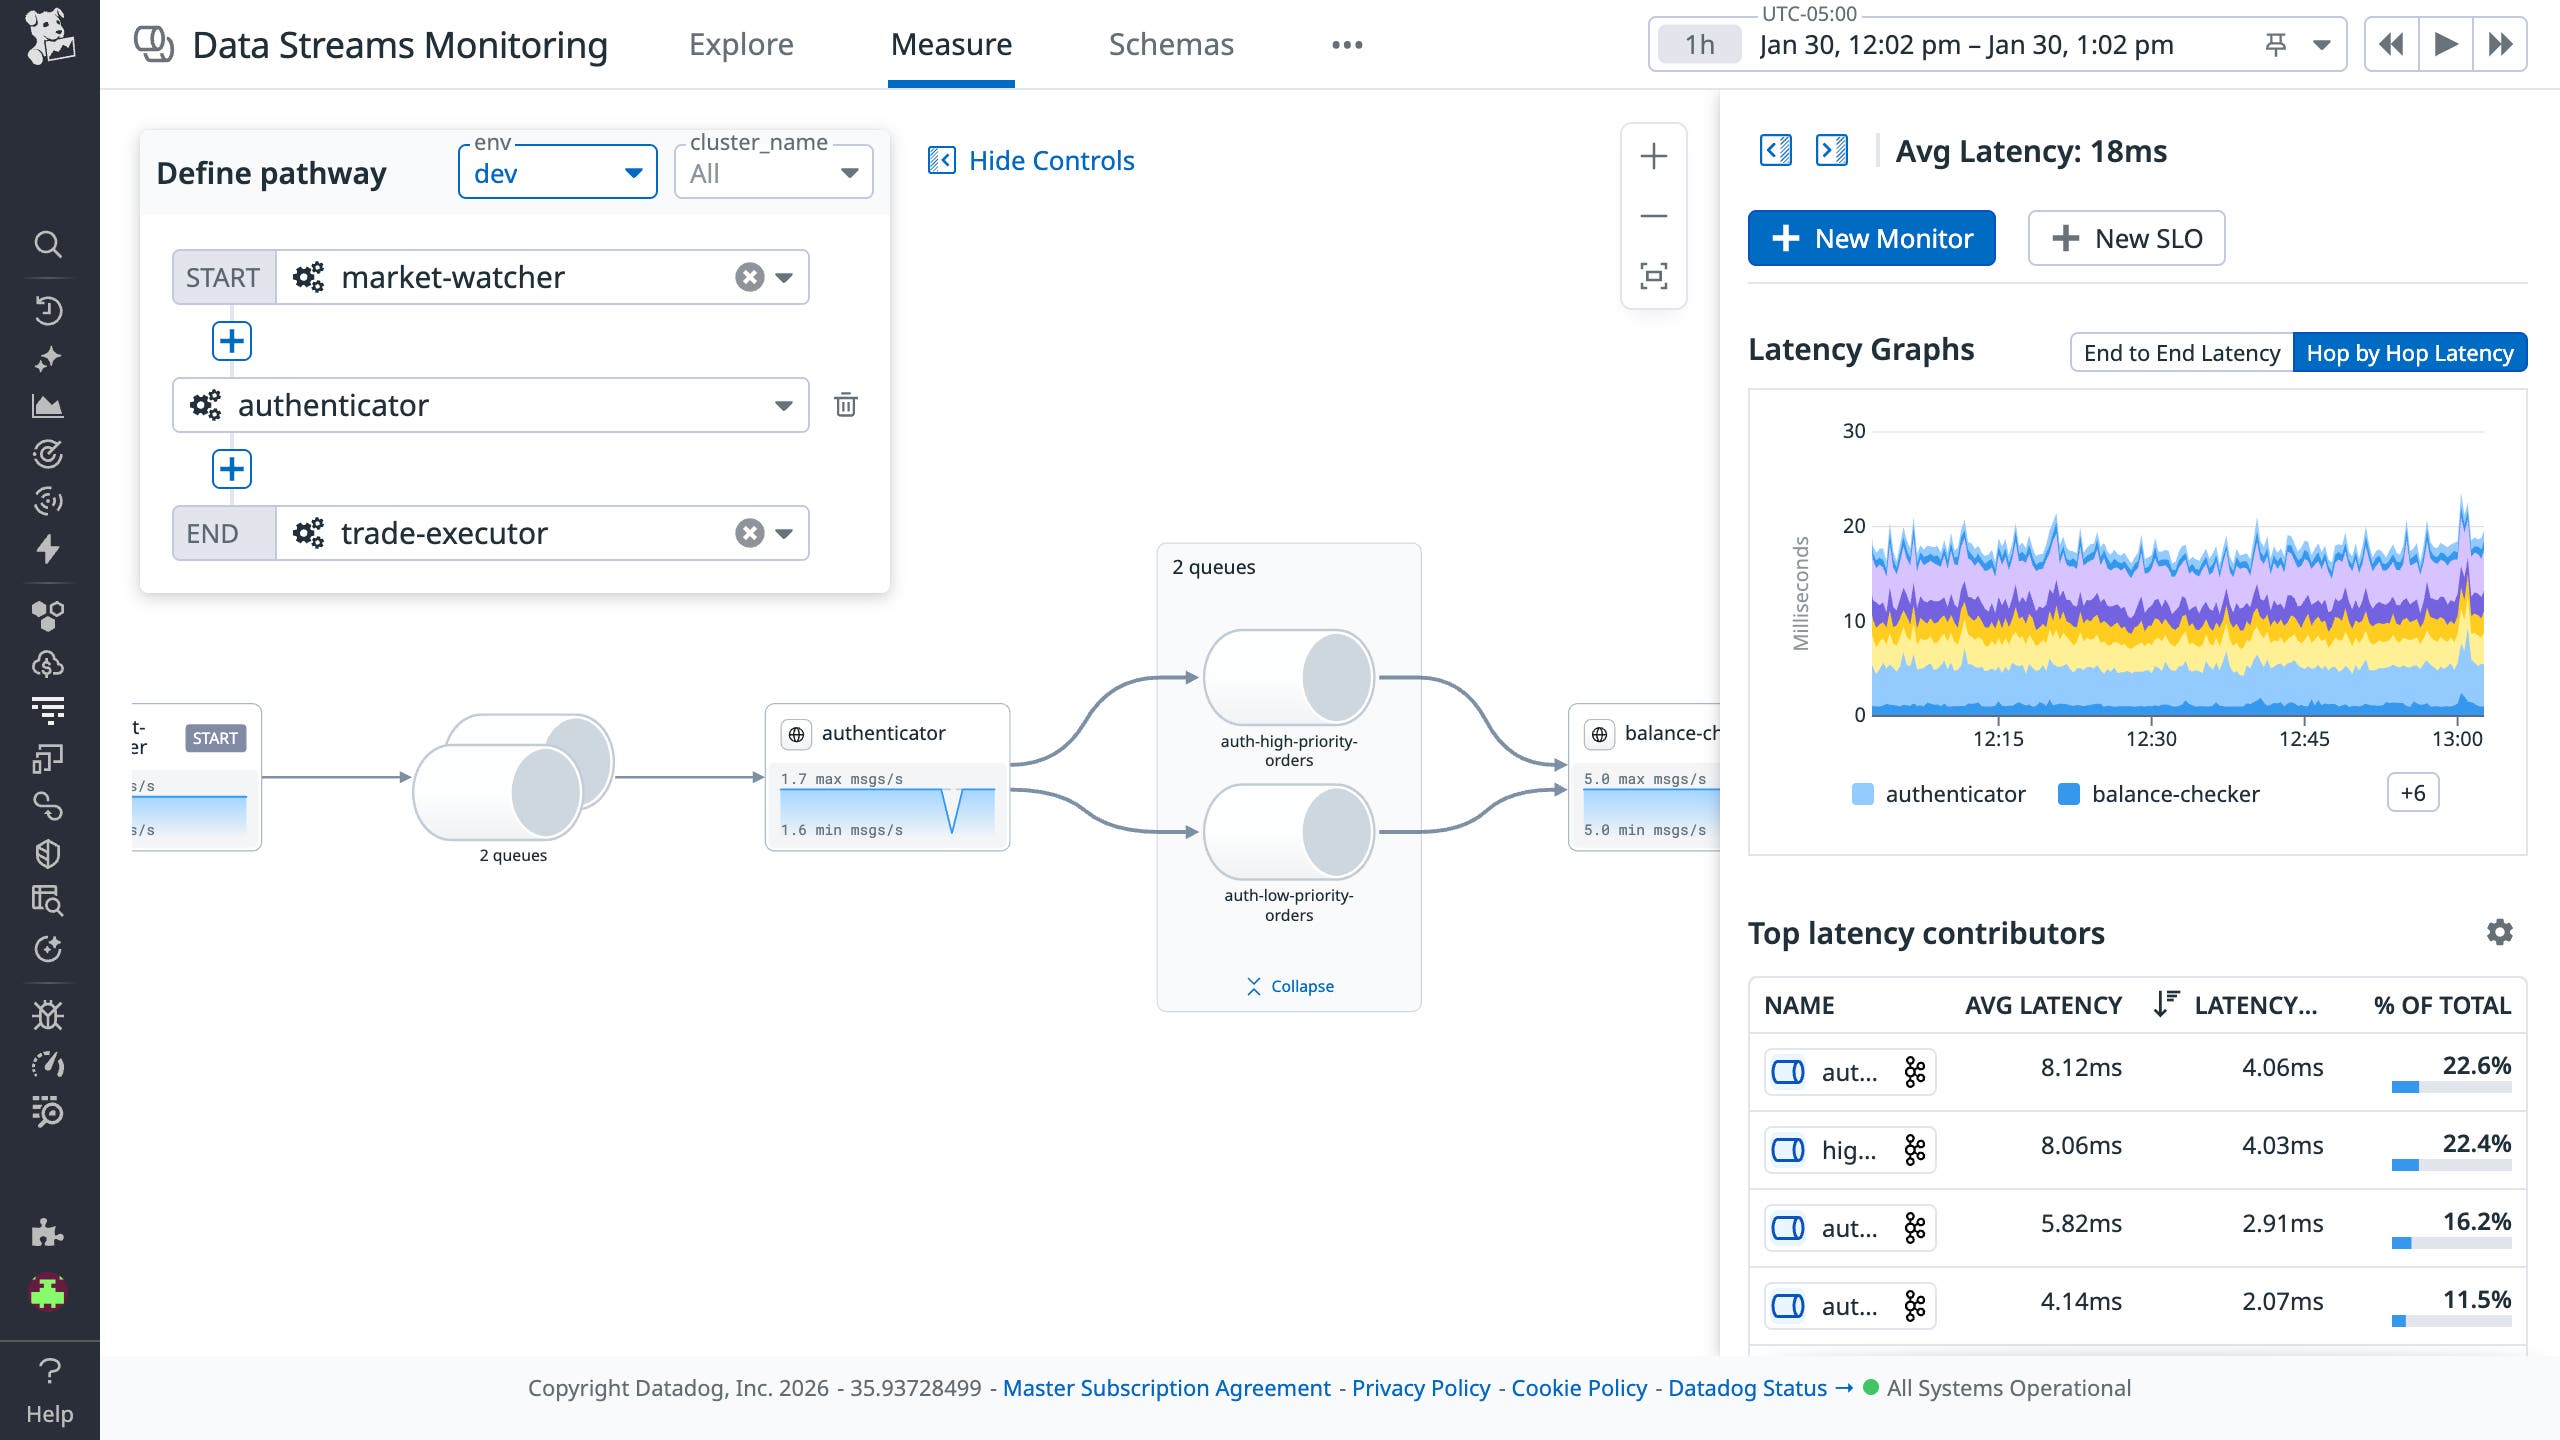
With Data Streams Monitoring (DSM), you can comprehensively track and analyze the health and performance of your Kafka clusters and end-to-end pipelines, from data producers and consumers to the services and queues that process events. DSM automatically maps your pipelines from end to end, providing granular visibility into every processing component.
DSM Kafka Admin, now available in Preview, extends this visibility to the cluster level, enabling Kafka operators to monitor lag, partition health, configurations, and schema changes across all of their clusters in a centralized UI.
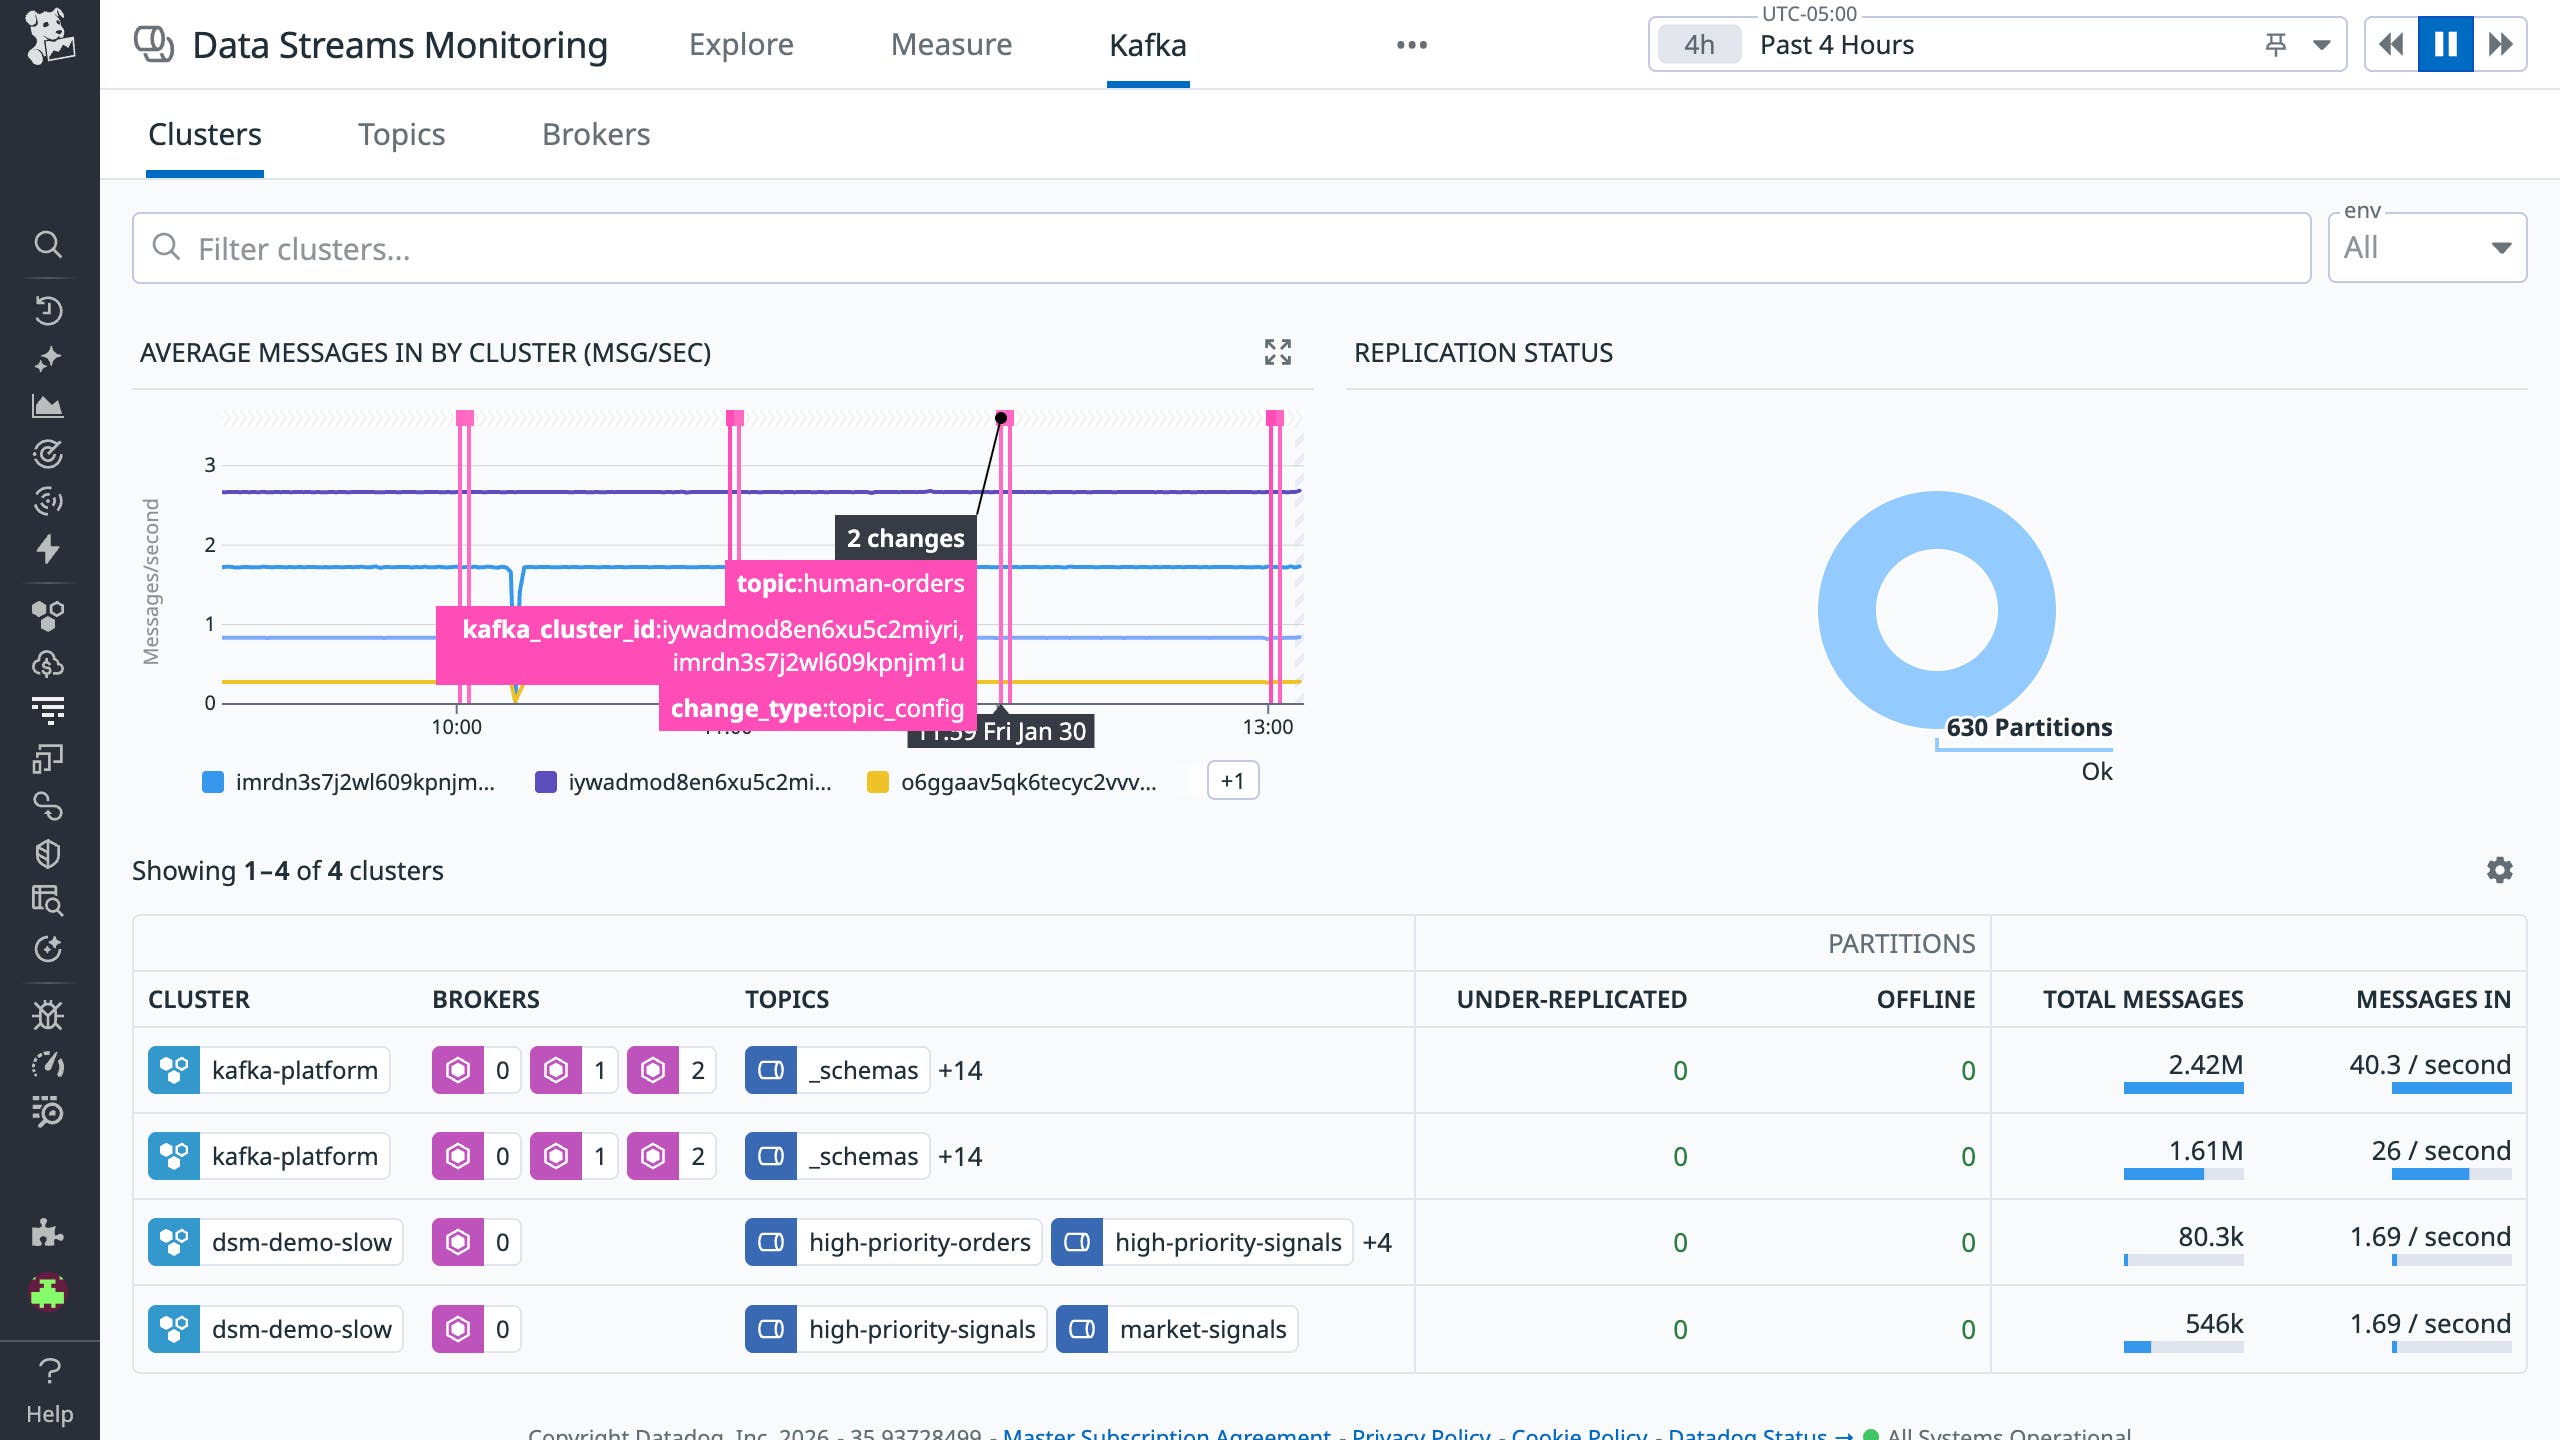
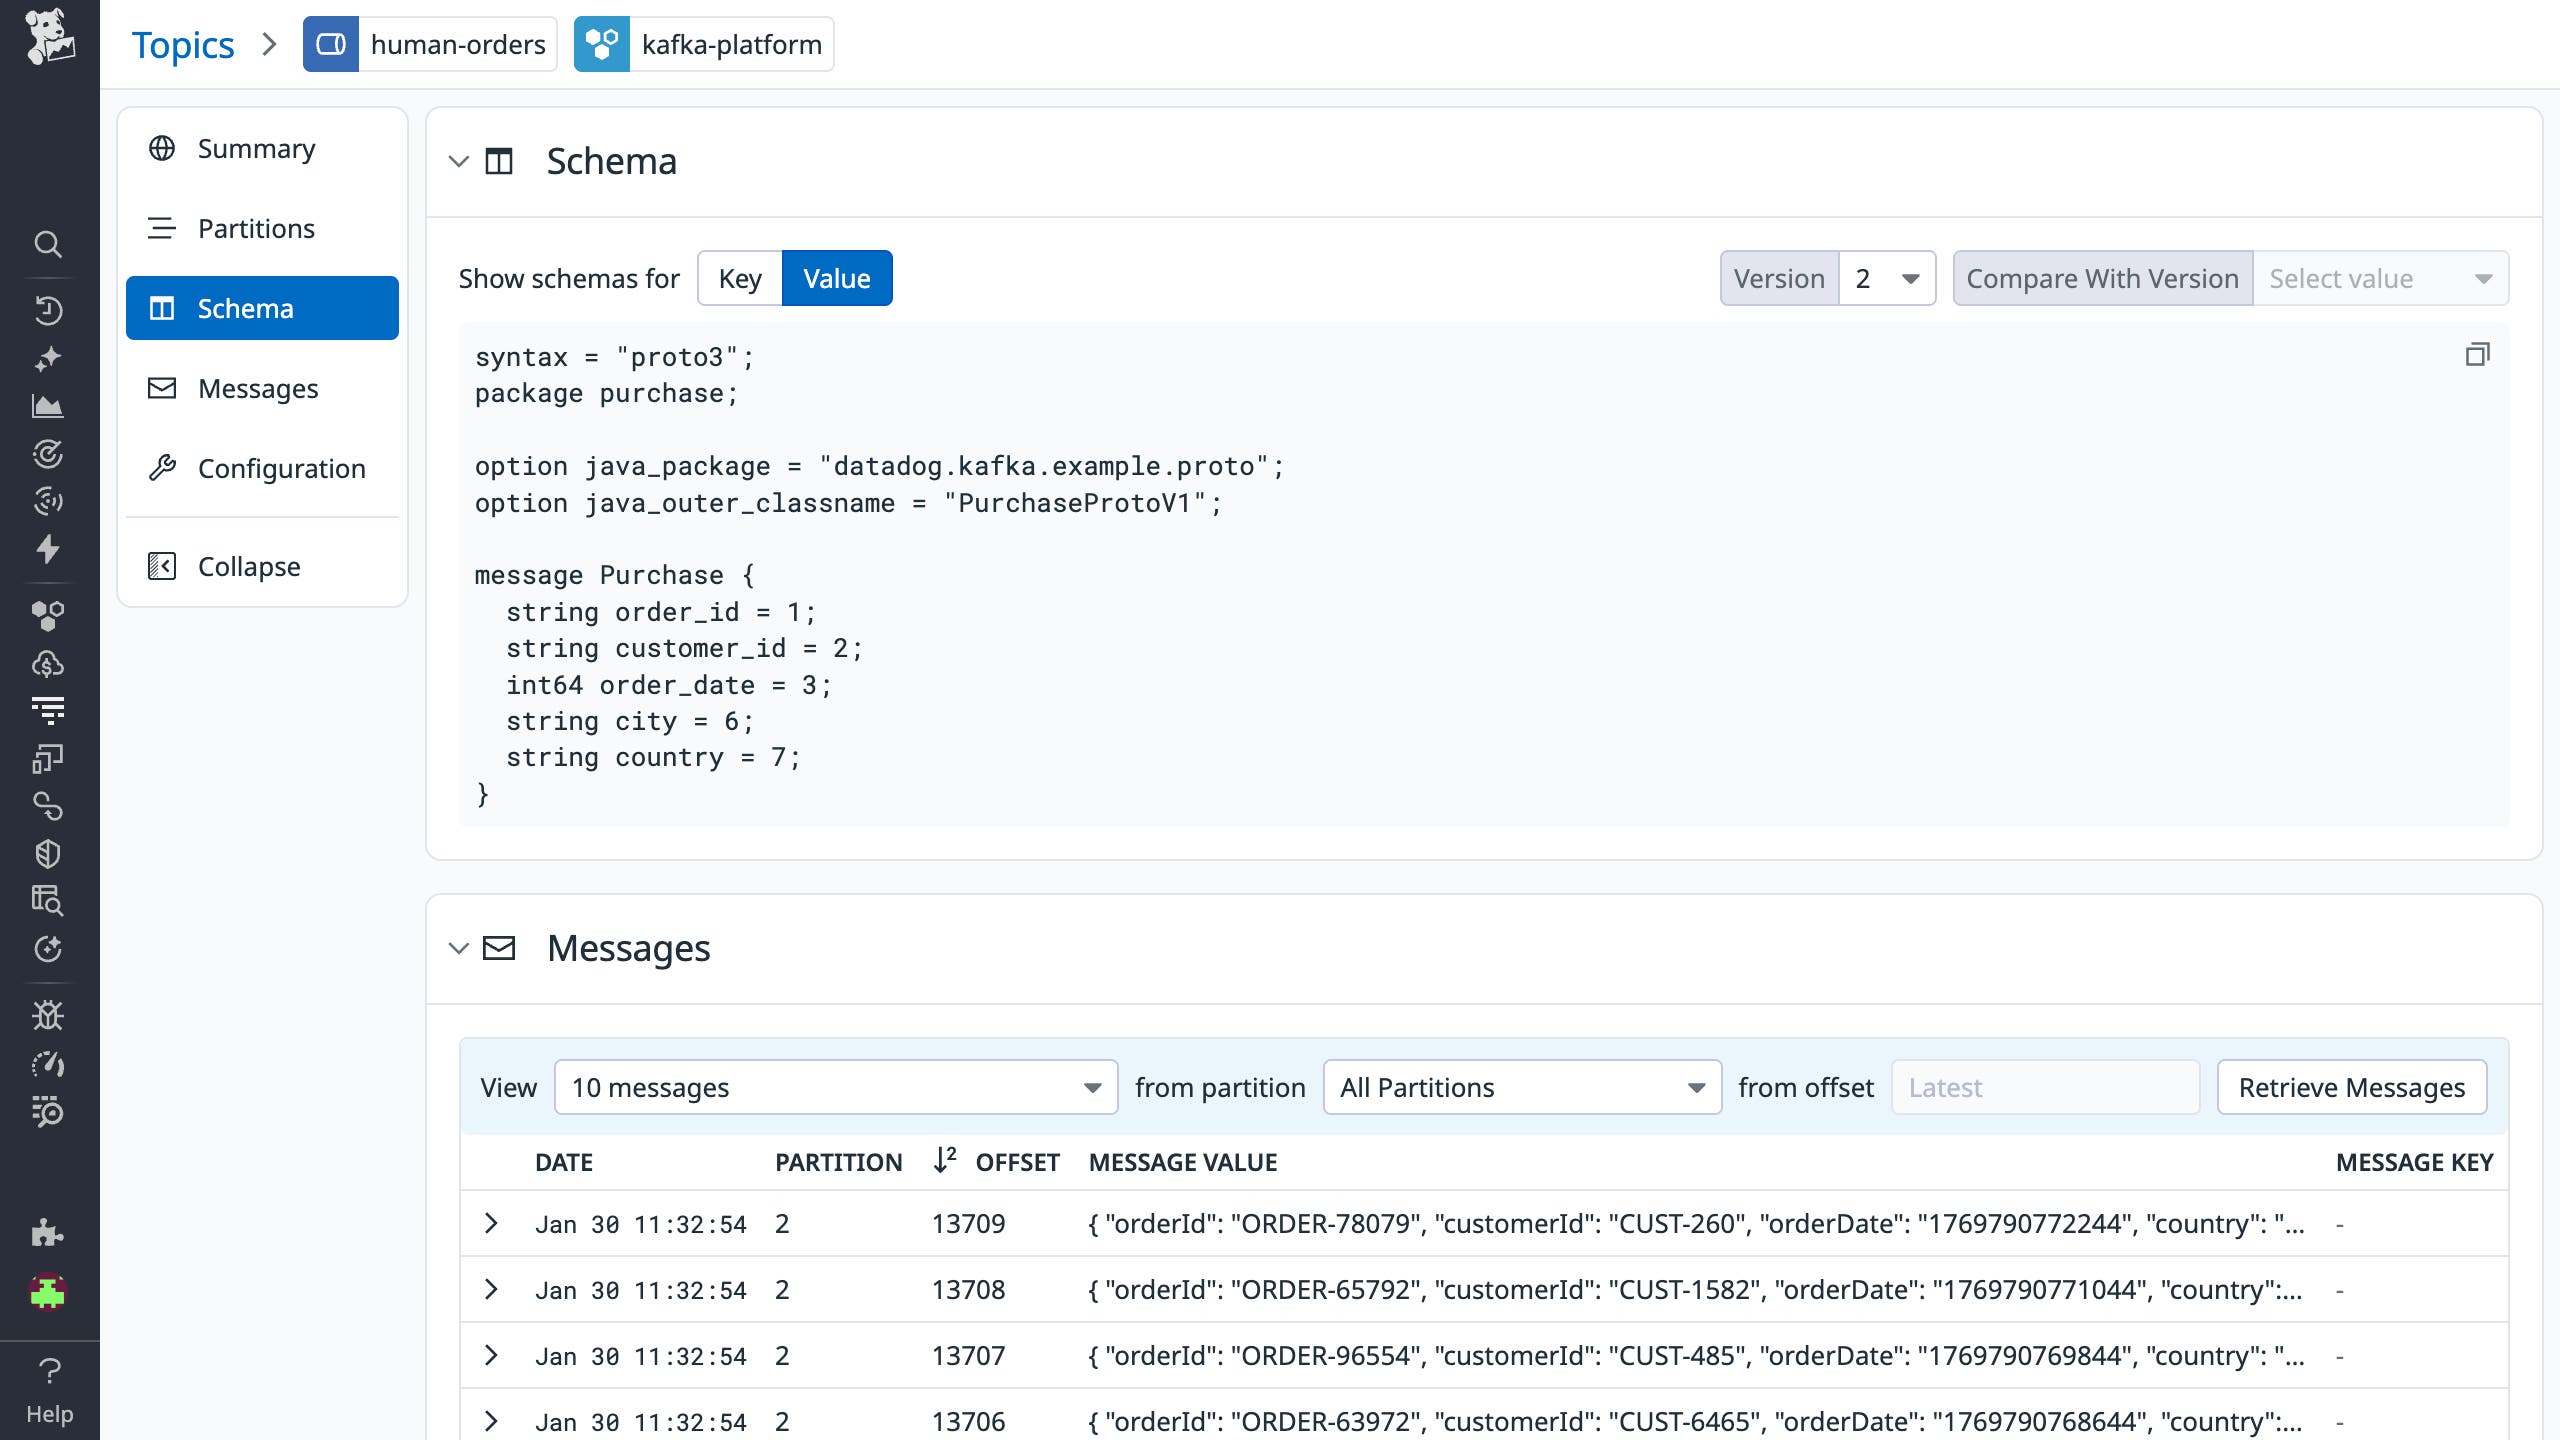
From the Kafka tab in DSM, you can track the top-level health and activity of all of your clusters and select any cluster, broker, or topic for more detail. For example, you can inspect topic schemas and messages (as shown below).
The end-to-end visibility DSM provides into pipelines enables you to monitor latency between any two points, detect message delays, pinpoint the root cause of bottlenecks, and spot floods of backed-up messages.
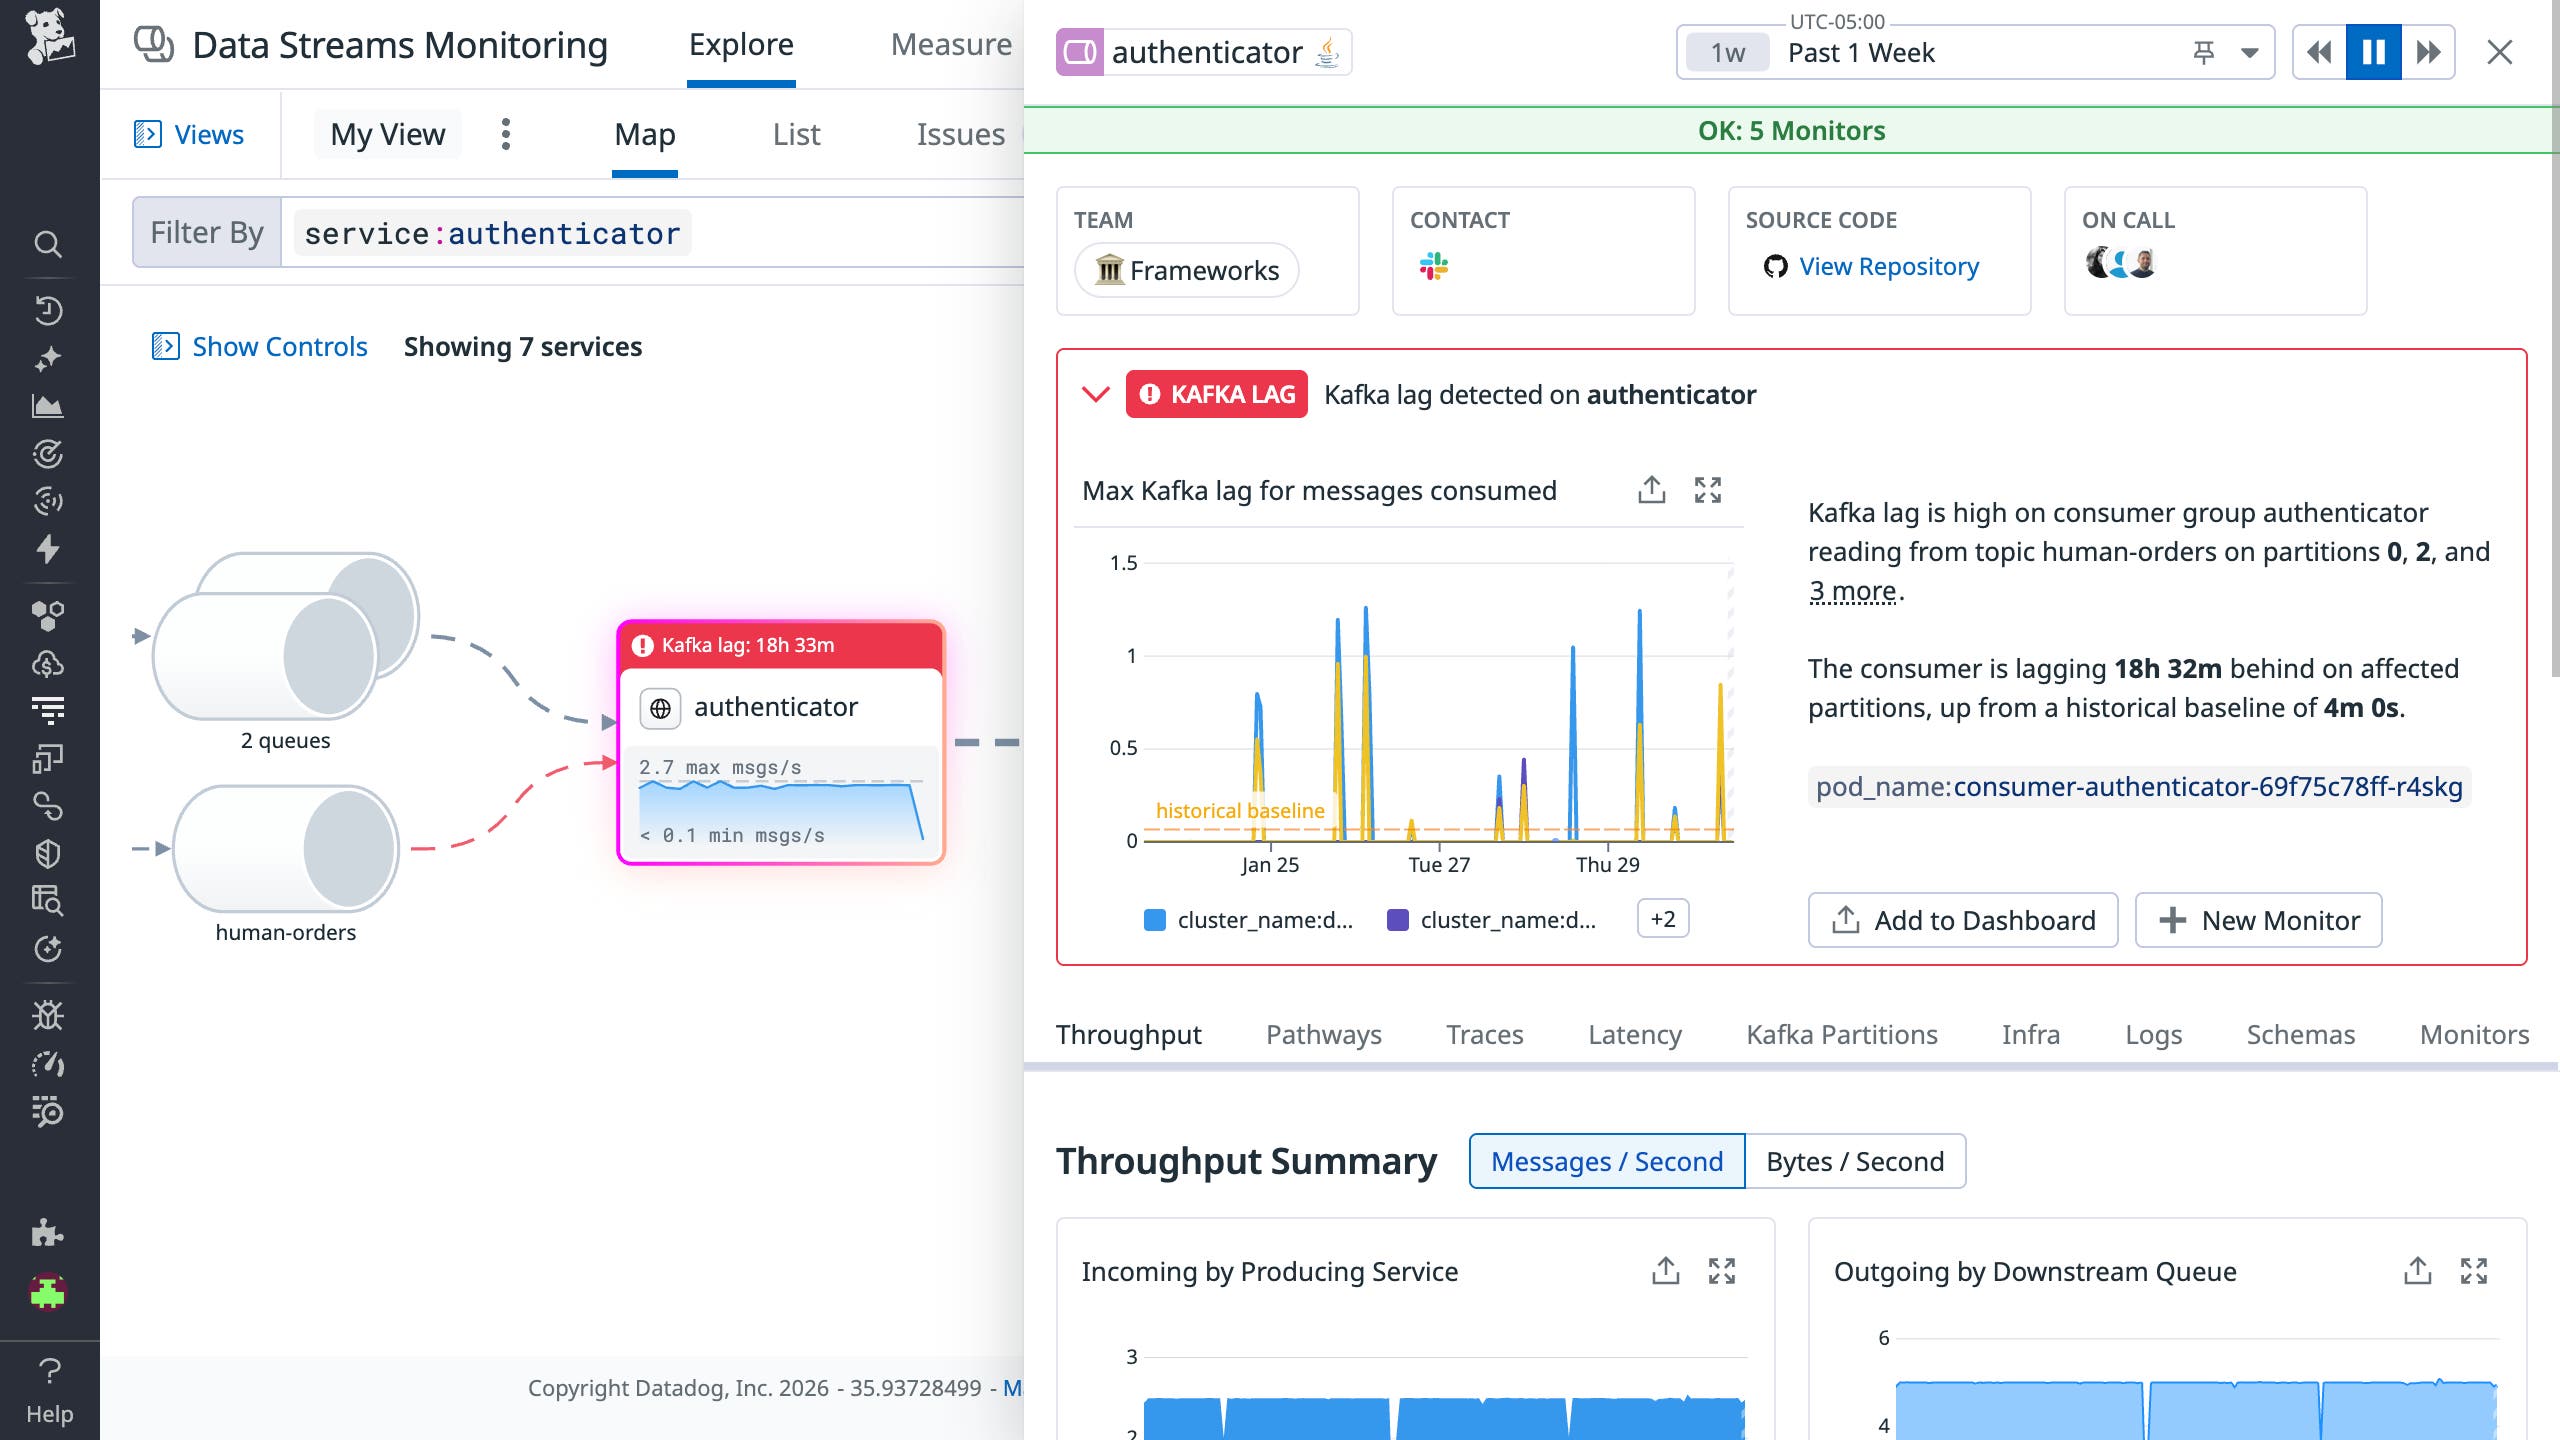
As shown below, DSM also automatically flags issues such as Kafka lag.
Once the Agent begins reporting metrics from your deployment, you will see a comprehensive Kafka dashboard among your list of available dashboards in Datadog. The default Kafka dashboard displays the key metrics highlighted in our introduction to monitoring Kafka alongside data from Data Streams Monitoring and logs.
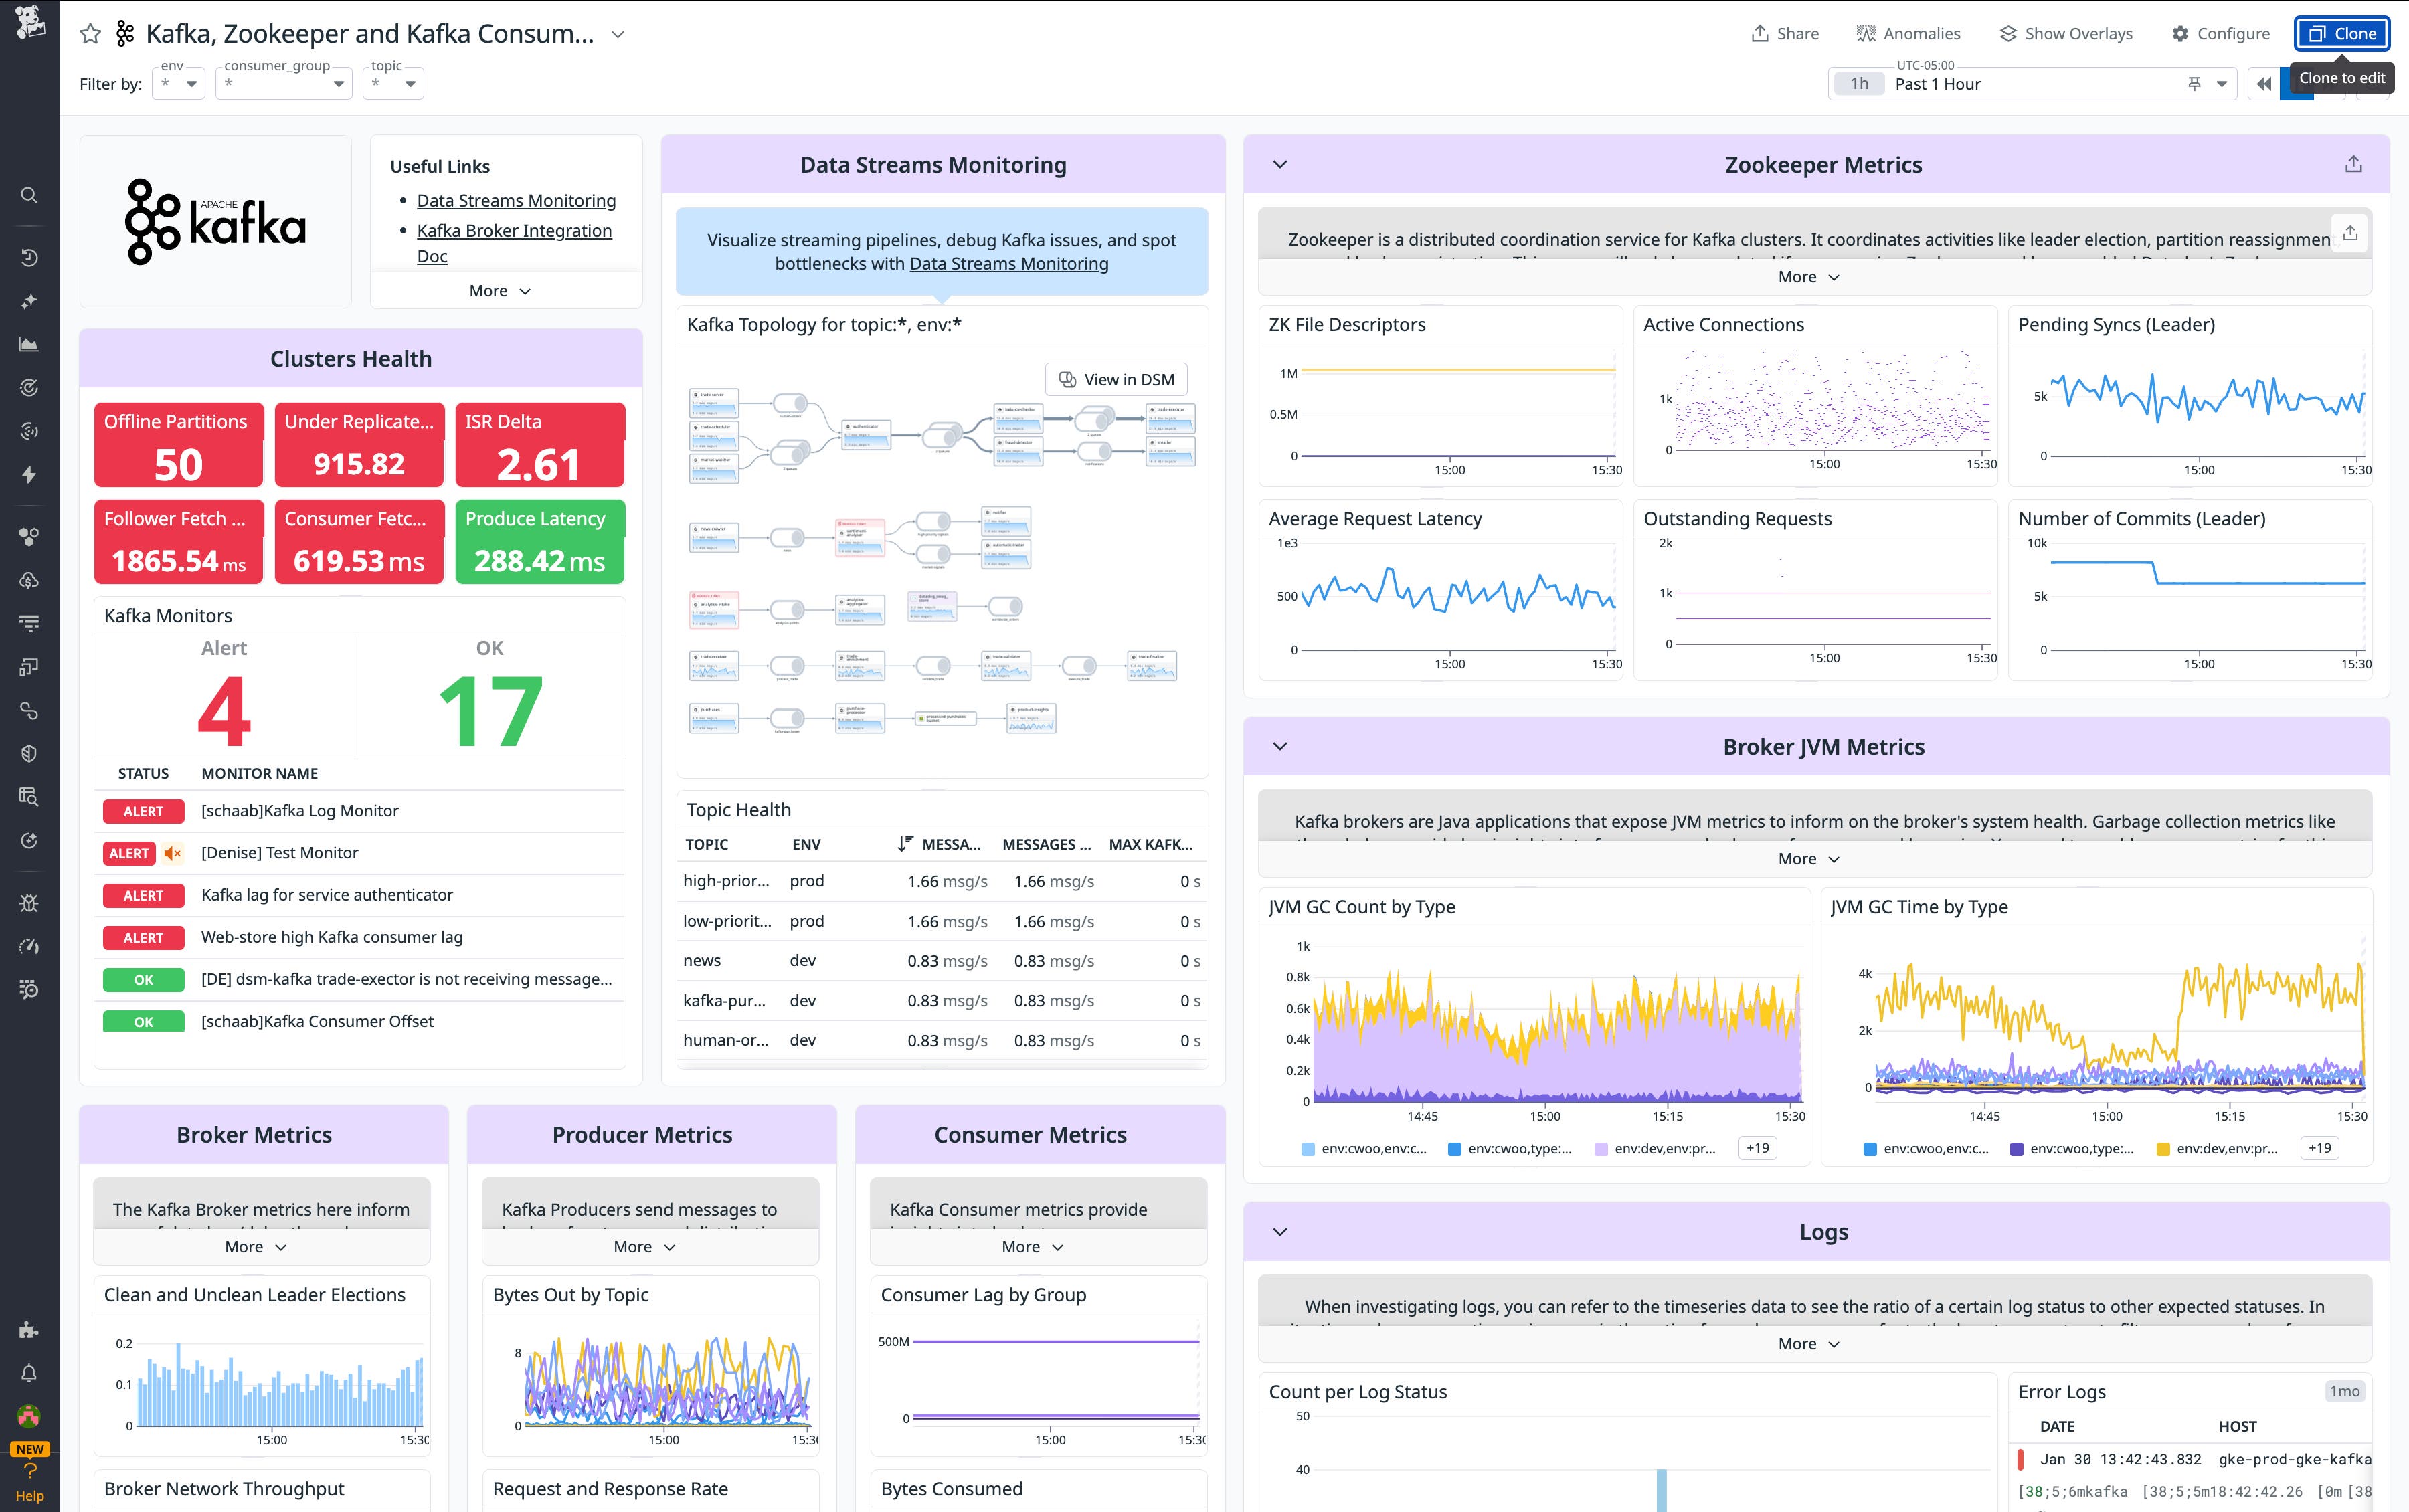
You can easily create a more comprehensive dashboard to monitor your entire web stack by adding additional graphs and metrics from your other systems. For example, you might want to graph Kafka metrics alongside metrics from HAProxy or host-level metrics such as memory usage. To start customizing this dashboard, clone it by clicking Clone in the upper right.
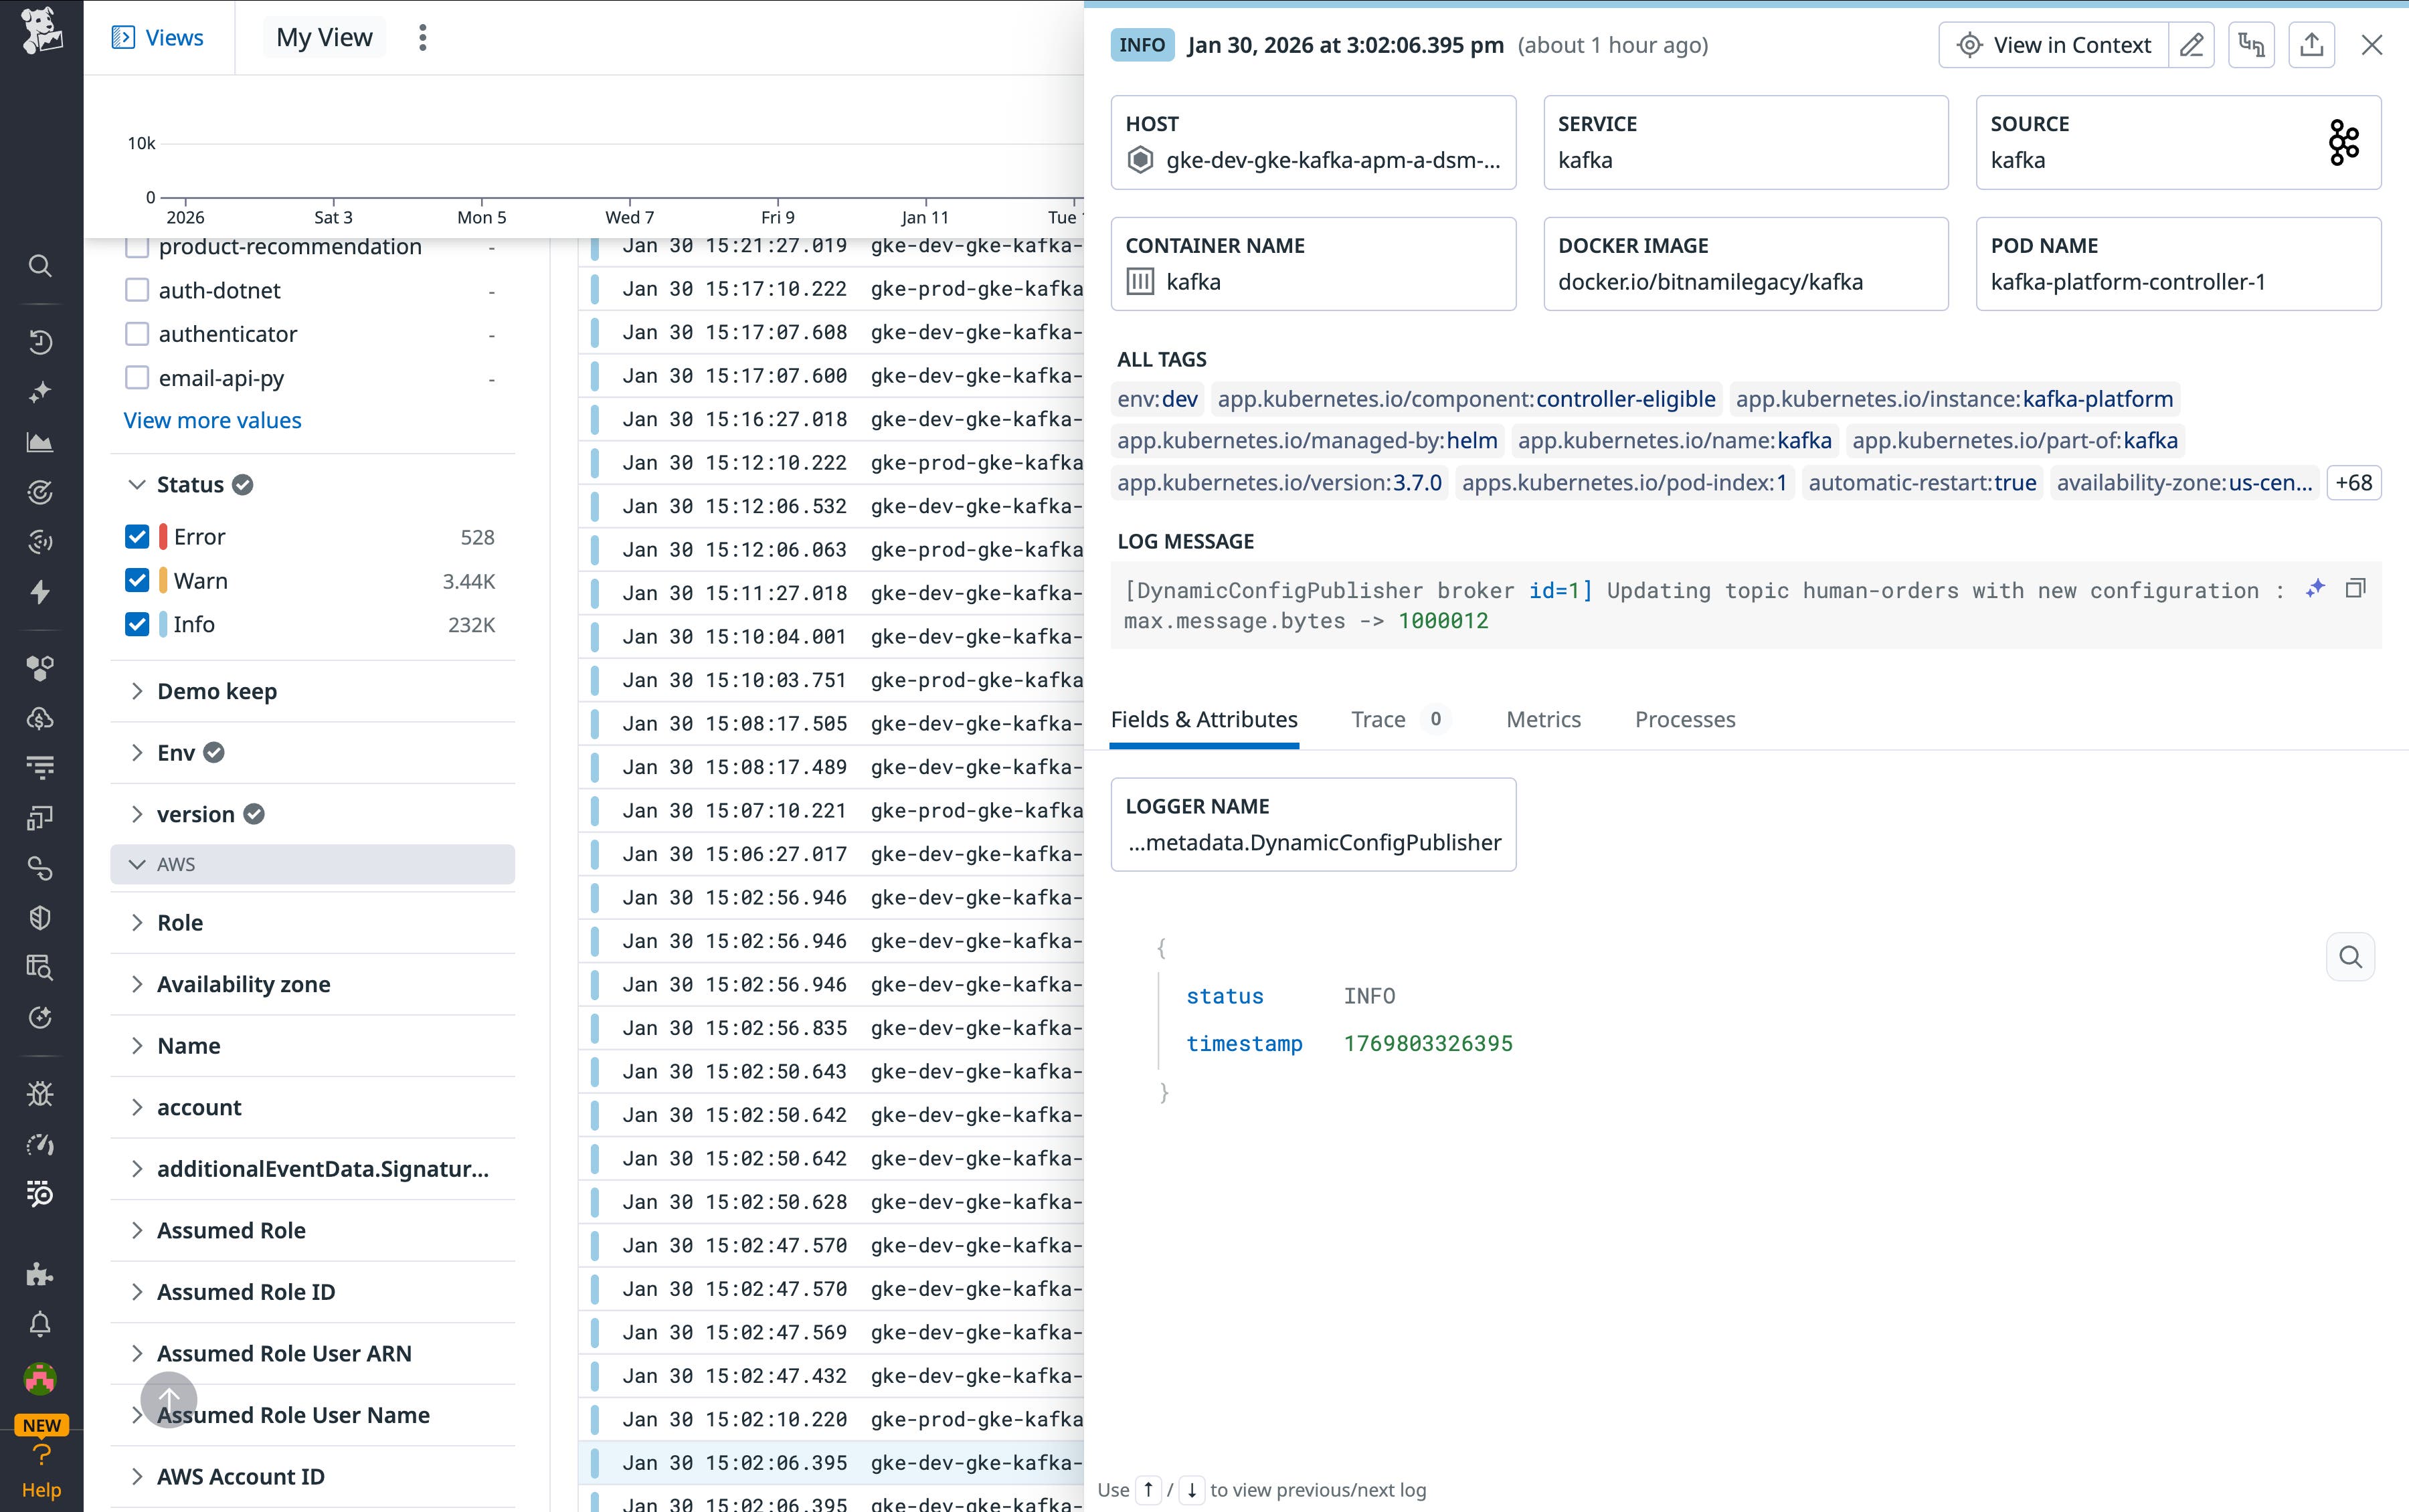
You can click on a graph in the dashboard to quickly view related logs or traces. Or you can navigate to the Log Explorer to search and filter your Kafka (and ZooKeeper) logs—along with logs from any other technologies you’re monitoring with Datadog. The screenshot below shows a stream of logs from a Kafka deployment and highlights a log that shows Kafka applying a dynamic topic configuration change propagated by the controller. You can use Datadog Log Analytics and create log-based metrics to gain insight into the performance of your entire stack.
You can also configure Observability Pipelines to read from Kafka topics and transform and route your Kafka-related logs, metrics, and traces within Datadog and to other destinations.
Once Datadog is capturing and visualizing your metrics, logs, and APM data, you will likely want to set up some alerts to be automatically notified of potential issues. With Watchdog-powered outlier and anomaly detection, you can proactively detect and investigate deviations from expected performance and ensure that you’re alerted on the things that matter. For example, you can set an alert to notify you if a particular producer is experiencing an increase in latency while the others are operating normally.
Get started monitoring Kafka with Datadog
In this post, we’ve guided you through integrating Kafka with Datadog using Data Streams Monitoring, as well as key metrics, logs, and traces from your environment. We also discussed using customizable dashboards to correlate your infrastructure health with pipeline performance and set up Watchdog-powered alerts to preempt anomalies. Overall, we’ve demonstrated how you can use Datadog to quickly gain end-to-end visibility into your data pipelines and proactively ensure the reliability of your Kafka-driven systems.
If you don’t yet have a Datadog account, you can sign up for a free trial and start monitoring Kafka right away.


