

Evan Mouzakitis

David M. Lentz

Aaron Kaplan
Technical Content Writer
Apache Kafka is a distributed event-streaming platform built for high-throughput, real-time data pipelines. It was developed at LinkedIn to provide “a unified platform for handling all the real-time data feeds a large company might have” and open sourced in 2011.
In the beginning, Kafka was essentially a massively scalable pub/sub message queue in the form of a distributed transaction log. From the start, its append-only architecture set it apart from more traditional message queuing systems like RabbitMQ, ActiveMQ, or Redis’s Pub/Sub: Kafka is built for extremely high throughput (it uses a custom binary TCP-based protocol) and scalability, as well as to provide strong ordering semantics and durability guarantees. Since 2011, Kafka has evolved into a unified event-streaming platform and become a pervasive part of modern systems and application infrastructure (including at Datadog).
In this post, we’ll provide an overview of Kafka’s architecture and the key metrics for effectively monitoring your cluster. In parts 2 and 3 of this guide, we’ll cover collecting Kafka metrics and show you how you can use Datadog for comprehensive, end-to-end monitoring of your entire Kafka stack and your broader streaming data pipelines.
Architecture overview
In order to effectively monitor Kafka, it is important to understand its basic architecture. As illustrated below, each Kafka deployment consists of a cluster of brokers that mediate between client applications (producers and consumers), along with a controller component that coordinates cluster operations and manages cluster metadata:
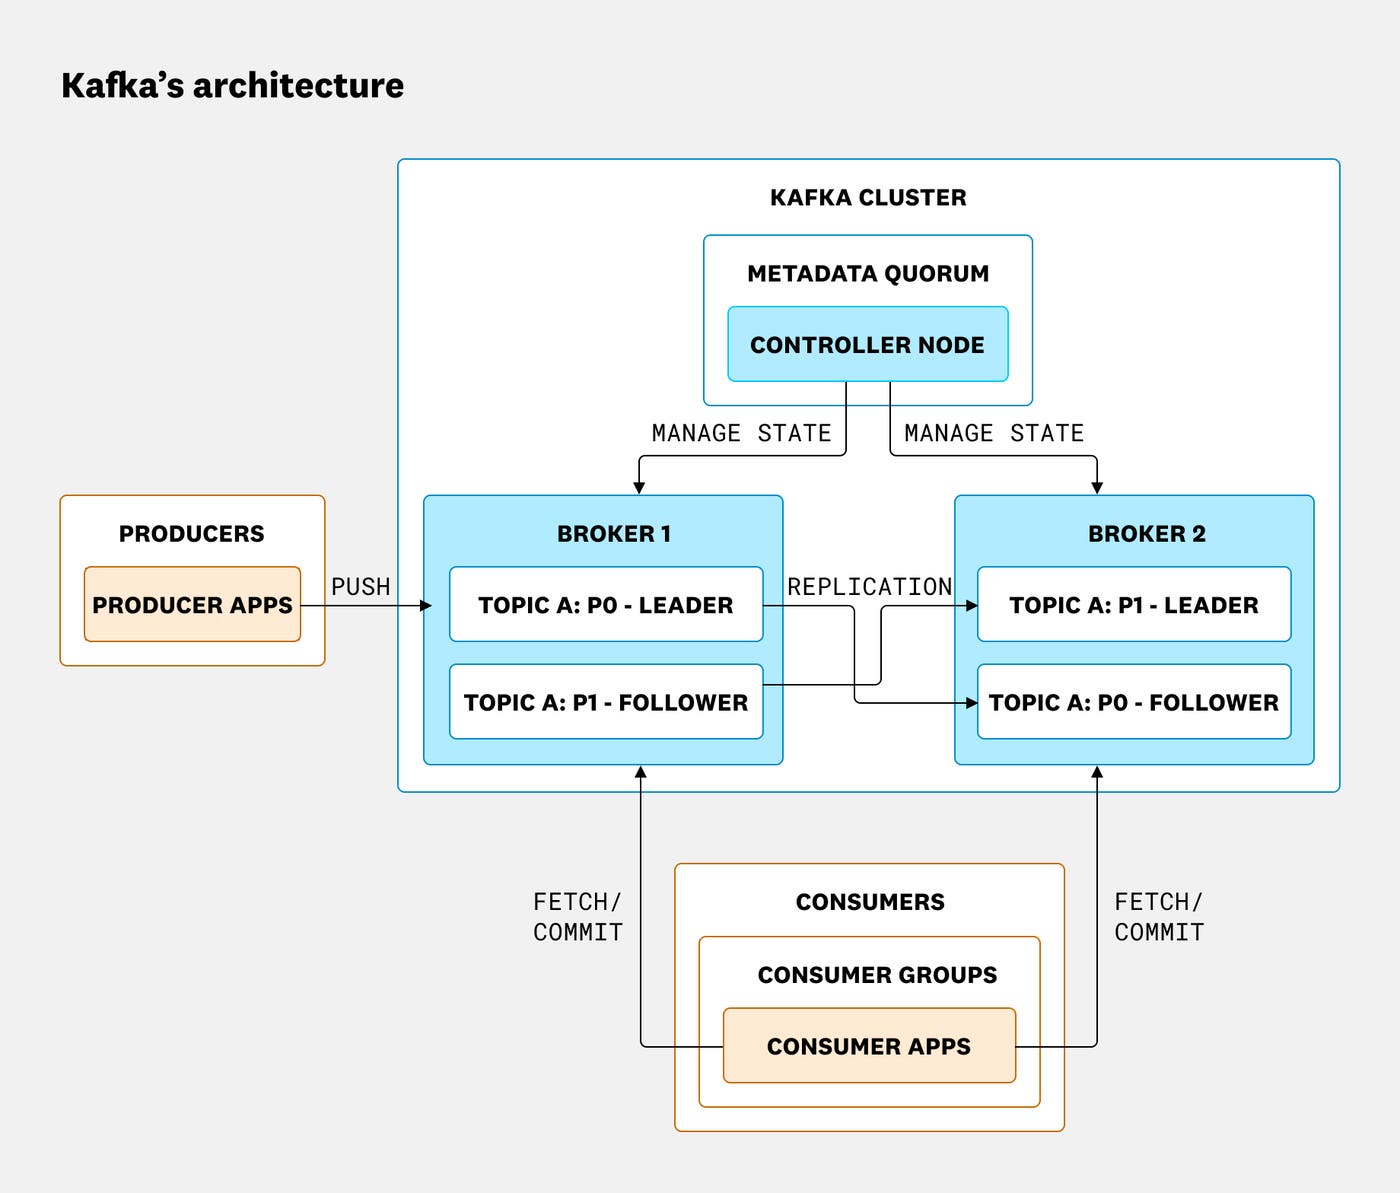
In Kafka, producers and consumers are client components that connect to the cluster, sending and retrieving data in the form of records (also known as messages), which are stored on brokers in topics. Via the Kafka client library, producers send records to Kafka brokers in batches to minimize network overhead. Brokers store those records on disk (subject to replication and retention settings) so that consumers can poll them at their own rate.
Each record consists of a payload of event data, descriptive metadata, and, optionally, arbitrary headers (as of version 0.11.0). Records in Kafka are written to the log in the order they are received by the broker and are immutable (read-only).
Topics are Kafka’s organizing structure for records. Each topic stores related records, establishing an individual stream of data to which consumers may subscribe as needed. Topics are themselves divided into partitions, and these partitions are assigned to brokers. Topics thus enforce a sharding of data on the broker level. The greater the number of partitions, the more concurrent consumers a topic can support within a consumer group, and the more brokers can handle write operations.
When setting up Kafka for the first time, you should take care to both allocate a sufficient number of partitions per topic and fairly distribute these partitions amongst your brokers. Doing so when deploying Kafka can minimize growing pains down the road. For more information on choosing an appropriate number of partitions, read this excellent article by Jun Rao of Confluent.
Kafka’s replication feature provides high availability by optionally persisting each partition on multiple brokers. In a replicated partition, Kafka will write records to only one replica: the partition leader. The other replicas are followers, which fetch copies of the records from the leader. Consumers may read from either the partition leader or from a follower as of Kafka 2.4. This architecture distributes the request load across the fleet of replicas.
Additionally, any follower is eligible to serve as the partition leader if the current leader goes offline, provided the follower is recognized as an in-sync replica (ISR). Kafka considers a follower to be in sync if it continues fetching from the leader and does not fall behind for longer than replica.lag.time.max.ms (30 seconds by default in Kafka 4.1). If the leader goes offline, Kafka elects a new leader from the set of ISRs. However, if the broker is configured to allow an unclean leader election (i.e., its unclean.leader.election.enable value is true), it may elect a leader that’s not up to date, posing the risk of data loss. In order to maintain high availability, a healthy Kafka cluster requires a minimum number of ISRs for failover.
The heart of the Kafka cluster’s control plane is the controller. The controller is responsible for coordinating cluster operations, including the management of partition leadership and metadata changes such as topic creation, partition assignments, and configuration updates. A healthy Kafka deployment has exactly one active controller at a time. In modern deployments running in KRaft mode (Kafka Raft Metadata), the controller is elected from the nodes in the cluster’s metadata quorum. In legacy deployments using ZooKeeper, one broker is elected as the controller on cluster startup, and ZooKeeper coordinates re-elections in the event that that controller fails, ensuring that only one broker holds this role at any given time.
In older deployments of Kafka, ZooKeeper was also responsible for recording cluster membership, maintaining topic configurations, and applying quotas to limit producer and consumer throughput. As of Kafka 3.5, KRaft mode, which uses an internal metadata quorum instead of ZooKeeper, became the default setting, and as of Kafka 4.0, ZooKeeper is no longer supported. For those with Kafka deployments that still rely on ZooKeeper, this guide still covers the basics of its monitoring.
Key metrics for monitoring Kafka
It’s important to monitor the health of your Kafka deployment to maintain reliable performance from the applications that depend on it.
Kafka metrics can be broken down into three categories:
For deployments that use it, it’s also important to monitor ZooKeeper. To learn more about collecting Kafka and ZooKeeper metrics, take a look at Part 2 of this series. And to learn more about holistic monitoring of the broader data pipelines and application stacks in which Kafka tends to operate—let’s say you need to monitor end-to-end pipeline latency, for example—take a look at Part 3.
This article references metric terminology introduced in our Monitoring 101 series, which provides a framework for metric collection and alerting.
Broker metrics
Because all records must pass through a Kafka broker in order to be consumed, monitoring and alerting on issues as they emerge in your broker cluster is critical. Broker metrics can be broken down into three classes:
Kafka-emitted metrics
| Name | MBean name | Description | Metric type |
|---|---|---|---|
| UnderReplicatedPartitions | kafka.server:type=ReplicaManager,name=UnderReplicatedPartitions | Number of unreplicated partitions | Resource: Availability |
| IsrShrinksPerSec/IsrExpandsPerSec | kafka.server:type=ReplicaManager,name=IsrShrinksPerSec kafka.server:type=ReplicaManager,name=IsrExpandsPerSec | Rate at which the pool of in-sync replicas (ISRs) shrinks/expands | Resource: Availability |
| ActiveControllerCount | kafka.controller:type=KafkaController,name=ActiveControllerCount | Number of active controllers in cluster | Resource: Error |
| OfflinePartitionsCount | kafka.controller:type=KafkaController,name=OfflinePartitionsCount | Number of offline partitions | Resource: Availability |
| LeaderElectionRateAndTimeMs | kafka.controller:type=ControllerStats,name=LeaderElectionRateAndTimeMs | Leader election rate and latency | Other |
| UncleanLeaderElectionsPerSec | kafka.controller:type=ControllerStats,name=UncleanLeaderElectionsPerSec | Number of “unclean” elections per second | Resource: Error |
| TotalTimeMs | kafka.network:type=RequestMetrics,name=TotalTimeMs,request=\{Produce | FetchConsumer | FetchFollower\} |
| PurgatorySize | kafka.server:type=DelayedOperationPurgatory,name=PurgatorySize,delayedOperation=\{Produce | Fetch\} | Number of requests waiting in producer purgatory/Number of requests waiting in fetch purgatory |
| BytesInPerSec/BytesOutPerSec | kafka.server:type=BrokerTopicMetrics,name=\{BytesInPerSec | BytesOutPerSec\} | Aggregate incoming/outgoing byte rate |
| RequestsPerSecond | kafka.network:type=RequestMetrics,name=RequestsPerSec,request=\{Produce | FetchConsumer | FetchFollower\},version=\{0 |
Metric to watch: UnderReplicatedPartitions
In a healthy cluster, the number of ISRs should be exactly equal to the total number of replicas. If partition replicas fall too far behind their leaders, the follower partition is removed from the ISR pool, and you should see a corresponding increase in IsrShrinksPerSec. If a broker becomes unavailable, the value of UnderReplicatedPartitions will increase sharply. Since Kafka’s high-availability guarantees cannot be met without replication, investigation is certainly warranted should this metric value exceed zero for extended time periods.
Metrics to watch: IsrShrinksPerSec and IsrExpandsPerSec
The number of ISRs for a partition should remain fairly static, except when you are expanding your broker cluster or removing partitions. You should investigate any flapping in the values of these metrics and any increase in IsrShrinksPerSec without a corresponding increase in IsrExpandsPerSec shortly thereafter.
Metric to alert on: ActiveControllerCount
Universally, the sum of ActiveControllerCount across all of your brokers should always equal one, and you should alert on any other value that lasts for longer than one second.
Metric to alert on: OfflinePartitionsCount (controller only)
This metric reports the number of partitions without an active leader. Because all read and write operations are only performed on partition leaders, you should alert on a non-zero value for this metric to prevent service interruptions. Any partition without an active leader will be completely inaccessible, and both consumers and producers of that partition will be blocked until a leader becomes available.
Metric to watch: LeaderElectionRateAndTimeMs
When a partition leader dies, an election for a new leader is triggered. In modern KRaft-based clusters, a partition leader is considered “dead” when the controller and metadata quorum can no longer reach it. In legacy ZooKeeper-based clusters, this typically corresponds to the broker losing its ZooKeeper session.
LeaderElectionRateAndTimeMs reports the rate of leader elections (per second) and the total time the cluster went without a leader (in milliseconds). Although this metric is not as critical as UncleanLeaderElectionsPerSec, you will want to keep an eye on it. As mentioned above, a leader election is triggered when contact with the current leader is lost, which could translate to an offline broker.
Metric to alert on: UncleanLeaderElectionsPerSec
Unclean leader elections occur when there is no qualified partition leader among Kafka brokers. Normally, when a broker that is the leader for a partition goes offline, a new leader is elected from the set of ISRs for the partition. Unclean leader election is disabled by default, meaning that a partition is taken offline if it does not have any ISRs to elect as the new leader. If Kafka is configured to allow an unclean leader election, a leader is chosen from the out-of-sync replicas, and any records that were not synced prior to the loss of the former leader are lost forever. Essentially, unclean leader elections sacrifice consistency for availability. You should alert on this metric, as it signals data loss.
Metric to watch: TotalTimeMs
The TotalTimeMs metric family measures the total time taken to service a request (be it a produce, fetch-consumer, or fetch-follower request):
produce: requests from producers to send data
fetch-consumer: requests from consumers to get new data
fetch-follower: requests from brokers that are the followers of a partition to get new data
The TotalTimeMs measurement itself is the sum of four metrics:
queue: time spent waiting in the request queue
local: time spent being processed by leader
remote: time spent waiting for follower response (only when
acks=all)response: time to send the response
Under normal conditions, this value should be fairly static, with minimal fluctuations. If you are seeing anomalous behavior, you may want to check the individual queue, local, remote and response values to pinpoint the exact request segment that is causing the slowdown. (We page on this metric internally at Datadog.)
Metric to watch: PurgatorySize
The request purgatory serves as a temporary holding pen for produce and fetch requests waiting to be satisfied. Each type of request has its own parameters to determine if it will be added to purgatory:
fetch: Fetch requests are added to purgatory if there is not enough data to fulfill the request (
fetch.min.byteson consumers) until the time specified byfetch.wait.max.msis reached or enough data becomes available.produce: If
acks=all, all produce requests will end up in purgatory until the partition leader receives an acknowledgment from all followers.
Keeping an eye on the size of purgatory is useful to determine the underlying causes of latency. Increases in consumer fetch times, for example, can be easily explained if there is a corresponding increase in the number of fetch requests in purgatory.
Metric to watch: BytesInPerSec/BytesOutPerSec
Generally, disk throughput tends to be the main bottleneck in Kafka performance. However, that’s not to say that the network is never a bottleneck. Network throughput can affect Kafka’s performance if you are sending records across data centers, if your topics have a large number of consumers, or if your replicas are catching up to their leaders. Tracking network throughput on your brokers gives you more information as to where potential bottlenecks may lie and can inform decisions like whether or not you should enable end-to-end compression of your records.
Metric to watch: RequestsPerSec
You should monitor the rate of requests from your producers, consumers, and followers to ensure your Kafka deployment is communicating efficiently. You can expect Kafka’s request rate to rise as producers send more traffic or as your deployment scales out, adding consumers or followers that need to fetch records. But if RequestsPerSec remains high, you should consider increasing the batch size on your producers, consumers, and/or brokers. This can improve the throughput of your Kafka deployment by reducing the number of requests, thereby decreasing unnecessary network overhead.
Host-level broker metrics
| Name | Description | Metric type |
|---|---|---|
| Page cache reads ratio | Ratio of reads from page cache versus reads from disk | Resource: Saturation |
| Disk usage | Disk space currently consumed versus available | Resource: Utilization |
| CPU usage | CPU use | Resource: Utilization |
| Network bytes sent/received | Network traffic in/out | Resource: Utilization |
Metric to watch: Page cache reads ratio
Kafka was designed from the beginning to leverage the kernel’s page cache in order to provide a reliable (disk-backed) and performant (in-memory) message pipeline. The page cache read ratio is similar to cache-hit ratio in databases: A higher value equates to faster reads and thus better performance. This metric will drop briefly if a replica is catching up to a leader (as when a new broker is spawned), but if your page cache read ratio remains below 80%, you may benefit from provisioning additional brokers.
Metric to alert on: Disk usage
Because Kafka persists all data to disk, it is necessary to monitor the amount of free disk space available to Kafka. Kafka will fail if its disk becomes full, so it’s very important that you keep track of disk growth over time and set alerts to inform administrators at an appropriate amount of time before disk space is used up.
Metric to watch: CPU usage
Although Kafka’s primary bottleneck is usually memory, it doesn’t hurt to keep an eye on its CPU usage. Even in use cases where GZIP compression is enabled, the CPU is rarely the source of a performance problem. Therefore, if you do see spikes in CPU utilization, it is worth investigating.
Network bytes sent/received
If you are monitoring Kafka’s bytes in/out metric, you are getting Kafka’s side of the story. To get a full picture of network usage on your host, you need to monitor host-level network throughput, especially if your Kafka brokers are hosting other network services. High network usage could be a symptom of degraded performance, so if you are seeing high network use, correlating with TCP retransmissions and dropped packet errors could help in determining if the performance issue is network-related.
JVM garbage collection metrics
Because Kafka is written in Scala and runs in the Java Virtual Machine (JVM), it relies on Java garbage collection processes to free up memory. The more activity in your Kafka cluster, the more often the garbage collection will run.
Anyone familiar with Java applications knows that garbage collection can come with a high performance cost. In modern Kafka deployments running in KRaft mode, long pauses due to garbage collection generally surface through broker or controller disconnects, request timeouts, or increased latency in the metadata quorum. In legacy deployments, these pauses may trigger an increase in abandoned ZooKeeper sessions, due to sessions timing out.
The type of garbage collection depends on whether the young generation (new objects) or the old generation (long-surviving objects) is being collected. See this page for a good primer on Java garbage collection.
If you are seeing excessive pauses during garbage collection, you can consider upgrading your JDK version or garbage collector (or extend your timeout value for zookeeper.session.timeout.ms). Additionally, you can tune your Java runtime to minimize garbage collection. The engineers at LinkedIn have written about optimizing JVM garbage collection in depth. Of course, you can also check the Kafka documentation for some recommendations.
| JMX attribute | MBean name | Description | Type |
|---|---|---|---|
| CollectionCount | java.lang:type=GarbageCollector,name=G1 (Young\ | Old) Generation | The total count of young or old garbage collection processes executed by the JVM |
| CollectionTime | java.lang:type=GarbageCollector,name=G1 (Young\ | Old) Generation | The total amount of time (in milliseconds) the JVM has spent executing young or old garbage collection processes |
Metric to watch: Young-generation garbage collection time
Young-generation garbage collection occurs relatively often. This is stop-the-world garbage collection, meaning that all application threads pause while it’s carried out. Any significant increase in the value of this metric will dramatically impact Kafka’s performance.
Metric to watch: Old-generation garbage collection count/time
Old-generation garbage collection frees up unused memory in the old generation of the heap. This is low-pause garbage collection, meaning that although it does temporarily stop application threads, it does so only intermittently. If this process is taking a few seconds to complete or is occurring with increased frequency, your cluster may not have enough memory to function efficiently.
Kafka producer metrics
Kafka producers are independent processes that push records to broker topics for consumption. If producers fail, consumers will be left without new records. Below are some of the most useful producer metrics to monitor to ensure a steady stream of incoming data.
| JMX attribute | MBean name | Description | Metric type |
|---|---|---|---|
| compression-rate-avg | kafka.producer:type=producer-metrics,client-id=(\[-.w\]+) | Average compression rate of batches sent | Work: Other |
| response-rate | kafka.producer:type=producer-metrics,client-id=(\[-.w\]+) | Average number of responses received per second | Work: Throughput |
| request-rate | kafka.producer:type=producer-metrics,client-id=(\[-.w\]+) | Average number of requests sent per second | Work: Throughput |
| request-latency-avg | kafka.producer:type=producer-metrics,client-id=(\[-.w\]+) | Average request latency (in ms) | Work: Throughput |
| outgoing-byte-rate | kafka.producer:type=producer-metrics,client-id=(\[-.w\]+) | Average number of outgoing/incoming bytes per second | Work: Throughput |
| io-wait-time-ns-avg | kafka.producer:type=producer-metrics,client-id=(\[-.w\]+) | Average length of time the I/O thread spent waiting for a socket (in ns) | Work: Throughput |
| batch-size-avg | kafka.producer:type=producer-metrics,client-id=(\[-.w\]+) | The average number of bytes sent per partition per request | Work: Throughput |
Metric to watch: Compression rate
This metric reflects the amount of data compression in the batches of data the producer sends to the broker. The compression rate is the average ratio of the batches’ compressed size compared to their uncompressed size. A smaller compression rate indicates greater efficiency. If this metric rises, it could indicate that there’s a problem with the shape of data or that a rogue producer is sending uncompressed data.
Metric to watch: Response rate
For producers, the response rate represents the rate of responses received from brokers. Brokers respond to producers when the data has been received. Depending on your configuration, “received” could have one of three meanings:
The message was received but not committed (
acks == 0in KRaft mode, orrequest.required.acks == 0in legacy deployments)The leader has written the message to disk (
acksorrequest.required.acks == 1)The leader has received confirmation from all replicas that the data has been written to disk (
acksorrequest.required.acks == all)
Producer data is not available for consumption until the required number of acknowledgments have been received.
If you are seeing low response rates, a number of factors could be at play. A good place to start is to check the acks (or legacy request.required.acks) configuration of the producers in your client applications. Choosing the right value for acks is entirely use case–dependent; the trade-off between availability and consistency is up to you.
Metric to watch: Request rate
The request rate is the rate at which producers send data to brokers. Of course, what constitutes a healthy request rate will vary drastically depending on the use case. Keeping an eye on peaks and drops is essential to ensure continuous service availability. If rate limiting is not enabled, in the event of a traffic spike, brokers could slow to a crawl as they struggle to process a rapid influx of data.
Metric to watch: Request latency average
The average request latency is a measure of the amount of time between when KafkaProducer.send() was called until the producer receives a response from the broker. “Received” in this context can mean a number of things, as explained in the paragraph on response rate.
A producer doesn’t necessarily send each message as soon as it’s created. The producer’s linger.ms value determines the maximum amount of time it will wait before sending a message batch, potentially allowing it to accumulate a larger batch of records before sending them in a single request. The default value of linger.ms is 0 ms; setting this to a higher value can increase latency but can also help improve throughput, since the producer will be able to send multiple records without incurring network overhead for each one. If you increase linger.ms to improve your Kafka deployment’s throughput, you should monitor request latency to ensure it doesn’t rise beyond an acceptable limit.
Since latency has a strong correlation with throughput, it is worth mentioning that modifying batch.size in your producer configuration can lead to significant gains in throughput. Determining an optimal batch size is largely use case–dependent, but a general rule of thumb is that if you have available memory, you should increase batch size. Keep in mind that the batch size you configure is an upper limit. Note that small batches involve more network round trips, which can reduce throughput.
Metric to watch: Outgoing byte rate
As with Kafka brokers, you will want to monitor your producer network throughput. Observing traffic volume over time is essential for determining whether you need to make changes to your network infrastructure. Monitoring producer network traffic will help to inform decisions on infrastructure changes, as well as to provide a window into the production rate of producers and identify sources of excessive traffic.
Metric to watch: I/O wait time
Producers generally do one of two things: wait for data, and send data. If producers are producing more data than they can send, they end up waiting for network resources. But if producers aren’t being rate-limited or maxing out their bandwidth, the bottleneck becomes harder to identify. Because disk access tends to be the slowest segment of any processing task, checking I/O wait times on your producers is a good place to start. Remember, I/O wait represents the percent of time spent performing I/O while the CPU was idle. If you are seeing excessive wait times, it means your producers can’t get the data they need fast enough. If you are using traditional hard drives for your storage backend, you may want to consider SSDs.
Metric to watch: Batch size
To use network resources more efficiently, Kafka producers attempt to group records into batches before sending them. The producer will wait to accumulate an amount of data defined by batch.size) (16 KB by default), but it won’t wait any longer than the value of linger.ms (which defaults to 0 milliseconds). If the size of batches sent by a producer is consistently lower than the configured batch.size, any time your producer spends lingering is wasted waiting for additional data that never arrives. Consider reducing your linger.ms setting if the value of your batch size is lower than your configured batch.size.
Kafka consumer metrics
| JMX attribute | MBean name | Description | Metric type |
|---|---|---|---|
| records-lag | kafka.consumer:type=consumer-fetch-manager-metrics,client-id=(\[-.w\]+),topic=(\[-.w\]+),partition=(\[-.w\]+) | Number of records consumer is behind producer on this partition | Work: Performance |
| records-lag-max | kafka.consumer:type=consumer-fetch-manager-metrics,client-id=(\[-.w\]+),topic=(\[-.w\]+),partition=(\[-.w\]+) kafka.consumer:type=consumer-fetch-manager-metrics,client-id=(\[-.w\]+) | Maximum number of records consumer is behind producer, either for a specific partition or across all partitions on this client | Work: Performance |
| bytes-consumed-rate | kafka.consumer:type=consumer-fetch-manager-metrics,client-id=(\[-.w\]+),topic=(\[-.w\]+) kafka.consumer:type=consumer-fetch-manager-metrics,client-id=(\[-.w\]+) | Average number of bytes consumed per second for a specific topic or across all topics | Work: Throughput |
| records-consumed-rate | kafka.consumer:type=consumer-fetch-manager-metrics,client-id=(\[-.w\]+),topic=(\[-.w\]+) kafka.consumer:type=consumer-fetch-manager-metrics,client-id=(\[-.w\]+) | Average number of records consumed per second for a specific topic or across all topics | Work: Throughput |
| fetch-rate | kafka.consumer:type=consumer-fetch-manager-metrics,client\_id=(\[-.w\]+) | Number of fetch requests per second from the consumer | Work: Throughput |
Metrics to watch: Records lag/Records lag max
Records lag is the calculated difference between a consumer’s current log offset and a producer’s current log offset. Records lag max is the maximum observed value of records lag. The significance of these metrics’ values depends completely upon what your consumers are doing. If you have consumers that back up old records to long-term storage, you would expect records lag to be significant. However, if your consumers are processing real-time data, consistently high lag values could be a sign of overloaded consumers, in which case both provisioning more consumers and splitting topics across more partitions could help increase throughput and reduce lag.
Metric to watch: Bytes consumed rate
As with producers and brokers, you will want to monitor your consumer network throughput. For example, a sudden drop in the rate of records consumed (records-consumed-rate) could indicate a failing consumer, but if its network throughput (bytes-consumed-rate) remains constant, it’s still healthy, just consuming fewer, larger-sized records. Observing traffic volume over time, in the context of other metrics, is important for diagnosing anomalous network usage.
Metric to watch: Records consumed rate
Each Kafka message is a single data record. The rate of records consumed per second may not strongly correlate with the rate of bytes consumed because records can be of variable size. Depending on your producers and workload, in typical deployments you should expect this number to remain fairly constant. By monitoring this metric over time, you can discover trends in your data consumption and create a baseline against which you can alert.
Metric to watch: Fetch rate
The fetch rate of a consumer can be a good indicator of overall consumer health. A minimum fetch rate approaching a value of zero could potentially signal an issue on the consumer. In a healthy consumer, the minimum fetch rate will usually be non-zero, so if you see this value dropping, it could be a sign of consumer failure.
ZooKeeper metrics
Those with legacy Kafka deployments that still use ZooKeeper for metadata management should keep track of a few core metrics:
| Name | Description | Metric type |
|---|---|---|
| outstanding\_requests | Number of client requests queued on a ZooKeeper node | Resource: Saturation |
| avg\_latency | Average time (in ms) it takes ZooKeeper to respond to a client request | Work: Throughput |
| num\alive\connections | Number of clients connected to a ZooKeeper node | Resource: Availability |
| followers | Number of active followers in a ZooKeeper ensemble, as reported by the leader | Resource: Availability |
| pending\_syncs | Number of pending sync operations from followers | Other |
| open\file\descriptor\_count | Number of file descriptors in use | Resource: Utilization |
Metric to watch: Outstanding requests
Clients can end up submitting requests faster than ZooKeeper can process them. If you have a large number of clients, it’s almost a given that this will happen occasionally. To prevent using up all available memory due to queued requests, ZooKeeper will throttle clients if it reaches its queue limit, which is defined in ZooKeeper’s zookeeper.globalOutstandingLimit setting (and which defaults to 1,000). If a request waits for a while to be serviced, you will see a correlation in the reported average latency. Tracking both outstanding requests and latency can give you a clearer picture of the causes behind degraded performance.
Metric to watch: Average latency
The average request latency is the average time it takes (in milliseconds) for ZooKeeper to respond to a request. ZooKeeper will not respond to a request until it has written the transaction to its transaction log. If the performance of your ZooKeeper ensemble degrades, you can correlate average latency with outstanding requests and pending syncs (covered in more detail below) to gain insight into what’s causing the slowdown.
Metric to watch: Number of alive connections
ZooKeeper reports the number of clients connected to it via the num_alive_connections metric. This represents all connections, including connections to non-ZooKeeper nodes. In most environments, this metric should remain fairly static, since the number of consumers, producers, brokers, and ZooKeeper nodes should remain relatively stable. You should be aware of unanticipated drops in this value; since legacy Kafka deployments use ZooKeeper to coordinate work, a loss of connection to ZooKeeper could have a number of different effects, depending on the disconnected client.
Metric to watch: Followers (leader only)
The number of followers should equal the total size of your ZooKeeper ensemble minus one. (The leader is not included in the follower count.) You should alert on any changes to this value, since the size of your ensemble should only change due to user intervention (e.g., an administrator decommissioned or commissioned a node).
Metric to alert on: Pending syncs (leader only)
The transaction log is the most performance-critical part of ZooKeeper. ZooKeeper must sync transactions to disk before returning a response, thus a large number of pending syncs will result in increased latency. Performance will undoubtedly suffer after an extended period of outstanding syncs, as ZooKeeper cannot service requests until the sync has been performed. You should consider alerting on a pending_syncs value greater than 10.
Metric to watch: Open file descriptor count
ZooKeeper maintains state on the filesystem, with each znode corresponding to a subdirectory on disk. Linux has a limited number of file descriptors available. This is configurable, so you should compare this metric to your system’s configured limit, and increase the limit as needed.
ZooKeeper system metrics
Besides metrics emitted by ZooKeeper itself, it is also worth monitoring a few host-level ZooKeeper metrics.
| Name | Description | Metric type |
|---|---|---|
| Bytes sent/received | Number of bytes sent/received by ZooKeeper hosts | Resource: Utilization |
| Usable memory | Amount of unused memory available to ZooKeeper | Resource: Utilization |
| Swap usage | Amount of swap space used by ZooKeeper | Resource: Saturation |
| Disk latency | Time delay between request for data and return of data from disk | Resource: Saturation |
Metric to watch: Bytes sent/received
In large-scale deployments with many consumers and partitions, ZooKeeper could become a bottleneck, as it records and communicates the changing state of the cluster. Tracking the number of bytes sent and received over time can help diagnose performance issues. If traffic in your ZooKeeper ensemble is rising, you should provision more nodes to accommodate the higher volume.
Metric to watch: Usable memory
ZooKeeper should reside entirely in RAM and will suffer considerably if it must page to disk. Therefore, keeping track of the amount of usable memory is necessary to ensure ZooKeeper performs optimally. Remember, because ZooKeeper is used to store state, a degradation in ZooKeeper performance will be felt across your cluster. The machines provisioned as ZooKeeper nodes should have an ample memory buffer to handle surges in load.
Metric to alert on: Swap usage
If ZooKeeper runs out of memory, it has to swap, which will cause it to slow down. You should alert on any swap usage so you can provision more memory.
Metric to watch: Disk latency
Although ZooKeeper should reside in RAM, it still makes use of the filesystem for both periodically snapshotting its current state and for maintaining logs of all transactions. Given that ZooKeeper must write a transaction to non-volatile storage before an update takes place, this makes disk access a potential bottleneck. Spikes in disk latency will cause a degradation of service for all hosts that communicate with ZooKeeper, so besides equipping your ensemble with SSDs, you should definitely keep an eye on disk latency.
Monitor your Kafka deployment
In this post, we’ve explored many of the key metrics you should monitor to keep tabs on the health and performance of your Kafka cluster.
Kafka never runs in a vacuum. Coming up in this series, we’ll show you how to use Datadog, including Data Streams Monitoring, to get full visibility into the health of your Kafka clusters and pipelines—tracking latency and lag, spotting bottlenecks, quickly identifying dependencies, and pivoting to the relevant traces, metrics, and logs.
Read on for a comprehensive guide to collecting all of the metrics described in this article, as well as any other metric exposed by Kafka.
Acknowledgments
Thanks to Gwen Shapira and Dustin Cote at Confluent for generously sharing their Kafka expertise for this article.
