

Jordan Obey
Senior Technical Content Writer
Amazon Managed Streaming for Apache Kafka (MSK) is a fully managed service that allows developers to build highly available and scalable applications on Kafka. In addition to enabling developers to migrate their existing Kafka applications to AWS, Amazon MSK handles the provisioning and maintenance of Kafka and ZooKeeper nodes and automatically replicates data across multiple availability zones for high availability. Datadog’s new integration with Amazon MSK provides deep visibility into your managed Kafka streams so that you can monitor their health and performance in real time.
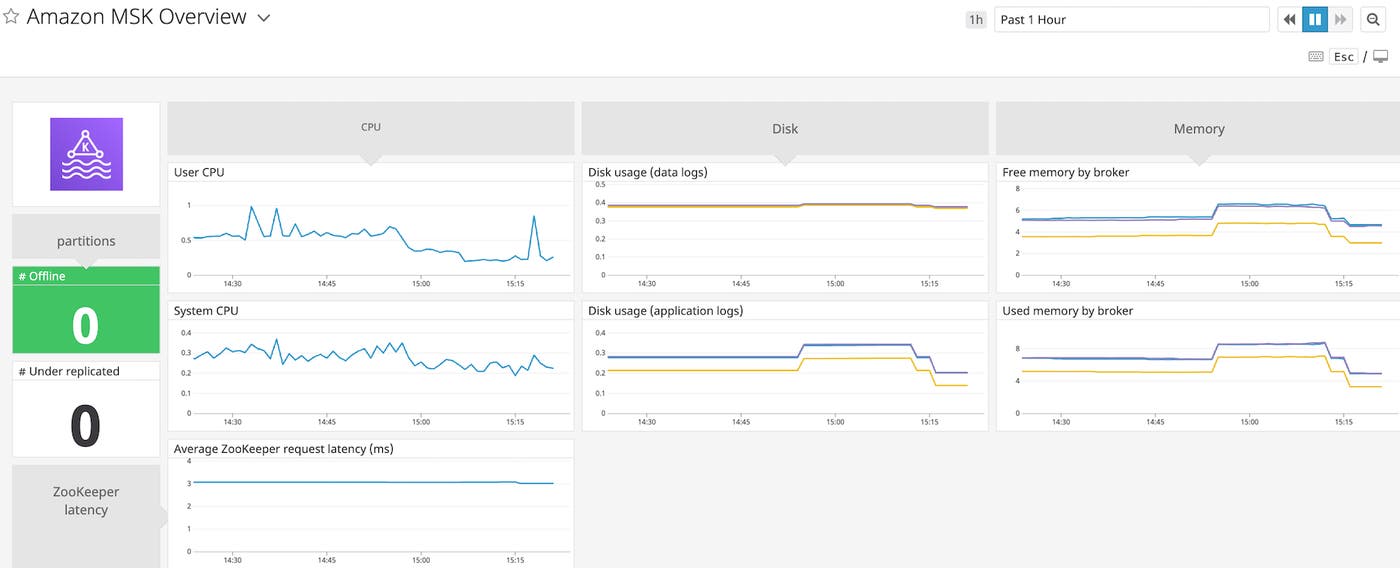
Once you’ve enabled the integration, Amazon MSK data will flow into an out-of-the-box dashboard providing you with an overview of key metrics like a count of offline partitions and the disk usage of your brokers.
Anticipate strains on disk usage
Kafka persists message data to disk. If a broker runs out of space to store messages, it will fail. To ensure the reliability of your MSK clusters, AWS recommends setting up an alert that will notify you when disk usage of data logs (aws.kafka.kafka_data_logs_disk_used) hits or surpasses 85 percent.
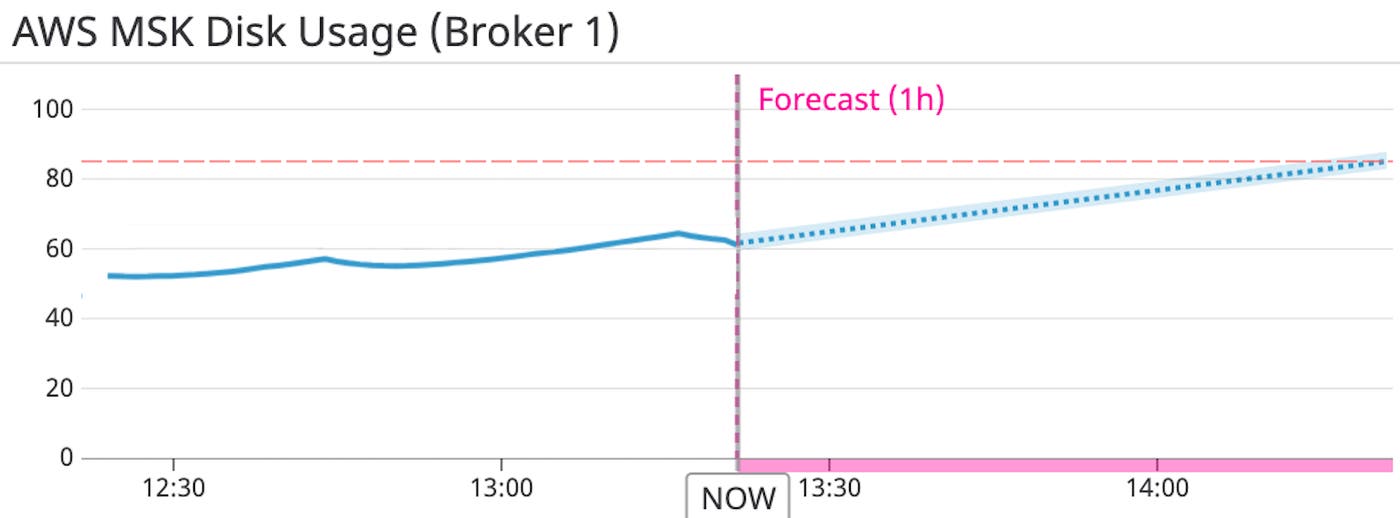
To stay ahead of the curve, you can also use machine learning–powered forecasts to predict when disk usage will exceed a threshold and alert you in advance. If an alert triggers, AWS suggests scaling up your broker storage, deleting any unused topics, and/or adjusting the message retention period or log size.
Know if a partition goes offline
For high availability, Kafka stores data across multiple brokers as partitions. Each Kafka broker typically serves as the leader for some partitions of data and the follower for others. If a broker fails unexpectedly, any partitions that it is the leader for will go offline. While a partition is offline, it cannot perform any read or write operations. A healthy cluster will not have any offline partitions.
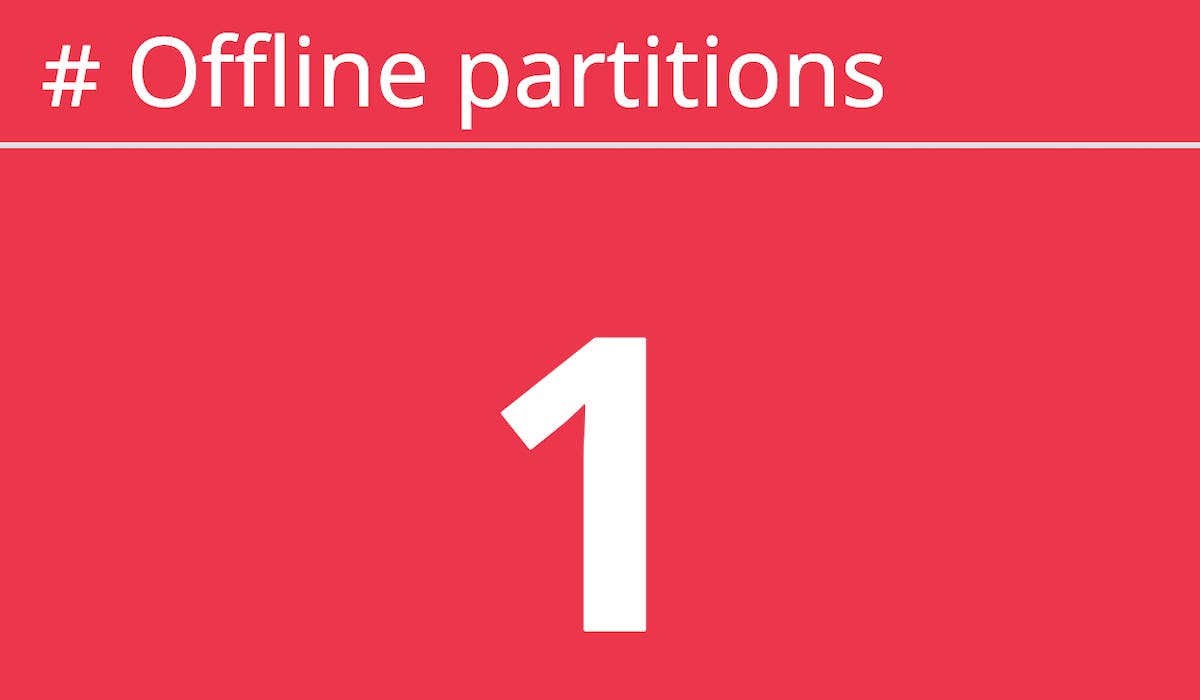
To see at a glance whether your offline partition count is greater than 0, you can track the aws.kafka.offline_partitions_count metric in a query value widget. You can use conditional formatting to change the widget background or text colors based on the latest value of the metric. For example, as shown in the screenshot below, if any partitions go offline, the background of the query value widget will turn red. You can also set up an alert to notify you when a partition goes offline so that you can respond quickly to issues as they arise.
Monitor Amazon MSK alongside ZooKeeper
Amazon MSK also manages ZooKeeper, a distributed service used for orchestrating Kafka. Kafka relies on ZooKeeper for leader and controller election, maintaining access control lists, and topic configuration. Monitoring ZooKeeper alongside Amazon MSK will provide a comprehensive view of your managed cluster.
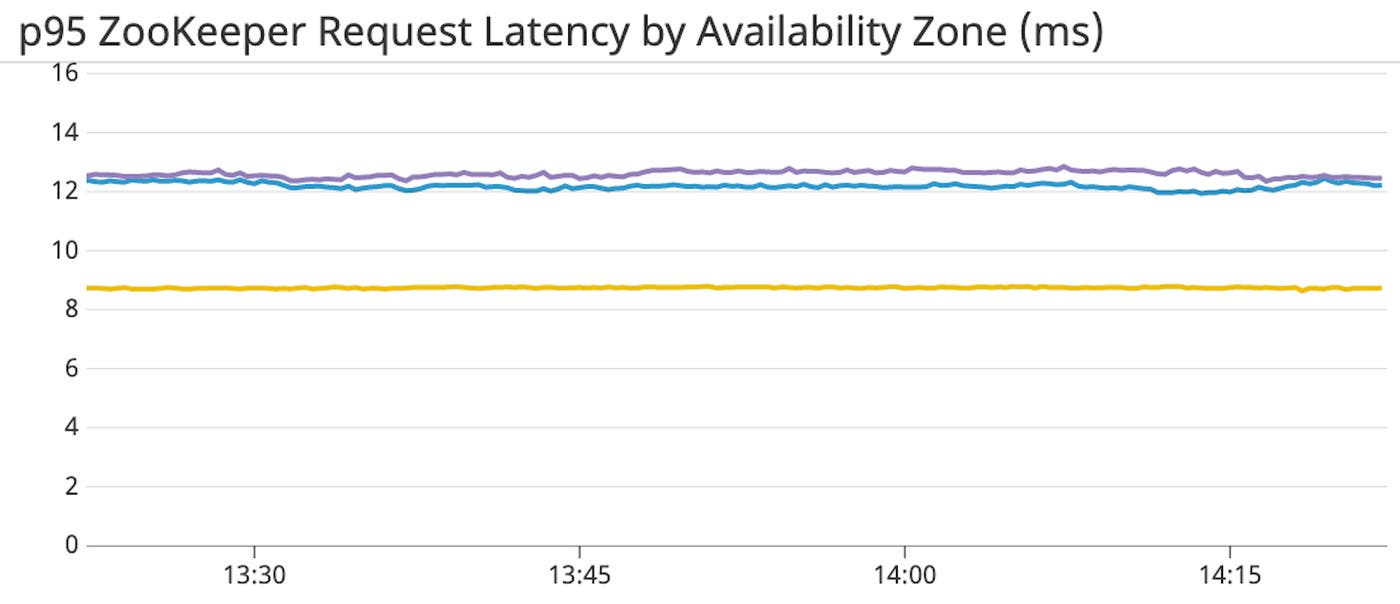
Our Amazon MSK integration surfaces ZooKeeper request latency metrics—including the 50th, 75th, and 95th percentile values—to track ZooKeeper’s performance. This metric measures how long it takes for ZooKeeper to respond to client requests. Any sudden and unexpected spikes may indicate or lead to timeout errors and degraded Kafka performance. If you encounter poor ZooKeeper performance, make sure you’ve checked for common misconfigurations such as incorrect Java maximum heap size or a misplaced transaction log.
Monitoring managed streams and beyond
If you rely on Amazon MSK to manage Kafka, our new integration will help you track hundreds of health and performance metrics to ensure your clusters continue to stream without interruption. This integration unifies metrics from our Agent-based check running on your MSK nodes and our AWS crawler, which collects data from CloudWatch. You can also collect Amazon MSK logs to get more context around your metrics.
With Datadog, you can monitor Amazon MSK alongside more than 1,000+ popular technologies, including other Amazon services like AWS Lambda and Fargate.
If you have a Datadog account and would like to start monitoring Amazon MSK you can get started here. Otherwise, sign up today for a 14-day free trial.
