
Jimmy Caputo

David M. Lentz
Confluent Platform is an event streaming platform built on Apache Kafka. If you're using Kafka as a data pipeline between microservices, Confluent Platform makes it easy to copy data into and out of Kafka, validate the data, and replicate entire Kafka topics.
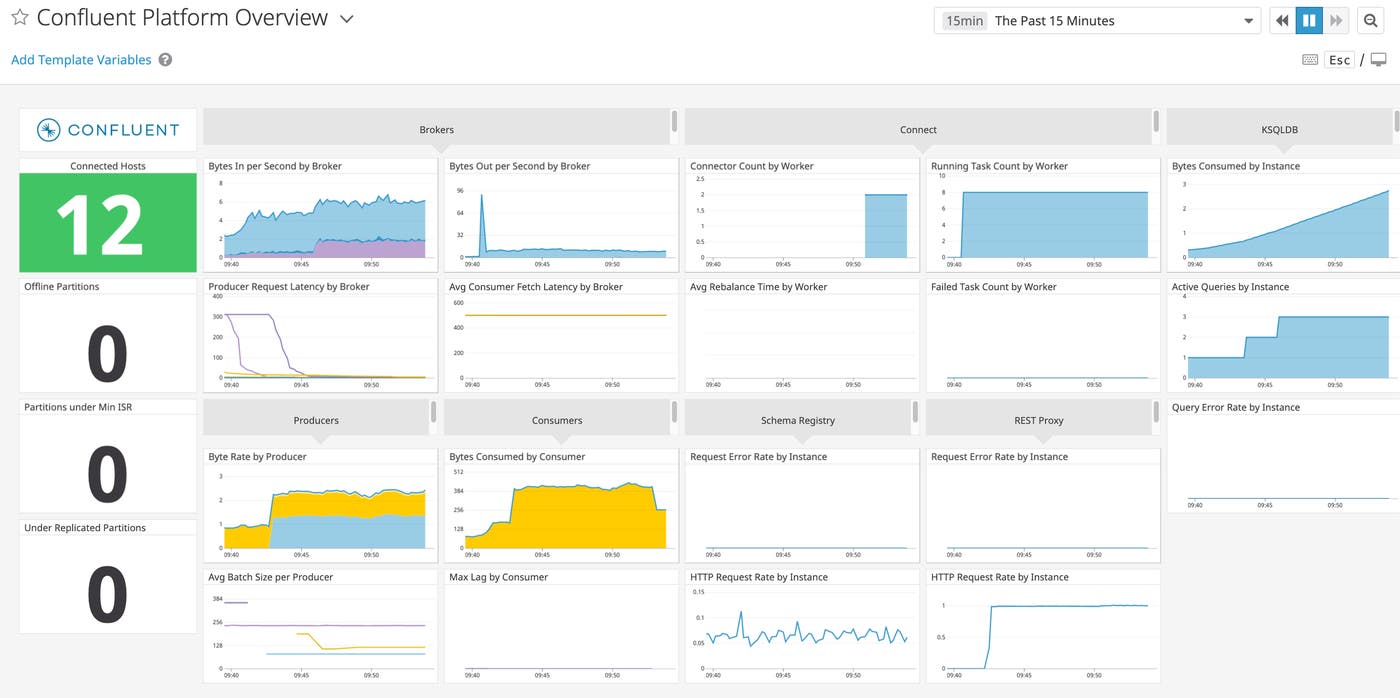
We've partnered with Confluent to create a new Confluent Platform integration. Monitoring Confluent Platform with Datadog can give you the data you need to quickly pinpoint and fix problems, and help you meet your SLOs for reading, writing, and replicating data. This new integration provides visibility into your Kafka brokers, producers, and consumers, as well as key components of the Confluent Platform: Kafka Connect, REST Proxy, Schema Registry, and ksqlDB. The pre-built dashboard shown above surfaces useful metrics to help you understand the health of your Confluent Platform environment. To get even richer context around your metrics, you can also configure Datadog to collect logs from any of the Confluent Platform components.
Monitor Kafka brokers, producers, and consumers
Monitoring the rate of data flowing through your brokers can help you understand the overall level of activity of your Kafka deployment. If you're troubleshooting a problem with your Kafka throughput, you can correlate your brokers' data rates with latency metrics from your producers and consumers to determine the source of the bottleneck. In the screenshot below—taken from Datadog's Confluent Platform dashboard—a broker's data rate declines while producers' request latency rises, possibly indicating network congestion between producers and brokers.
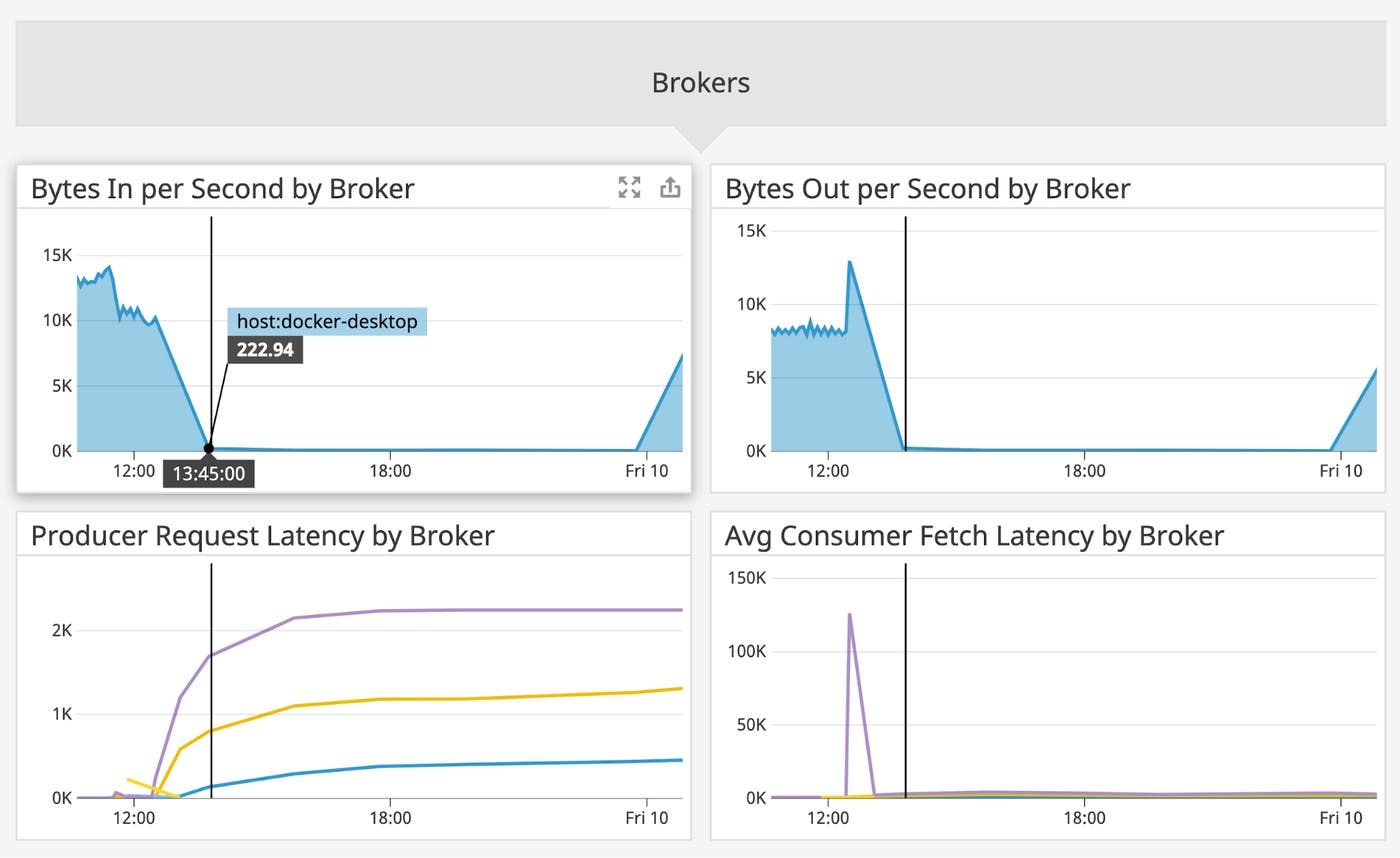
If your producers and consumers are written in Java, you'll see their metrics on the same dashboard, adding context to help you understand Confluent Platform's performance. For example, a change in a topic's throughput could be the result of a consumer group that's falling behind and needs to be scaled out.
Datadog automatically applies tags from your infrastructure and/or cloud provider, such as host and availability-zone. This makes it easy to distinguish the source of metrics and even to correlate application performance with resource metrics. For example, a consumer that shows an increase in latency at the same time that its host shows rising CPU usage may need to be moved to a larger host.
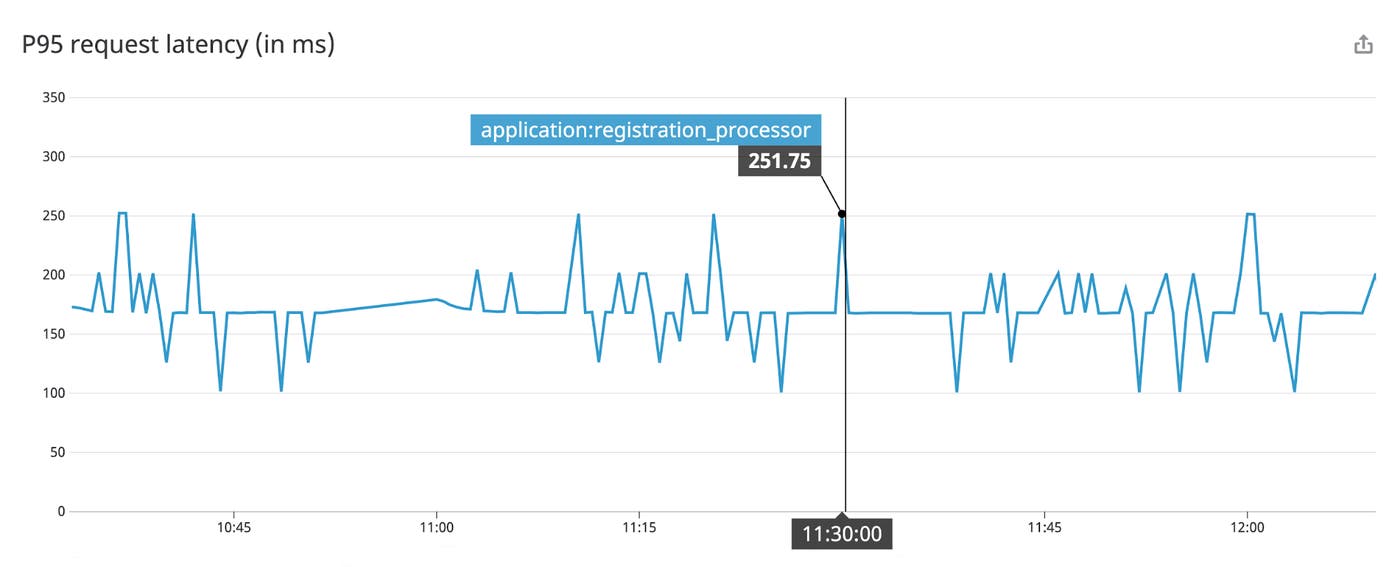
You can also add custom tags to represent any subset of your deployment. In the example below, we've used the custom tag application:registration_processor to graph p95 latency data from a subset of the consumers receiving data within a particular application.
Monitor connectors and workers
Kafka Connect allows you to bring data into Kafka from external sources (such as Amazon Kinesis or RabbitMQ) and copy data out to sinks—data storage targets (such as Elasticsearch or Amazon S3). You can build connectors using the Kafka Connect framework, or you can download connectors from the Confluent Hub.
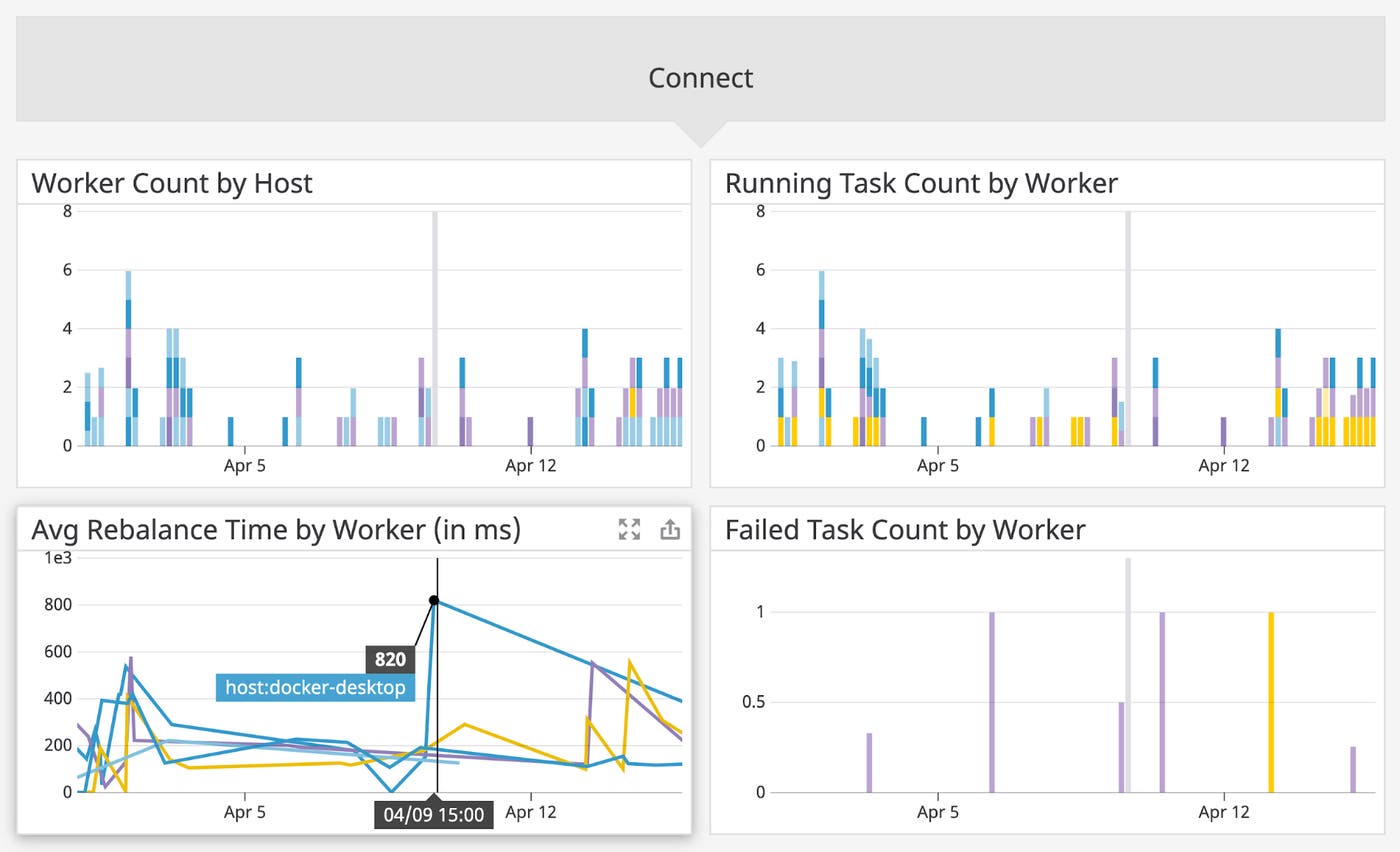
To ensure high availability, you can deploy a Kafka Connect cluster based on the worker model. This configures Kafka Connect to deploy multiple worker processes. Each worker runs one or more connectors and coordinates with other workers to dynamically distribute the workload. Connectors manage tasks, which copy the data. If the Kafka Connect cluster needs to scale out (e.g., to speed up the transfer of data as traffic grows) or if Kafka restarts failed workers, their connectors dynamically reassign tasks in a process called rebalancing. During this time, Kafka pauses at least some of the tasks running in the cluster, which can reduce your cluster's throughput. If your workers are spending increasing amounts of time rebalancing, it could be a sign of unreliable or undersized nodes in your cluster causing too many scaling events.
The screenshot below shows the number of Kafka Connect workers and tasks, the amount of time the workers spend rebalancing their tasks, and the count of failed tasks. The Confluent Platform dashboard brings this data into a single view so you can easily correlate trends in related metrics. For example, a rise in both failed task count and running task count might be related and could warrant scaling up to larger hosts.
If you're using Confluent's Replicator connector to copy topics from one Kafka cluster to another, Datadog can help you monitor key metrics like latency, throughput, and message lag—the number of messages that exist on the source topic but haven't yet been copied to the replicated topic. Datadog automatically tags Replicator metrics to show the task and partition they came from. This makes it easy to search and filter within the Confluent Platform dashboard to track the replication of a particular topic.
You can also create an alert to automatically notify your team if Replicator exhibits rising lag or degraded throughput before it threatens to disrupt the availability of your backup cluster.
See your REST proxy's activity and errors
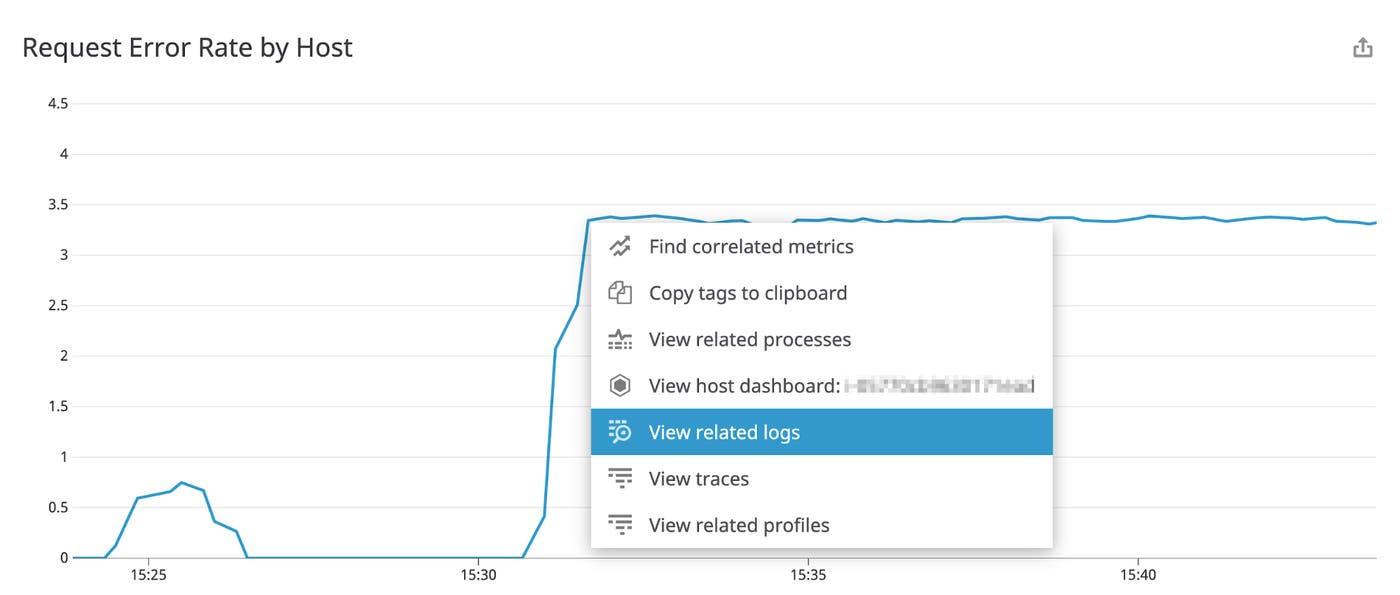
You can use Confluent's REST Proxy endpoints to produce or consume Kafka messages, and to get information about your cluster's producers, consumers, partitions, and topics. If you're producing and consuming messages via the REST Proxy, it's important to ensure that those messages are getting to and from Kafka successfully. For example, you can monitor the error rate of your Kafka cluster's REST Proxy (confluent.kafka.rest.jersey.request_error_rate) to ensure that requests are handled successfully. An increase in errors could indicate a problem with the REST proxy's configuration, or malformed requests coming from REST clients. The screenshot below shows an increase in the rate of errors returned by the REST proxy. The graph alone doesn't indicate the cause of the problem, but you can select View related logs to quickly troubleshoot the issue.
Monitor ksqlDB metrics and logs
ksqlDB is Confluent's streaming SQL engine that allows you to query, explore, and transform the messages moving through your data pipeline. If you're using ksqlDB to transform your data, you can set an alert on any increase in ksqlDB's error rate (confluent.ksql.query_stats.error_rate) to automatically notify you if ksqlDB queries are failing to process the messages in your data stream. To monitor the activity level of ksqlDB, you can keep an eye on the number of currently active queries (confluent.ksql.query_stats.num_active_queries) and the amount of data ksqlDB queries have consumed from your data streams (confluent.ksql.query_stats.bytes_consumed_total).
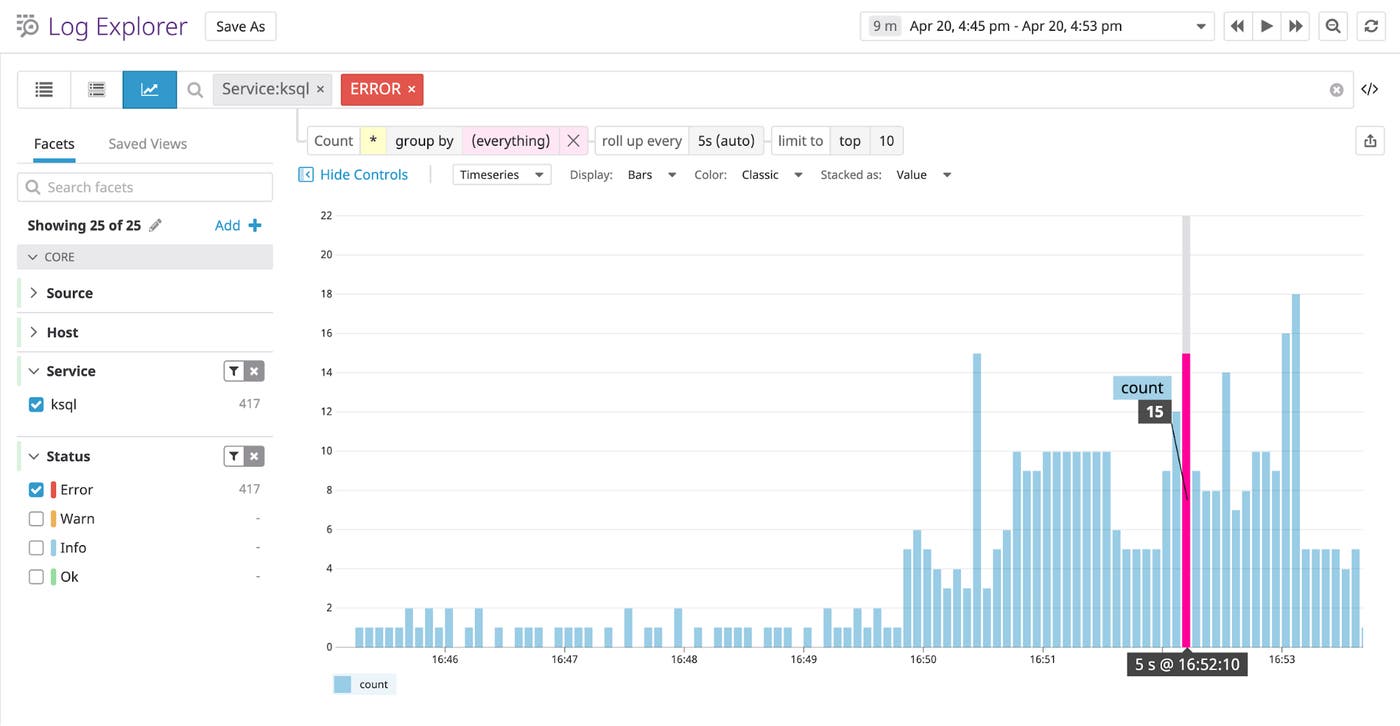
You can also collect and analyze ksqlDB processing logs to debug slow or failed queries. In the screenshot below, the log analytics view shows a sharp increase in the rate of error logs. You can filter, aggregate, and explore your ksqlDB service logs to find the cause of the problem, and then export your results to a dashboard or monitor to keep an eye on this data in the future. Note that this view uses a filter to show only logs tagged service:ksql.
Ensure the health of your Schema Registry
Schema Registry provides a way for you to validate the data in the messages sent to and from Kafka topics. If Schema Registry is unhealthy, it can degrade the throughput of your Kafka cluster, so it's important to monitor its errors, latency, and number of TCP connections. If the values of these metrics rise unchecked, you need to troubleshoot the problem before it interferes with Kafka clients' access to Schema Registry and causes them to slow down.
Start monitoring Confluent Platform with Datadog
Datadog's new integration gives you deep visibility into your Confluent Platform environment—the Kafka components as well as the REST proxy, connectors, and ksqlDB. Datadog integrates with more than 1,000 technologies, providing comprehensive monitoring of your data streams, the applications and services they connect, and the infrastructure that runs it all. If you're not already using Datadog, you can start today with a 14-day free trial.

