John Matson
You want to know when something unexpected is happening in your infrastructure. That’s why you monitor, right? So you set thresholds and sleep soundly knowing that you’ll be alerted whenever those thresholds are crossed.
In practice, though, it’s not quite so simple… For many metrics it is nontrivial to define ahead of time what constitutes “normal” versus “abnormal” values. This is especially true for metrics whose baseline value fluctuates over time.
To make this problem more tractable, today we are introducing outlier detection in Datadog. This feature allows you to automatically identify any host (or group of hosts) that is behaving abnormally compared to its peers.
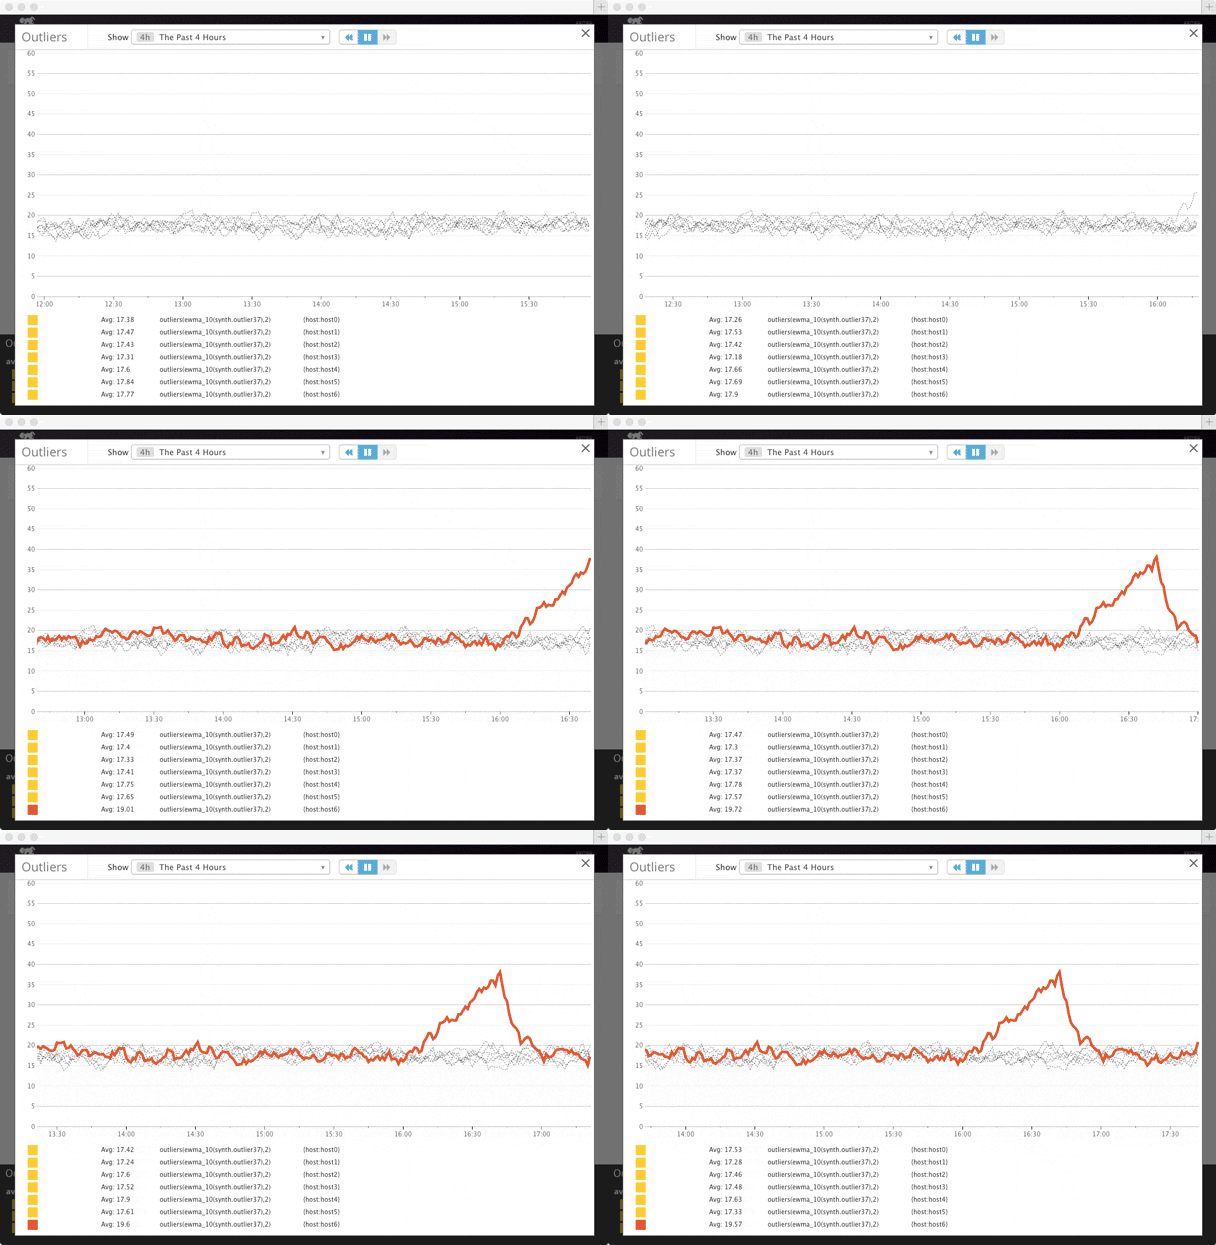
In the timelapse animation above, we see a few hours’ worth of metrics spooling out in just a few seconds. When one host starts to deviate from the rest, it is automatically flagged as an outlier.
How to use it
You can use outlier detection to fire off an alert when one machine starts reporting errors at an aberrant rate, or to identify at a glance whether your latency spike is attributable to a particularly slow region or availability zone. And you can do all that without having to choose a fixed threshold for what constitutes “anomalous” metrics. Datadog runs a statistical analysis in real time on all your hosts to determine the baseline, and to assess whether any hosts are deviating significantly from that baseline.
Adding outlier detection to any timeseries graph or creating an automated outlier alert takes just a few clicks.
Graphing outliers on dashboards
Adding outlier detection to your dashboards can help you spot problem hosts that can be difficult to identify otherwise.
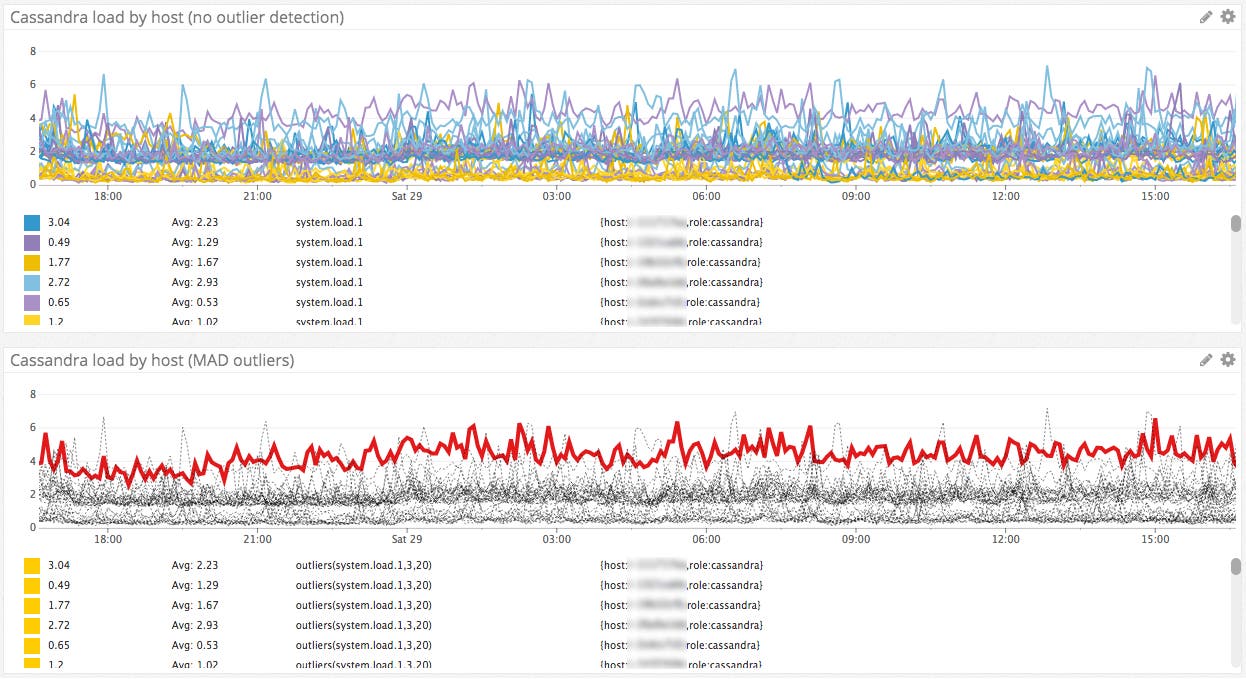
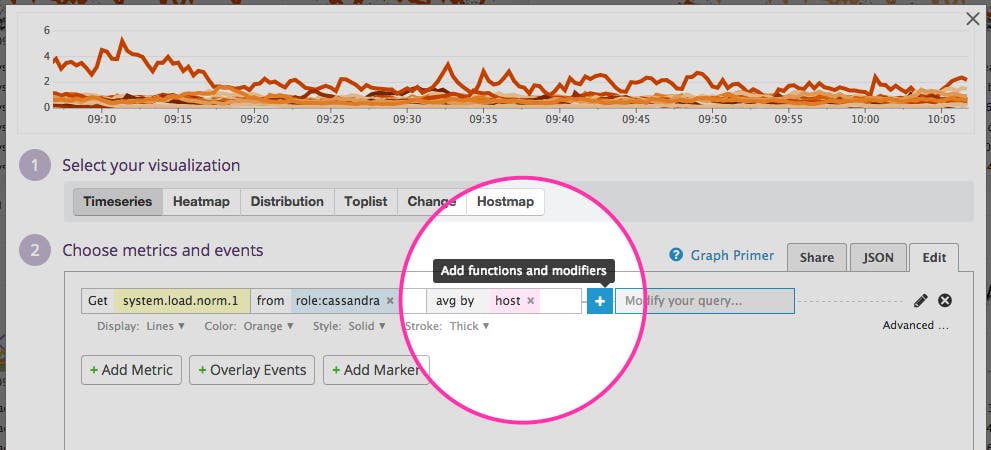
To add outlier detection to a timeboard or screenboard graph, click the plus sign in the graph editor, and then select “outliers” from the dropdown menu of functions and modifiers.
Alerting on outliers
Outlier monitors generate automated alerts about anomalous metrics, which can be sent via email, Slack, PagerDuty, or any other communication tool that Datadog integrates with. Creating a monitor also gives you access to our new monitor status page pictured below, which provides a comprehensive overview and history of your monitored infrastructure so you can see when and where anomalies are occurring.
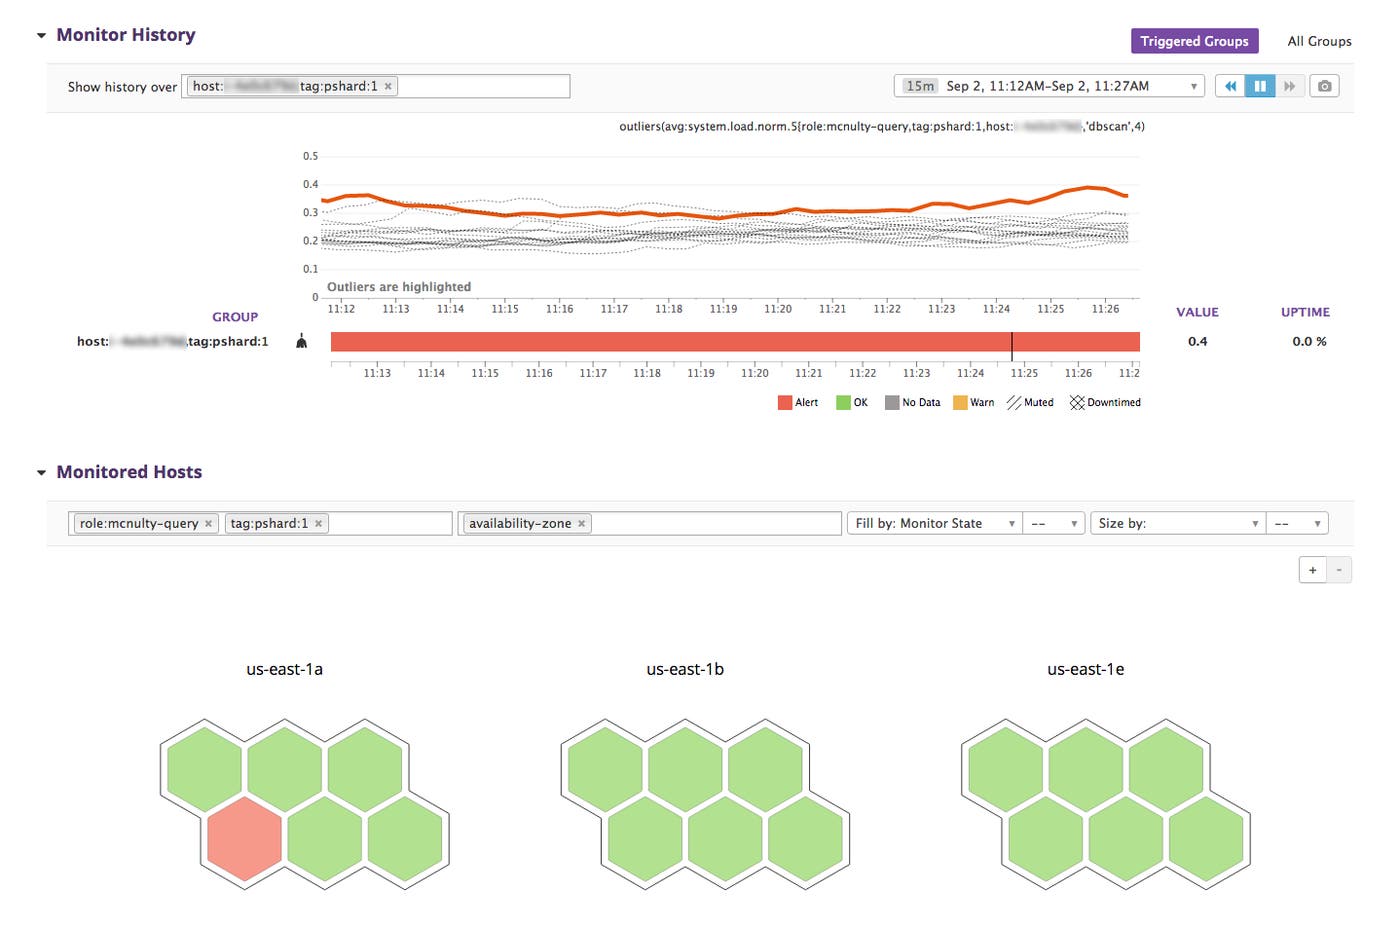
To start alerting on outliers, simply select “Outlier” as the type when creating a new monitor.
How it works
Under the hood, Datadog offers the choice of two algorithms for identifying outliers: DBSCAN (density-based spatial clustering of applications with noise) or MAD (median absolute deviation). DBSCAN is the default, and, with only one parameter to select in our implementation, it is the simplest to get started with. For more on DBSCAN and MAD, check out this companion post from Datadog data scientist Homin Lee.
Happy outlier hunting
We hope that you find outlier detection to be a valuable part of your monitoring and alerting toolkit. We’re thrilled to be able to put these powerful algorithms in your hands. Our data science and data engineering teams are also working on new algorithmic graphing and alerting features, which will be added in the near future.
If you don’t yet have a Datadog account, you can apply outlier detection to your own infrastructure by signing up for a free trial of Datadog.
